
 ?Mathematical formulae have been encoded as MathML and are displayed in this HTML version using MathJax in order to improve their display. Uncheck the box to turn MathJax off. This feature requires Javascript. Click on a formula to zoom.
Abstract
Introduction: Models of dose-effect relationships seek systematic and predictive descriptions of how cell survival depends on the level and duration of the stressor. The CEM43 thermal dose model has been empirically derived more than thirty years ago and still serves as a benchmark for hyperthermia protocols despitethe advent of regulatory network models.
Objective: In this paper, we propose and realize a simple experimental test to assess whether mechanistic models can prove more reliable indicators for some protocols. We define two time-asymmetric hyperthermia profiles, faster rise than decay or slower rise than decay, for which the CEM43 model predicts the same survival while a regulatory network model predicts significant differences.
Materials: Experimental data (both control 37°C and hyperthermia assays) were collected from duplicate HeLa cell cultures. Cells were imaged before and 24, 48 and 72 h after the hyperthermia assay double-stained with fluorescein-5-isothiocyanate (FITC)-labeled annexin V and propidium iodide for detecting cell death.
Results: Survival experiments of HeLa cells show that a fast temperature rise followed by a slow decay can be twice more lethal than the opposite, consistently with the prediction of the network model.
Conclusions: Using a model reduction approach, we obtained a simple nonlinear dynamic equation that identifies the limited repair capacity as the main factor underlying the dose-asymmetry effect and that could be useful for refining thermal doses for dynamic protocols.
1. Introduction
Hyperthermia has been widely used as an anticancerous treatment especially in combination with chemotherapy or with radiotherapy [Citation1,Citation2]. Inside cells, hyperthermia causes proteins to misfold, and hence to lose their functionality, which may lead to cellular dysfunction and eventually death [Citation3]. Following heuristic regression analysis of dose-response curves to a transient step of a temperature profile, a standardized measure of thermal doses, the Cumulative Equivalent Minute at 43°C (CEM43), has been developed [Citation4,Citation5] and remains broadly used, even for more complex temporal variations of temperature profiles.
In parallel, the signaling, regulatory and repair pathways involved in the response to hyperthermia have been extensively characterized [Citation6–8], and data-driven models of heat-shock response network (HSRN) have been established [Citation9–11]. Dynamical models of the HSRN offer the possibility to simulate and predict the time course of misfolded proteins, molecular chaperones and heat-shock factors, following any time profile of single thermal doses. The quantitative study of intracellular dynamics can, therefore, be exploited to infer survival response to time-varying stress conditions.
In this letter, we aim to revisit the concept of thermal doses within the dynamical framework of stress response networks. Thus, we derive a model coupling the HSRN with a population equation to describe the dose-response curves for rectangular-shaped hyperthermia profiles [Citation12] with a similar accuracy as the CEM43 model. The dynamical behavior of the network model nevertheless implies a survival response that can be sensitive to the time profile of a thermal protocol. In fact, in vitro and in silico experiments show that a fast rise followed by a slow decay of temperature can be up to twice more lethal than a slow rise followed by fast decay, in sharp contrast with CEM43 predictions. Then, we identify the key dynamic ingredient responsible for the asymmetry effect by mathematical analysis, and thus derive a low-dimensional dynamical model that is simple, accurate and generic enough to replace the CEM43 description for time-varying heat profiles. Finally, we use the low-dimensional dynamical model to investigate the synergy between hyperthermia and drug treatment that target molecular chaperones.
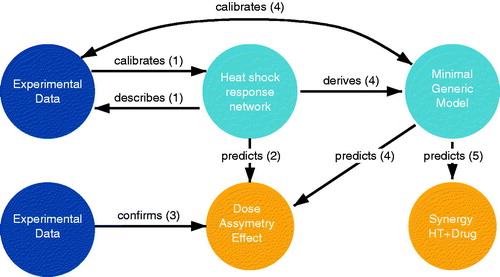
To make the research strategy clear, the workflow is synthesized as a cartoon in . The main steps are: (1) calibrate a mathematical model that describes cell survival in HeLa cell line, (2) predict dose asymmetry effect, (3) validate the prediction by experiments, (4) reduce the model to keep only the main ingredients, and thus build a generic model, (5) use the reduced generic model to predict synergy between hyperthermia and a specific drug treatment.
Figure 1. Research workflow. The main steps of the performed research are synthesized to highlight the crosstalk between experimental data (dark blue), mathematical modeling (light blue), and model predictions (yellow). HT: Hyperthermia.
2. Material and methods
2.1. Cell culture
HeLa human cancer cells were grown in Dulbecco’s modified Eagle’s medium (DMEM; Lonza, Levallois-Perret, France) supplemented with 10% (v/v) fetal bovine serum (FBS; Life Technologies, Saint-Aubin, France), 1% L-glutamine (2 mM) and 1% (v/v) penicillin-streptomycin (100 IU/ml) (Lonza). HeLa cells were maintained at 37 °C under a 5% CO2 (v/v) humidified atmosphere, subcultured at preconfluency by trypsinization twice weekly, and routinely screened for the presence of mycoplasma to avoid collecting data from unknowingly contaminated cell cultures. All experiments were performed on 2-day-old cell cultures (60–80% confluency) prepared in 35-mm Petri dishes (Sarstedt, Marnay, France) in complete DMEM without phenol red.
2.2. Hyperthermia experimental assays
Experimental data (both control 37 °C and hyperthermia assays) were collected from duplicate HeLa cell cultures. Culture dishes were maintained in a custom-built incubator wherein temperature, humidity and atmosphere are monitored. The incubator, described in [Citation13], contains four culture dishes where one of the dishes hosts a thermistor which monitors the applied temperature, two dishes with two different cell culture samples were used for cell survival experiments (see Figure S14 of the Supplemental Material for an incubator picture). Measuring the inertial time scale of the incubator, allows to predict the time profiles that deliver equivalent CEM43 doses. In addition, a trial-error procedure had to be performed to obtain two triangular temperature profiles with equivalent CEM43, since the precise temperature depends on the room temperature conditions.
Cells were double-stained with fluorescein-5-isothiocyanate (FITC)-labeled annexin V (AV) (1:2000 dilution) and propidium iodide (PI) (1:10,000 dilution) (Sigma-Aldrich, L’Isle d’Abeau Chesnes, France) for detecting cell death (apoptotic and necrotic cells, respectively). Samples were placed into a custom-built incubator regulated to maintain physiological conditions in temperature, humidity, and CO2, and controlled with a software monitoring hyperthermia profiles. Cells were imaged before and 24, 48 and 72 h after the hyperthermia assay, under a Nikon TiE epifluorescence microscope equipped with a XY-motorized stage and through a 4× objective (NA = 0,13). Counted viable cells correspond to attached cells that are double-negative for AV and PI.
Spatial homogeneity of the applied temperature stress is double checked. First, spatial homogeneity is checked in the incubator by using a Rhodamine B assay, since the relative fluorescence of Rhodamine B is known to vary with temperature. Second, the analysis of AV-PI assay images does not show any spatial correlation in cellular death.
2.3. Cumulative equivalent minute at 43 °C
The Cumulative Equivalent Minutes at 43 °C (CEM43) is a normalized tool to determine the thermal dose [Citation4]. The CEM43 description is based on the direct cytotoxic effect of hyperthermia and it aims to convert a given hyperthermia profile into an equivalent exposure time at the temperature of 43 °C [Citation4] by computing
where T(t) is the heat time profile and R is an experimentally-determined factor that compensates for 1 °C temperature change either above or below
to obtain the same cellular survival fraction. The analysis of HeLa S3 cell survival curves [Citation12] determines
and
°C.
In the framework of the CEM43 description, the survival probability corresponds to where k is estimated by linear regression on experimental value of the survival probability at 43 °C. The analysis of HeLa S3 survival [Citation12] gives k = 0.86 h−1.
2.4. Trapezoidal profile
The generalized trapezoid hyperthermia time profile is characterized by a linear increase in temperature from 37 °C, to during the
time interval, a constant temperature
during the
time interval, and a linear decrease in temperature, from
to 37 °C, during the
time interval (see inset in for graphical display). For a given set of parameters
the saturation and asymmetry indexes are defined, respectively, by
and
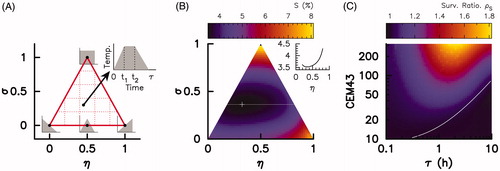
Figure 2. Survival response landscape for trapezoidal time profile. (A) Landscape of trapezoidal shapes parametrized by four parameters: maximum temperature duration τ, saturation index σ, and asymmetry index η. (B) Model-predicted survival fraction in the
plan for a 3 h exposure heat stress (τ = 3 h) trapezoidal time profile having an identical cumulative equivalent minute at 43 °C value of 180 CEM43 (
is computed accordingly). The survival fraction varies from 3.5%
to 8.1%
which corresponds to the step-up/step-down profile. The survival fraction dependency on η for the
(white line) is displayed in inset. (C) Model-predicted survival ratio, defined as the ratio of survival response between the slow–fast
and fast– slow
thermal profile, for various exposure duration τ and cumulative equivalent minute at 43 °C(CEM43) values; solid white line corresponds to
of 43 °C. The dose asymmetry effect arises for hour-long hyperthermia with Tmax >43 °C.
2.5. Survival ratio
Keeping a constant CEM43 for different shapes of the temperature profile normally requires different maximum temperatures for different σ and η values. To remove the side effect of different
while varying the asymmetry index η, we compare the survival rate for two archetypical asymmetrical triangle profiles having the same
(since they are identical up to the transformation of time
): (i) A step-up/ramp-down profile
(ii) a ramp-up/step-down
The doses-asymmetry effect is thus measured by the ratio:
(1)
(1)
called survival ratio, for various CEM43 and stress duration τ values.
3. Results
3.1. A dynamical model consistent with the dose-survival curves of HeLa cells
A differential equation model of survival response to hyperthermia is designed by coupling an intracellular kinetic model of the heat shock response network of HeLa cells with a cell-population ):
(2)
(2)
(3)
(3)
Figure 3. A predictive dynamical model of cellular viability (A) Scheme of heat-induced damage, repair and death. (B) Survival fraction in response to hyperthermia doses with rectangular time profiles of various amplitude and duration; experimental results from [Citation12] (dots), output of the dynamical model (solid lines), CEM43 description (dashed lines). A color code is used to indicate the maximum temperature which is also indicated directly on the graph. (C) Log-likelihood landscape in the free parameter plane the round circle indicates optimal parameter set used in (B). RMSE: root-mean-square error.
![Figure 3. A predictive dynamical model of cellular viability (A) Scheme of heat-induced damage, repair and death. (B) Survival fraction in response to hyperthermia doses with rectangular time profiles of various amplitude and duration; experimental results from [Citation12] (dots), output of the dynamical model (solid lines), CEM43 description (dashed lines). A color code is used to indicate the maximum temperature which is also indicated directly on the graph. (C) Log-likelihood landscape in the free parameter plane (α−β), the round circle indicates optimal parameter set used in (B). RMSE: root-mean-square error.](/cms/asset/7d1b995c-0b7f-4976-b2bd-a20a6ba28104/ihyt_a_1633478_f0003_c.jpg)
The data-driven HSRN model (EquationEquation (2)(2)
(2) ) is taken from [Citation9] where
denotes a vector of species concentrations and T denotes the temperature (equations and parameters values are defined in Sec. S1 of the Supplemental Material). Without going into details, EquationEquation (2)
(2)
(2) describes dynamical interactions between three partners: (1) heat-labile proteins, (2) molecular chaperones and (3) a transcription factor. In culture conditions (at 37 °C) the transcription factor is sequestered by chaperones; upon hyperthermia, the heat-labile proteins get damaged, then the molecular chaperones desequester the transcription factor to bind damaged proteins and try to repair them, meanwhile, the transcription factor induces the transcription of the molecular chaperones. So, EquationEquation (2)
(2)
(2) predicts the dynamics of the amount of misfolded proteins (denoted by
) and the remaining amount of heat-labile proteins
upon hyperthermia. All the kinetic parameters of EquationEquation (2)
(2)
(2) have been previously estimated in [Citation9].
The cell-population equation EquationEquation (3)(3)
(3) describes the time evolution of the number N of viable cells, γ denotes the proliferation rate and κ denotes the death rate. As the first approximation, the transition rate κ is likely to depend on two deleterious effects of hyperthermia, first, the accumulation of misfolded proteins (
) [Citation14], and second, the loss of functional heat-labile proteins (
) [Citation15]:
(4)
(4)
where α and β are the only parameters to be estimated in the model.
From the population equation, one can compute the survival probability following a given thermal protocol as the number of viable cells in the presence of heat stress normalized to the number of viable cells without heat stress. EquationEquation (3)(3)
(3) yields that the number N of viable cells at time t is given by
(5)
(5)
whereas in the control at 37 °C, the number N37 of viable cells at time t increases exponentially in time
(the death rate is negligible in the control). The survival probability
is, therefore, given by the following exponential function
(6)
(6)
where
is a time interval of the experiment. The survival probability neither depends on the growth rate γ nor on the initial number of viable cell N(0) but only on the cumulative death rate.
As shown in , the derived model describes quantitatively the survival fraction experimentally obtained by cell colony assay performed after a step-up/step-down hyperthermia protocol of various amplitudes and durations. First, we need to adjust the two parameter values α and β in EquationEquation (4)(4)
(4) according to their adjustment score of the experimental data which are typically used to calibrate CEM43 models [Citation12] (). We found that a range of combined values of α and β can adjust properly the data while the optimal solution suggests that both protein loss and accumulation of misfolded proteins contribute to the loss of cell viability (See Figure S4A of the Supplemental Material). For a single rectangular-shaped hyperthermia dose, the dynamical model presented above provides a similar adjustment score as the CEM43 description (dashed lines of ) which is controlled by three parameters k, R and Tc (see Materials and methods).
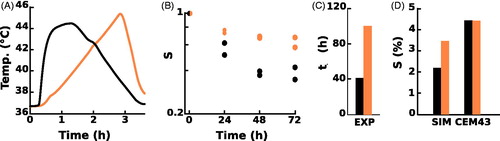
Figure 4. Temporal dose asymmetry effect of the survival response. (A) Temperature time profile experiment by cell colony in the case of 196 CEM43 fast–slow (black line) or 200 CEM43 slow–fast (orange line) protocol. (B) Relative number of attached viable cells in the colony during the recovery at 37C after a slow–fast (black dots) or a fast–slow (blue dots) thermal protocol. Cells were exposed to hyperthermia from 0 h to 3 h. (C) Cell colony growth rate normalized to the control experiment at cell culture conditions obtained in the experiment (Exp). (D) Survival fraction predicted by the dynamical model (SIM), or predicted by the CEM43 description (CEM43). In C and D, black bars correspond to the fast–slow protocol and orange bars correspond to the slow–fast protocol.
In contrast to the CEM43 description, which must assume a discrete change of parameters at the transition close to 43 °C, the dynamical model accounts for this effective threshold by the saturated renaturation rate of misfolded proteins due to the timescales and the limited copy number of molecular chaperones [Citation9]. When the temperature exceeds a threshold around 43 °C, the production rate of damage exceeds the maximal renaturation rate such that damage rapidly accumulates and is more likely to induce death.
3.2. Dose time-profile effects in experiments and models
In order to distinguish between the dynamical and CEM43 descriptions, we perform an experimental test based on two asymmetrical hyperthermia time profiles. We compare the survival response between cell colonies that are exposed to a fast rise followed by a slow decay in temperature (fast–slow protocol) and to a slow rise followed by a fast decay in temperature (slow–fast protocol). If the two triangular thermal profiles reach the same maximal temperature, the integral formula of the CEM43 description entails the same survival response, whereas a dynamical model can lead to significant differences in the accumulation of misfolded proteins and in corresponding survival responses.
Triangular thermal profiles are difficult to achieve in experiments due to the thermal inertia of the cell incubator. First, we consider a thermal protocol of 3 h in order to avoid thermotolerant effects that appear for a longer exposure and rule out the validity of CEM43 model [Citation16]. Second, we carefully monitor the temperature in dishes to obtain two asymmetric fast–slow and slow–fast thermal profiles which are characterized by similar CEM43 doses of 196 min and 200 min, respectively (). We also run a control experiment without any hyperthermia protocol.
The measurements of cell number over time normalized to the cell number in the control experiment reveal that the fast–slow protocol is more lethal than the slow–fast one (). In the control experiment, the cell population grows due to proliferation and is increased by a factor 1.55 in 2 days. At the same date, cell population that is exposed to the fast–slow (respectively, slow–fast) protocol, is reduced by a factor 2.61 (respectively, 1.46).
We use regression analysis to fit the cell population exponential decay over time and to extract the typical time at which the cell population is equal to half of the initial population (). We obtain a typical decay time of 39 h in the case of the fast–slow protocol and 86 h in the case of the slow–fast protocol. Whereas, the CEM43 description predicts a similar survival probability of about 4% for both hyperthermia profiles, the dynamical model predicts the survival rate will be increased from 2% to 3.5% (almost two fold) changing the symmetry of the hyperthermia profile from the fast–slow protocol to the slow–fast protocol ().
In experiments, we monitor over time the number of surviving cells and quantify the harmful effect of hyperthermia by a decay-time rather than by a cell colony assay (Figure S2 of the Supplemental Material). Therefore we cannot extract a measurement similar to the survival fraction and directly compare with the model prediction. However, these experimental results bring evidence that the temporal shape of hyperthermia has a significant effect on the survival response even in the case of a single and short thermal dose of roughly the same CEM43 dose, duration and maximal temperature.
3.3. Differential survival response for generic trapezoidal hyperthermia profiles
A detailed description of how the temporal shape of hyperthermia influences survival response is obtained by computing numerically the survival response for all trapezoidal-shaped time profiles having the same CEM43 dose. Besides the parameter τ, which measures the exposure duration at a temperature above 37 °C, the trapezoidal shape is defined by two indexes ranging within the saturation index σ, and the asymmetry index η (). All trapezoidal shapes can be generated by varying σ and η inside a triangular region of the
plane (). More specifically, the saturation index σ defines the fraction of time upon the maximum temperature during the hyperthermia protocol; for instance, a rectangular-shaped profile corresponds to σ = 1 whereas a triangular-shaped profile corresponds to σ = 0. On the other side, the asymmetry index η indicates the timing of the center of the phase at maximum temperature
in units of τ; for instance, η = 0 corresponds to a step-up/ramp-down profile, η = 1 corresponds to a ramp-up/step-down profile and
corresponds to a time-symmetric ramp-up/ramp-down profile.
For a given exposure duration τ and a given CEM43 dose, one can compute how the survival response depends on the values in the space of trapezoidal shapes. Given these parameters, the maximum temperature
is computed to reach the target CEM43 value according to the analytical formula, and is shown to be independent of the value of the asymmetry index η (see Sec. S3 of the Supplemental Material). Numerical simulations performed for τ = 3 h and
show that the survival rate varies significantly with σ and η in a non-trivial manner (). Regarding symmetric hyperthermia profiles (
), the least lethal profile is the step-up/step-down profile (σ = 1) while the most lethal profile is the trapezoidal profile with
keeping in mind that
is varying. Regarding asymmetric hyperthermia profiles, cell survival is always increased when η increases. This result suggests the generality of the time-asymmetric effect where slow-rise/fast-decay profile (i.e.,
) is less lethal than the fast-rise/slow-decay one (i.e.,
).
It remains to quantify how the dose time-asymmetry effect depends on the CEM43 thermal dose and on the exposure total duration τ. We, therefore, focus on the two profiles, step-up/ramp-down and ramp-up/step-down
and monitor the ratio
of the survival probabilities for the two profiles (). The dose time-asymmetry effect shows a maximal ratio
and mainly appears in the
area where
C. In contrast, hyperthermia profiles associated with
C display a survival ratio
As a control, we check whether the dose-asymmetry effect depends on the values of α and β adjusted previously (). For a heat stress of dose and duration τ = 3 h, the survival ratio varies from 1.4 to 1.6 for the combination of α and β values that correspond to a valley of the fitness landscape (Figure S4B of the Supplemental Material). The dose-asymmetry effect is slightly more pronounced when the lack of proteins is the dominant effect in the transition rate EquationEquation (6)
(6)
(6) .
3.4. Model reduction highlights the limited repair capacities as underlying dose-asymmetry effect
In this section, we seek to identify both biochemical and dynamical mechanisms which are responsible for the dose time-asymmetry effect. The strategy consists of reducing the model to isolate such mechanisms. We first check that disrupting the transcriptional regulation of HSP by HSF1 does not decrease the time-asymmetry effect of the thermal dose profile (Figure S5 of the Supplemental Material). Assuming a constant pool of total HSP and HSF proteins and performing a quasi-steady state approximation allows to reduce the HSRN and population model (EquationEquations 2–3) to a system of two differential equations that describe the time evolution of the amount of misfolded proteins (Sec. S6 of the Supplemental Material) and of the number of viable cells N:
(7)
(7)
(8)
(8)
Figure 5. A minimal dynamical model captures thermal dose responses. (A) Parameter estimation based on a survival fraction induced by single rectangular-shaped hyperthermia doses of various amplitudes and durations: experimental results from [Citation12] (dots), output of the dynamical model (black lines). (B and C) are similar as and except that the predictions are computed with the reduced model 7. (C) The survival fraction varies from 5% () to 9.7%
which corresponds to the step-up/step-down profile. The survival fraction dependency on η for the
(white line) is displayed in insert.
![Figure 5. A minimal dynamical model captures thermal dose responses. (A) Parameter estimation based on a survival fraction induced by single rectangular-shaped hyperthermia doses of various amplitudes and durations: experimental results from [Citation12] (dots), output of the dynamical model (black lines). (B and C) are similar as Figure 2(B) and Figure 2(C) except that the predictions are computed with the reduced model 7. (C) The survival fraction varies from 5% ((η=0.33;σ=0.24)) to 9.7% (η=0.5;σ=1) which corresponds to the step-up/step-down profile. The survival fraction dependency on η for the σ=0.24 (white line) is displayed in insert.](/cms/asset/4e2a9fd7-e6aa-4b91-8daa-173913ecb1aa/ihyt_a_1633478_f0005_c.jpg)
EquationEquation (7)(7)
(7) describes the dynamics of the amount of misfolded proteins
as a result of three processes: (1) the denaturation, which creates misfolded proteins from heat-labile proteins with a heat dependent rate; (2) the degradation, which destroys misfolded proteins without repair trials; (3) the renaturation, which turns back misfolded proteins into heat-labile proteins, and is limited by the amount of molecular chaperones. So, in EquationEquation (7)
(7)
(7) ,
is the temperature-dependent production rate of misfolded proteins,
is the degradation rate of misfolded proteins and
is the renaturation rate, which is limited to the maximum value
due to the restricted pool of molecular chaperones. In this effective model, the quantity
denotes the concentration of misfolded proteins in units of the concentration of the repair proteins and is then a dimensionless quantity:
value means that the misfolded protein copy number exceeds the molecular chaperone copy number such that the renaturation rate saturates to
and misfolded proteins become slowly degraded rather than quickly renaturated.
This reduced model works equally well with the detailed HSRN model to adjust the survival data of HeLa cells to rectangular-shaped hyperthermia profile [Citation12]. The best fit is displayed in and is obtained for the following parameter set: h,
°C and
The reduced model EquationEquation (7)
(7)
(7) also captures the dose-asymmetry effects depicted by the survival rate in the space of trapezoidal-shaped hyperthermia profiles (compare with ) and by the survival ratio in the space of hyperthermia duration and dose (compare with ). The possibility to capture these effects with a reduced model containing only the production, the degradation and the renaturation processes of misfolded proteins demonstrates that the dose-asymmetry effect originates from the limited resources of the chaperone-dependent repair process. A thorough mathematical analysis of the reduced model (Sec. S7 of the Supplemental Material) demonstrates indeed the crucial role of the nonlinear saturated function of the renaturation process. Using instead a power-law-like nonlinearity, the slow-rise/fast-decay hyperthermia profile
can be more lethal than a fast-rise/slow-decay one
(Sec. S7.2 of the Supplemental Material). Identification of distinct dynamical response regimes to a transient stress allows also to determine the range of hyperthermia doses and durations for which the dose-asymmetry effect is prone to occur (Sec. S7.4 and Figures S11–S13 of the Supplemental Material).
3.5. Inhibition of repair capacities increase the temperature sensitivity
The reduced model (EquationEquation (7)(7)
(7) ) highlights the limited repair capacities as a key dynamical ingredient of describing cell survival upon hyperthermia. It is, therefore, tempting to modulate, and more precisely to inhibit, these repair capacities in order to increase the lethal effect of the hyperthermia treatment, for instance. In experiments, the inhibition of the repair capacities could be achieved by drug inhibition of the molecular chaperones, and more specifically of the HSP70 proteins which are mostly involved in the protein folding [Citation17]. HSP70 inhibition has been already suggested as an anti-cancer strategy [Citation18,Citation19], and several HSP70 inhibitors have been identified [Citation20–22]. HSP inhibition has also been shown to sensitize melanoma cells to hyperthermia [Citation23].
In the reduced mathematical model, a modulation of HSP by a factor r (r = 1 being the control without any HSP modulation) leads to a modification of EquationEquation (7)(7)
(7) as
(9)
(9)
while EquationEquation (8)
(8)
(8) is unchanged.
To study the synergistic effects between hyperthermia and a drug treatment targeting HSP, we simulate the effect of a transient modulation of HSP applied during 10 h in parallel with hyperthermia protocols. The modulation procedure consists of changing the modulation parameter r during the first 10 h to a constant value lower than 1, indicating a decrease of HSP. After 10 h, r is restored to the control value r = 1. The change in r is instantaneous and not gradual. One should note, the same results and conclusions can be obtained for any HSP inhibition time as long as it exceeds the hyperthermia exposure time τ. We also assume that the hyperthermia protocols and the transient modulation of HSP are applied at the same date, in order to avoid the addition of an extra parameter standing for the time delay between the two treatments. Finally, we used a control group that is subjected to neither HSP modulation nor hyperthermia to determine a cell survival fraction.
First, we focus on the step-up/step-down hyperthermia only. We fix the HSP inhibition level r and compute the predicted cell survival fraction upon step-up/step-down hyperthermia of various durations τ and amplitudes (). When (τ = 0), we obtained only cell survival for the drug treatment. In this case, no significant reduction of the cell survival is observed: even a strong inhibition (r = 0.25) for 10 h leads to 80% cell survival (). For a given hyperthermia protocol (
), however, the model predicts a significant decrease of cell survival fraction with the decrease of the repair capacities (). For instance, 2 h at 41 °C results in a cell survival of 92% if r = 1 but only 41% if r = 0.25, that is, when the repair capabilities are reduced by a factor of four.
Figure 6. Inhibition of repair capacities increases the temperature sensitivity. (A,B) Model-predicted survival fraction upon the step-up/step-down hyperthermia in combination with a transient HSP inhibition of 10 h duration and various intensities: control r = 1 (solid line), r = 0.75 (dashed line), r = 0.5 (dashed-dot line), r = 0.25 (dots line). Survival fraction is computed for a fixed C (A) or
C (B) and various exposure times τ. (C) Model-predicted survival fraction as a function of the HSP inhibition level r. The exposure duration of the hyperthermia is fixed (τ = 2 h). The different solid lines correspond to different
values (37 °C, 41 °C, and 42 °C) which are indicated directly on the plot. (D,E) Model-predicted survival ratio upon a transient HSP inhibition of 10 h duration (D) r = 0.5, (E) r = 0.25. The survival ratio, defined as the ratio of survival response between the slow–fast
and fast–slow
thermal profile, is computed for various exposure duration τ and cumulative equivalent minute at 43
C (CEM43) values; solid white line corresponds to
of 43 °C.
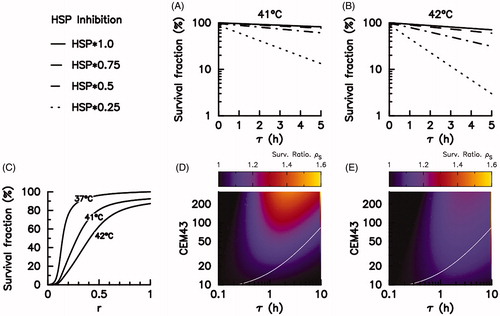
The impact of the temporary HSP inhibition on the cell survival upon hyperthermia displays a threshold effect on the inhibition level. To characterize this threshold effect, we fix the exposure time τ and the maximum temperature of the step-up/step-down hyperthermia and vary the level of HSP inhibition r from 1 to 0 (). As shown in (), the cell survival varies nonlinearly with the inhibition level r and becomes significant mostly when r < 0.5, i.e., for an HSP inhibition higher than 50%.
Next, we investigated how the transient modulation of HSP affects the dose asymmetry effect by computing the survival ratio upon HSP inhibition of 10 h duration. Without HSP modulation, the dose asymmetry effect happens mainly when C, whereas upon a transient inhibition of HSP dose asymmetry effect is also found for
C. The higher the HSP inhibition the lower the
required to achieve dose asymmetry effect (). As an example, for a 2 h duration hyperthermia of 20 CEM43 (that gives
C) the survival ratio value is 1 in the control (r = 1) but 1.06 for r = 0.5 and 1.09 for r = 0.25. Meanwhile, for
C, a transient inhibition of HSP tends to lower the value of the survival ratio.
4. Discussion
Dynamical models of cellular survival response to time-varying hyperthermia protocols are derived by combining a regulatory network model and a cell population model. The predictive capability of these models is demonstrated in the case of two asymmetric dose profiles whose experimentally-measured effects on cell survival are captured by the mechanistic network model and not by the descriptive CEM43 model. The network model brings also the possibility to identify the regulatory mechanisms responsible for the dose-asymmetry effect. For a single and short thermal dose, a step-up/ramp-down hyperthermia profile is more lethal than a ramp-up/step-down profile due to the intrinsic limitations and timescales of the chaperone-dependent repair process. This mechanism operates at the level of the renaturation and degradation of misfolded proteins and does not involve transcriptional upregulation of chaperones. This time-profile effect, therefore, differs from those obtained with protocols delivering a pretreatment as a step [Citation12] or a ramp [Citation24] leading to a significant increase of the survival rate, referred as thermotolerance.
Network models are valuable to study the response to time-varying stress profiles, but more generally to describe more accurately threshold effects. Experimental data reveal a sharp transition in the survival response (around 43 °C for HeLa cells) in many cell lines [Citation25–27]. The dynamical network model implements the sharp transition through the saturation mechanism in the chaperone repair process whose occurrence depends not only on the production rate of misfolded proteins, but also on the history and capacity of cells. By modulating the saturation temperature threshold, one can modify the lethal effect of the hyperthermia protocol. A fast rise in temperature, that exceeds the threshold, will rapidly saturate the repair system, even for some time after the temperature falls below the threshold, which is related to the step-down effect [Citation28–30]. For hyperthermia protocols below the threshold, the temporal profile does not matter and the CEM43 description remains valid. This is important in practice because the CEM43 description is widely used as a medical imaging tool to prevent the induced harmful thermal side effects (the exposure being limited around 2 CEM43) [Citation31], and those techniques induce thermal profiles with a fast variation. In fact, the dose asymmetry effect we focus on, can only be achieved in HeLa cell line if the maximum temperature reached exceeds 43 °C.
The survival response is known to strongly depend on cell type [Citation32] even though core features are preserved in all of them. The possibility to describe the damage, repair and death processes with a low-dimensional model is particularly appealing in the absence of data and knowledge of the heat-shock-response and death-response pathway mechanisms of any cell line. In contrast to CEM43, the parameters of this reduced model have a well-defined biological meaning related to synthesis, renaturation and degradation rates of misfolded proteins, which can all be measured experimentally. This type of low-dimensional dynamic and mechanistic models would be therefore a valuable tool to bridge the gap between heuristic descriptive models and detailed regulatory network models, and it has, thus, a great potential for guiding protocols and gaining biochemical insights. To illustrate this latter point, the model highlights the potential synergy between hyperthermia and a drug therapy that would target the molecular chaperones and inhibit the repair capability [Citation18–23]. While the idea that inhibiting HSP decreases the cell survival upon hyperthermia is quite straightforward, these preliminary investigations reveal this relationship to be non-trivial, such as a threshold effect on the level of inhibition or a dose-asymmetry effect at lower temperatures.
To conclude, this study presents the predictive potential of a biochemical network modeling approach that can be of practical use for optimizing protocols and treatment effectiveness. This approach allows to highlight the influence of the temporal dynamic of the hyperthermia protocol through the dose-asymmetry effect. However, we demonstrate that the dose-asymmetry effect only appears for some range of CEM43 and exposure duration () which are mostly outside of current clinical thermal protocols. With regard to thermally-induced cell killing and damage thresholds, the thermal exposure causing burns or thermal ablation is in general characterized by high maximum temperature and short exposure times. In this case, we demonstrated that the temporal modulation of the hyperthermia protocol does not affect cell killing as long as the exposure time remains shorter than time scale of misfolded protein degradation (here estimated at 11 min). With regard to hyperthermia treatments in cancer therapy, CEM43 is mostly between 1 and 20 and exposure time is shorter than an hour, which makes direct clinical exploitation of the dose asymmetry effect difficult. Nevertheless, the asymmetry effect demonstrates the capacity of the biochemical network modeling approach to quantitatively capture cell response to dynamic and synergistic perturbations. In that, the network modeling approach may be helpful in establishing new combined treatment strategies.
Supplemental Material
Download PDF (1.8 MB)Disclosure statement
No potential conflict of interest was reported by the authors.
Additional information
Funding
References
- Datta N, Ordóñez SG, Gaipl U, et al. Local hyperthermia combined with radiotherapy and-/or chemotherapy: recent advances and promises for the future. Cancer Treat Rev. 2015;41:742–753.
- Dewhirst MW, Abraham J, Viglianti B. Evolution of thermal dosimetry for application of hyperthermia to treat cancer. In: Ephraim M. Sparrow, John P. Abraham, John M. Gorman, editors Advances in heat transfer. Vol. 47. Elsevier; 2015. p. 397–421.
- Roti JLR. Cellular responses to hyperthermia (40-46 °C): cell killing and molecular events. Int J Hyperther. 2008;24:3–15.
- Sapareto SA, Dewey WC. Thermal dose determination in cancer therapy. Int J Radiat Oncol Biol Phys. 1984;10:787–800.
- Viglianti BL, Dewhirst MW, Abraham JP, et al. Rationalization of thermal injury quantification methods: application to skin burns. Burns. 2014;40:896–902.
- Morimoto RI. Regulation of the heat shock transcriptional response: cross talk between a family of heat shock factors, molecular chaperones, and negative regulators. Genes Develop. 1998;12:3788–3796.
- Voellmy R. On mechanisms that control heat shock transcription factor activity in metazoan cells. Cell Stress Chaper. 2004;9:122.
- Naidu SD, Dinkova-Kostova AT. Regulation of the mammalian heat shock factor 1. Febs J. 2017;284:1606–1627.
- Sivéry A, Courtade E, Thommen Q. A minimal titration model of the mammalian dynamical heat shock response. Phys Biol. 2016;13:066008.
- Sriram K, Rodriguez-Fernandez M, Doyle FJ. A detailed modular analysis of heat-shock protein dynamics under acute and chronic stress and its implication in anxiety disorders. PLoS One. 2012;7:e42958.
- Scheff JD, Stallings JD, Reifman J, et al. Mathematical modeling of the heat-shock response in hela cells. Biophys J. 2015;109:182–193.
- Gerner EW, Boone R, Connor WG, et al. A transient thermotolerant survival response produced by single thermal doses in hela cells. Cancer Res. 1976;36:1035–1040.
- Anquez F, El Yazidi-Belkoura I, Randoux S, et al. Cancerous cell death from sensitizer free photoactivation of singlet oxygen. Photochem Photobiol. 2012;88:167–174.
- Stefani M. Protein misfolding and aggregation: new examples in medicine and biology of the dark side of the protein world. Biochim et Biophys Acta. 2004;1739:5–25.
- Takahashi A, Yamakawa N, Mori E, et al. Development of thermotolerance requires interaction between polymerase-β and heat shock proteins. Cancer Sci. 2008;99:973–978.
- Jones E, Thrall D, Dewhirst MW, et al. Prospective thermal dosimetry: the key to hyperthermia’s future. Int J Hyperther. 2006;22:247–253.
- Mayer M, Bukau B. Hsp70 chaperones: cellular functions and molecular mechanism. Cell Mol Life Sci. 2005;62:670.
- Goloudina AR, Demidov ON, Garrido C. Inhibition of hsp70: a challenging anti-cancer strategy. Cancer Lett. 2012;325:117–124.
- Chatterjee S, Burns T. Targeting heat shock proteins in cancer: a promising therapeutic approach. Int J Mol Sci. 2017;18:1978.
- Powers MV, Workman P. Inhibitors of the heat shock response: biology and pharmacology. FEBS Lett. 2007;581:3758–3769.
- Leu JJ, Pimkina J, Pandey P, et al. Hsp70 inhibition by the small-molecule 2-phenylethynesulfonamide impairs protein clearance pathways in tumor cells. Mol Cancer Res. 2011;9:936–947.
- Balaburski GM, Julia I, Leu J, et al. A modified hsp70 inhibitor shows broad activity as an anticancer agent. Mol Cancer Res. 2013;11:219–229.
- Miyagawa T, Saito H, Minamiya Y, et al. Inhibition of hsp90 and 70 sensitizes melanoma cells to hyperthermia using ferromagnetic particles with a low curie temperature. Int J Clin Oncol. 2014;19:722–730.
- Herman TS, Gerner EW, Magun BE, et al. Rate of heating as a determinant of hyperthermic cytotoxicity. Cancer Res. 1981;41:3519–3523.
- Dewhirst MW, Viglianti B, Lora-Michiels M, et al. Basic principles of thermal dosimetry and thermal thresholds for tissue damage from hyperthermia. Int J Hyperther. 2003;19:267–294.
- Dewhirst M, Viglianti BL, Lora-Michiels M, et al. Thermal dose requirement for tissue effect: experimental and clinical findings. In: thermal treatment of tissue: energy delivery and assessment II. Int Soc Optics Photonics. 2003;4954:37–58.
- Dewhirst M. Thermal dosimetry. In: Seegenschmiedt MH, Fessenden P, Vernon CC, editors. Thermoradiotherapy and thermochemotherapy. Philadelphia/Hamburg: Springer; 1995. p. 123–136.
- Lindegaard JC, Overgaard J. Factors of importance for the development of the step-down heating effect in a c3h mammary carcinoma in vivo. Int J Hyperther. 1987;3:79–91.
- Spiro IJ, Sapareto SA, Raaphorst GP, et al. The effect of chronic and acute heat conditioning on the development of thermal tolerance. Int J Radiat Oncol Biol Phys. 1982;8:53–58.
- Henle KJ. Sensitization to hyperthermia below 43 c induced in chinese hamster ovary cells by step-down heating. J Natl Cancer Inst. 1980;64:1479–1483.
- Van Rhoon GC, Samaras T, Yarmolenko PS, et al. Cem43 c thermal dose thresholds: a potential guide for magnetic resonance radiofrequency exposure levels? Eur Radiol. 2013;23:2215–2227.
- Bhuyan BK. Kinetics of cell kill by hyperthermia. Cancer Res. 1979;39:2277–2284. Part