?Mathematical formulae have been encoded as MathML and are displayed in this HTML version using MathJax in order to improve their display. Uncheck the box to turn MathJax off. This feature requires Javascript. Click on a formula to zoom.
Abstract
Purpose: To investigate the effect of patient specific vessel cooling on head and neck hyperthermia treatment planning (HTP).
Methods and materials: Twelve patients undergoing radiotherapy were scanned using computed tomography (CT), magnetic resonance imaging (MRI) and contrast enhanced MR angiography (CEMRA). 3D patient models were constructed using the CT and MRI data. The arterial vessel tree was constructed from the MRA images using the ‘graph-cut’ method, combining information from Frangi vesselness filtering and region growing, and the results were validated against manually placed markers in/outside the vessels. Patient specific HTP was performed and the change in thermal distribution prediction caused by arterial cooling was evaluated by adding discrete vasculature (DIVA) modeling to the Pennes bioheat equation (PBHE).
Results: Inclusion of arterial cooling showed a relevant impact, i.e., DIVA modeling predicts a decreased treatment quality by on average 0.19 °C (T90), 0.32 °C (T50) and 0.35 °C (T20) that is robust against variations in the inflow blood rate (|ΔT| < 0.01 °C). In three cases, where the major vessels transverse target volume, notable drops (|ΔT| > 0.5 °C) were observed.
Conclusion: Addition of patient-specific DIVA into the thermal modeling can significantly change predicted treatment quality. In cases where clinically detectable vessels pass the heated region, we advise to perform DIVA modeling.
Introduction
During hyperthermia cancer treatments, the temperature in the target region is increased to therapeutic levels of 40–44 °C to sensitize tumors cells for the effects of radiotherapy and/or chemotherapy treatments [Citation1]. For head and neck (H&N) cancers, the effectiveness of hyperthermia has been shown in phase III clinical trials [Citation2–5].
Hyperthermia dose–effect relationships show that an increase of temperature will further improve treatment outcome [Citation6–8]. Our H&N hyperthermia applicator (HYPERcollar3D [Citation9]) allows conformal focused microwave heating of tumors located deeply in the entire H&N region. Mandatory in our treatment strategy is patient-specific hyperthermia treatment planning (HTP) to maximize the microwave power absorption inside the target region while minimizing exposure of sensitive healthy tissues. To improve this procedure, we are investigating replacing the power absorption-based optimization by optimization using patient-specific thermal simulations. In this work, we studied if incorporation of vasculature segmentation and discrete vasculature (DIVA) modeling in routine planning would be feasible and if this would result in a relevant change in temperature prediction.
Accurate HTP requires patient specific information: positioning of the patient in the applicator, delineation of the target volume (CTV: clinical target volume as used in radiotherapy planning), tissue segmentation and electrical and thermal properties of the tissues [Citation10,Citation11]. For the H&N region, we have developed an auto segmentation routine [Citation12,Citation13] and showed that it performs within intra-observer variations [Citation14]. Based on this method, we showed that patient specific thermal properties, i.e., blood perfusion and thermal conductivity, can strongly improve 3D temperature simulation accuracy [Citation15]. That study showed the crucial importance of taking patient specific cooling due to perfusion into consideration. Still, the impact of cooling by the large vessels on top of this microvasculature cooling is unknown.
Cooling in tissues is generally modeled using the bioheat equation described by Pennes [Citation16]. Pennes modeled the heat removal by blood using a homogeneous heat sink term, which scales proportional to the tissue temperature increase above the blood temperature. Although the Pennes model (PBHE) takes the cooling by capillaries adequately into account, the effect of DIVA is ignored which may lead to inaccurate temperature predictions [Citation17,Citation18]. Several thermal models to describe the heat exchange between vessels and tissue have been proposed [Citation19–23], but the DIVA implementation described by Kotte et al. [Citation24,Citation25] and validated by Van Leeuwen et al. [Citation26,Citation27] is the only one that connects vessel tree and 3D FDTD thermal modeling.
An integral part of DIVA is an accurate segmentation of the vessels. Recent developments in angiography made clinical imaging of vessels as small as 0.5 mm possible using computed tomography (CT) or magnetic resonance (MR) scanners [Citation28,Citation29]. For routine HTP, contrast enhanced MR angiography (CEMRA) has advantages over CT angiography since it is non-ionizing, i.e., repeatable, and more sensitive.
In this study, we investigated the impact of arteries on the prediction of the temperature distribution using DIVA modeling added to the classical PBHE thermal model. Twelve representative patients underwent CT and MR imaging of the anatomy, as well as CEMRA. The ‘graph-cut’ method, combining information from Frangi vesselness filtering and region growing, was implemented and validated against manual markers (1) to study the feasibility of auto-segmentation as required in routine HTP and (2) to obtain a detailed vessel model. Next, specific 3D anatomy and vessel tree models of 12 patients were constructed. HTP was performed for each patient and the results of PBHE and combined PBHE + DIVA modeling were compared using predicted hyperthermia treatment quality parameters.
Methods
Patient data and scan protocols
Institutional review board approval was obtained and 12 patients eligible for radiotherapy treatment in the H&N region were randomly selected and asked to participate in this study. CT and magnetic resonance imaging (MRI) scan parameters to create the 3D patient models were previously described [Citation30]. For vasculature tree generation, both blanco (pre contrast injection) and arterial sequences were used: TE/TR: 1.93/5.71 ms, FOV 260 mm, slice thickness 0.7 mm, acquisition matrix: 384 × 256, number of slices: 128, flip angle: 25°, contrast injection: 6.5 mL gadolinium contrast agent at 2.5 mL/s, followed by 15 mL saline solution at 2.5 mL/s.
Arterial vessel tree segmentation
Pre-processing of the image data
The images were processed for noise correction using HDCS [Citation31] and bias field correction using the N3 method [Citation32]. To normalize the image intensities, all image histograms were matched to a reference image [Citation33] in the dataset. The default parameters were used for HDCS as available in its ITK implementation (http://www.insight-journal.org/browse/publication/748), and the N3 method parameters were chosen as previously optimized for anatomical sequences of the H&N [Citation34]. For histogram matching, we used 16 landmarks using histograms built with 256 bins.
Graph-cut vessel segmentation
The segmentation method was derived from our previous work [Citation35]. Atlas-based segmentation was combined with intensity modeling using a Graph-cut optimization algorithm for minimization and regularization. Following the terminology of [Citation35], the spatial prior model was based on Frangi vesselness filtering [Citation36] and the intensity model was estimated over the target image using Frangi vesselness combined with region growing based segmentation.
The intensity model was built in three steps:
Local maxima were found in the Frangi response and used as seed for region growing.
Region growing segmentation was run using the arterial image as input, and seed points from step 1; the lower intensity was determined by getting the 5% level of the intensity histogram of the arterial image in the region of high vessel-probability (defined as having a Frangi response image value higher than 0.05).
Using this lower intensity threshold, the region growing algorithm was run using a 26-voxels 3D neighborhood model. The foreground and background intensity models were built by sampling all voxels, within <3 mm from foreground, in or outside the region growing segmentation of the vessels, respectively. The models were constructed using Parzen window estimation with a Gaussian kernel of 50 (intensity value unit).
For the graph-cut optimization, we set the association potential weight λ1 to 1 and the spatial prior weight λ2 to 0.5 based on visual inspection.
Vessel centerline and radius reconstruction
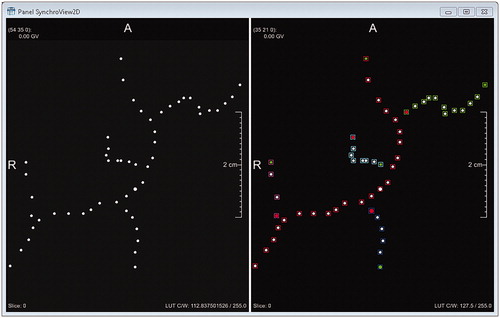
The MeVisLab skeletonization algorithm [Citation37] was applied using the binary segmentation of the vessels as input. Vessel centerline points and vessel radii per point were obtained and, using a distance based sorting, we determined the vessels' points connectivity, i.e., which points are starting points, end points, bifurcation and normal vessel points. In , we show an example of the skeletonization algorithm (for each point, the vessel radius is available) and the same points with connectivity information. Each vessel tract was defined as the sequence of points from a starting/bifurcation point to an end point/bifurcation point as shown in . For each tract, we estimated the radius as the average radius of all vessels centerline point in the tract and we use this information to build the vasculature model for thermal simulation.
Figure 1. Left: vessels skeleton and right: skeleton and connectivity. In this example, green points are starting points, red points are end points and purple points are bifurcations. The color of the squares around the points indicates that the point belongs to a separate tract of the vasculature.
Electromagnetic modeling and optimization
Patient models were generated from automatic segmentation of CT and MR scans [Citation12,Citation13] and positioning inside the HYPERcollar3D was done by an experienced technician. Electromagnetic distributions were computed using Sim4Life (v.4.0.0.2832, Zurich MedTech, Zurich, Switzerland). The resulting 3D electric field distributions were imported into the treatment planning and guidance software VEDO [Citation38] and amplitude and phase settings per antenna were optimized to maximize the target-to-hotspot energy deposition quotient [Citation38]. EM tissue parameters at 434 MHz are given in and are from [Citation39].
Table 1. EM and thermal simulation properties of tissues.
Thermal modeling
Transient 3D temperature distributions were calculated using the PBHE and the combined PBHE + DIVA solvers in Sim4Life. Verification of the Sim4Life DIVA Solver is provided in the Appendix. A 1 mm uniform grid was used in all simulations.
Models were simulated for 900 s to ensure that steady state is reached. The tissue thermal parameters given in were used for both models. The listed thermal properties were taken from [Citation40], except for tumor perfusion and thermal conductivity in muscle, fat and tumor, which were taken from [Citation15]. The effect of thermoregulation was not modeled and values for constant perfusion were used. The SAR level, i.e., total input power, was increased until the maximum temperature in the healthy tissue reached 44 °C in the PBHE model. For the first analysis, an identical power level was used in the combined PBHE + DIVA modeling to compare the maximum predicted temperature in healthy tissue. Subsequently, the total input power of the PBHE + DIVA simulation was increased to reach a maximum healthy temperature of 44 °C. The patient initial temperature was set to 37 °C and mixed boundary conditions were applied using the following values for the heat transfer coefficients (h) and outside temperature (T): tissue – background (h = 8 (Wm–2 °C–1), T = 20 °C, [Citation41]), tissue – internal air/lungs/(dental) metal implants (h = 50 (Wm–2 °C–1), T = 37 °C [Citation41]), tissue – water bolus (h = 292 (Wm–2 °C–1), T = 30 °C; derived from in house measurement involving the device’s water bolus).
For DIVA simulations, the inflow temperature of the blood was set to 37 °C. For every vessel, the following settings were used: bucket density = 1000 m–1, Nusselt number = 3.66, blood initial temperature = 37 °C, blood thermal conductivity = 0.52 Wm–1 °C–1, blood heat capacity = 4.05 × 10⁶ Jm–3 °C–1. The inflow rate values for the arterial tree were fixed as in [Citation42], i.e., 275 mL min–1 for the two internal carotid arteries (ICAs) and 90 mL min–1 for the two vertebral arteries (VAs). To assess the robustness against inflow rate variations, they were modified to represent high (ICA 325 mL min–1, VA 108 mL min–1) and low (ICA 225 mL min–1, VA 72 mL min–1) flow rates. At bifurcations, the flow rates were distributed over ‘child’ vessels proportional to the cubic ratio of their diameters according to Murray’s law [Citation43].
Each DIVA simulation required 30MCells and took on average 4 h at a standard desktop computer with i5-3550 processor.
Evaluation parameters
The results of the graph-cut vessels segmentation method were benchmarked against manual annotations regarding sensitivity, specificity, accuracy and precision:
As ground truth, vessel and background (no vessel) landmarks points were manually placed in pairs by a medical student. In total, 1760 vessel and 5585 background points were placed axially distributed over all patients and over 10 slices per patient. Every vessel landmark is matched with a background landmark near the vessel surface to be sensitive to mis-segmentation.
The impact of the extension of PBHE modeling with DIVA on the temperature simulation was analyzed using the hyperthermia quality parameters T90, T50 and T20, i.e., the iso-temperature levels encompassing 90%, 50% and 20% of the CTV, respectively. A two sample t-test was used to test for statistical significance.
Results
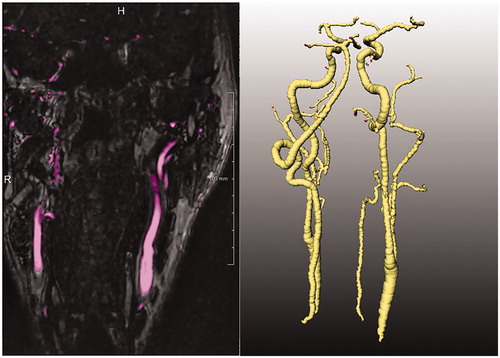
In , a visual example of vessel segmentation by the graph-cut method is shown. On the left, the detected voxels (highlighted in purple) are shown overlaid on coronal MRA image. On the right, the resulting full arterial tree ready to be inserted in the thermal simulation, is visualized.
Figure 2. An example result of the graph-cut vessel segmentation algorithm. Pre-processed coronal slice of the MRA image of a patient with vessels segmentation color overlay in purple (left), and the skeletonization of the arterial vessel tree (right).
The sensitivity of the graph-cut segmentation method was 0.85, and specificity was 0.97. These high sensitivity and specificity values are desired to correctly identify the vessel locations. The method also provided high accuracy (0.94) and precision (0.9), which is very desirable since the thermal modeling is severely affected by false positives and false negatives. Hence, the good all-round performance of the method and visual inspection suggest that it is sufficient for thermal modeling.
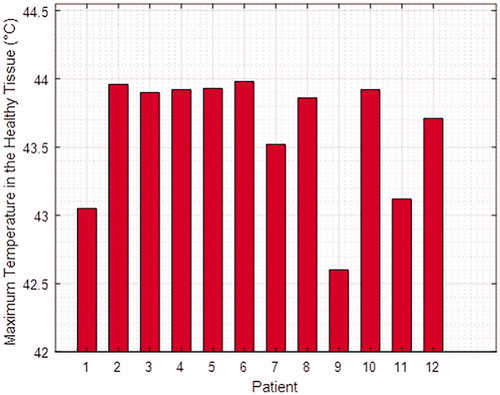
shows the maximum temperature reached in the healthy tissue with the DIVA model when the same power as in the PBHE is used in the PBHE + DIVA model. In DIVA + PBHE models for five patients (patients 1, 7, 9, 11 and 12), the achieved maximum temperatures in the healthy tissue (using the same power levels as in the corresponding PBHE models) decreased by more than 0.2 °C. The maximum change in the peak temperature was observed in patient 9, where the maximum temperature was 1.4 °C lower than in the PBHE model.
Figure 3. Maximum temperatures in the healthy tissue reached in PBHE + DIVA models with the same input powers as in PBHE models. The maximum temperature in the healthy tissue was 44 °C in the PBHE model.
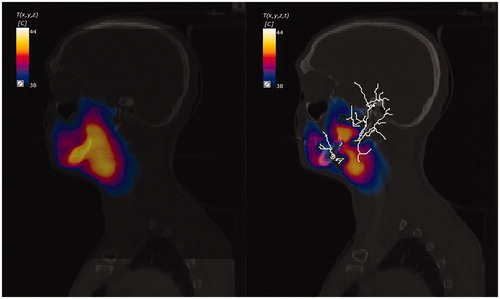
shows the difference in achieved HTP quality parameters in the CTV. T50 of 5/12 patients decreased notably (|ΔT50| ≥ 0.20 °C) in the presence of arterial cooling. The T50 values in the DIVA simulations were on average 0.30 °C lower, but 1/12 patient showed an insignificant increase in T50 (ΔT50 = 0.05 °C). In two cases, where the heating target-volume was in the vicinity of a blood vessel, cooling was increased by up to 1 °C. There was no clinically relevant difference in the lowest target temperature indicator, i.e., average ΔT90 = −0.16 °C. The maximum temperature surrogate T20 showed the biggest change between the models (average ΔT20 = −0.33 °C). The maximum drop in predicted T50 was 1.00 °C, where the temperature distributions for both models are illustrated in . The vessels pass through the target area and create cold tracks in their paths. Still, our statistical analysis did not show a significant reduction in HTP quality parameters (T90: p = .64, T50: p = .45, T20: p = .38) for the total of the 12 patients. The robustness study regarding variations in the flow rates produced changes below 0.01 °C in all cases.
Figure 4. Differences in HTP quality parameters in the CTV (a) ΔT90 (|ΔT90avg| = 0.16 °C), (b) ΔT50 (|ΔT50avg| = 0.30 °C) and (c) ΔT20 (|ΔT20avg| = 0.33 °C). ‘*’ next to the patient number denotes a target volume that includes a part of the vessel tree.
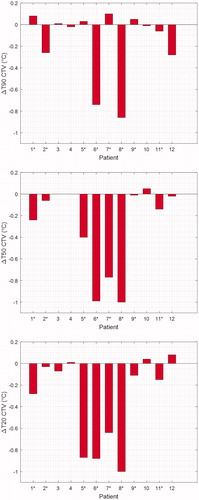
Figure 5. Example temperature distribution maps overlaid on CT images for PBHE (left), and DIVA (right).
Discussion
In this paper, we report our analysis on the effect of DIVA in the H&N region. We found a notable drop in treatment quality parameters with the arterial DIVA model compared to the PBHE model. Although the differences in the values are moderate on average (0.30 °C), for three patients (patients 6, 7 and 8), a large drop in the achieved temperature metrics was observed (average drop 0.92 °C), presumably because the target volumes in these patients are significantly exposed to traversing parts of the arterial trees. Exclusion of these three patients brings the average difference in HTP quality parameters to 0.09 °C. This fact highlights the importance of DIVA modeling in specific cases when the target volume is in the vicinity of the vessel tree.
To our knowledge, these are the first reported results on the use of a clinical workflow to implement patient specific thermal modeling of DIVA in HTP including acquisition of vasculature data. Other authors did study the impact of DIVA modeling for other scenarios or using a non-patient specific vessel network. van Lier et al. [Citation44] evaluated and compared PBHE and PBHE + DIVA models regarding the maximum temperature increase in the head after exposure to a 300 MHz radiofrequency field induced by MRI coils. They reported 0.5 °C difference in the maximum temperature increase predictions. Our approach of focusing on target volume prevents a comparison with their results, which were obtained using a more homogenous B1 field that is desirable in MRI. Our findings confirm that PBHE only predictions can overestimate the temperature increase. For exposure by a mobile phone, Flyckt et al. [Citation45] also reported lower maximum temperature rise with a DIVA model of the eye. Using data from a healthy volunteer, supplemented by a vessel network from a previous study [Citation18], Kok et al. [Citation46] studied the differences in HTP quality parameters in the pelvis region when using DIVA modeling. They saw 0.2 °C, 0.4 °C and 0.6 °C decrease in T90, T50 and T10. The higher difference they found can be explained by the fact that their maximum allowed temperature in the healthy tissue was 45 °C, which is higher than in our clinical protocol.
The graph-cut segmentation is a tradeoff between region growing and Frangi vesselness based segmentation. Frangi has a low sensitivity because the vessel boundaries are not accurately segmented due to the effect of the Gaussian smoothing. Conversely, region growing segmentation tends to 'leak' including high intensity background region as foreground. Graph-cut segmentation provides better boundaries without including spurious high intensity regions in the vessel segmentation.
There are some limitations regarding the accuracy of thermal modeling in this study. Arteries with diameters larger than 0.5 mm were captured in the MRA images. Arteries with diameters in the range of 0.1–0.5 mm may affect the accuracy of PBHE + DIVA models [Citation47]. This resolution is not achievable with current clinically available imaging technologies. Furthermore, the arteries reconstructed in this study (diameter >0.5 mm), nearly always are accompanied by a counter-current vein [Citation48]. When this venous flow originates from a heated volume, counter-current heat exchange will increase the temperature of arterial flow (venous rewarming). A correction coefficient has been suggested to account for this effect [Citation22]. If the venous flow originates from a cold volume; there will be no venous rewarming. As the target volume in the H&N hyperthermia is only about 250 mL, i.e., much smaller than in pelvic hyperthermia, counter-current venous rewarming is not expected. Since venous flow is much slower than arterial flow, very little independent cooling by the veins is expected [Citation47]. Thus, we regard the effect of arteries reported in this study a good estimate of the minimum difference that can be expected in the clinic.
In vivo validation of the vasculature effect on H&N hyperthermia treatment quality has some challenges. The concept of DIVA thermal modeling was validated ex vivo by Raaymakers et al. [Citation49] using a perfused bovine tongue. A specific validation for the H&N region would require in vivo temperature measurements near vessels. During H&N hyperthermia, placement of invasive temperature probes is challenging and risky and therefore often not feasible [Citation50]. In addition, the thermo-sensors are positioned at a safe distance from the vessels to avoid complications like artery puncturing [Citation51]. Hence, noninvasive measurements like magnetic resonance temperature imaging (MRTI) hold the greatest promise for validation of the DIVA modeling. However, the accuracy of MRTI strongly varies depending on the distance to distortions and confounders. Hence, a validation study requires the most advanced MRTI techniques, dedicated MR-hyperthermia equipment and careful planning.
Although the HTP quality parameters are commonly used as surrogates and have been shown to correlate with the treatment outcome [Citation6,Citation52], they are not sensitive to minimum temperatures. Hence, local vessel cooling may create small under-dosed areas where hyperthermia is less effective potentially leading to tumor recurrences. We hypothesize that the correlation between macroscopic quality parameters and treatment outcome is an indicator that ionizing radiation alone is sufficiently effective in those regions, which are highly oxygenized regions. An analysis on the thermal enhancement ratio [Citation53] in these regions might provide different results. However, more research on the biology of hyperthermia on a local scale is needed for definite answers.
Inclusion of DIVA into the HTP scheme is necessary for correct thermal dose estimation. Additionally, to reach maximum allowed temperature limits in the healthy tissue, we showed that power on average needs to be increased by more than 6% when considering DIVA. Failing to deliver the correct power levels can result in a decrease in T50 by on average 0.45 °C. However, the benefits of patient specific vasculature information come with additional burden to the patient. Patients have to stay in the scanner for another 10 minutes. In addition, although fast DIVA simulation tools have been developed [Citation46], these are not commercially available and only predict temperatures in steady state. Transient implementations of the DIVA model involve long simulation times, which makes the integration of DIVA into complaint adaptive online HTP unrealistic [Citation38].
Conclusion
Our analysis, based on 12 patient models, showed no significant decrease of the target temperature isopercentiles when including the effect of patient specific vasculature information into the PBHE model. Nevertheless, in specific cases, where major vasculature traverses the strongly heated target volume, a clinically relevant difference was observed. Based on these findings about the impact of the vasculature above 0.5mm in diameter, we advise to consider DIVA modeling if such vessels are passing through the heated region. For the vessel tree segmentation and extraction from CEMRA, the graph-cut method has good automation potential: it performs well in terms of accuracy, precision and specificity without losing on sensitivity.
Disclosure statement
No potential conflict of interest was reported by the authors.
Additional information
Funding
References
- Cihoric N, Tsikkinis A, van Rhoon G, et al. Hyperthermia-related clinical trials on cancer treatment within the ClinicalTrials.gov registry. Int J Hyperthermia. 2015;31:609–614.
- Amichetti M, Romano M, Busana L, et al. Hyperfractionated radiation in combination with local hyperthermia in the treatment of advanced squamous cell carcinoma of the head and neck: a phase I–II study. Radiother Oncol. 1997;45:155–158.
- Valdagni R, Amichetti M. Report of long-term follow-up in a randomized trial comparing radiation therapy and radiation therapy plus hyperthermia to metastatic lymphnodes in stage IV head and neck patients. Int J Radiat Oncol Biol Phys. 1994;28:163–169.
- Huilgol NG, Gupta S, Dixit R. Chemoradiation with hyperthermia in the treatment of head and neck cancer. Int J Hyperthermia. 2010;26:21–25.
- Hua Y, Ma S, Fu Z, et al. Intracavity hyperthermia in nasopharyngeal cancer: a phase III clinical study. Int J Hyperthermia. 2011;27:180–186.
- Franckena M, Fatehi D, de Bruijne M, et al. Hyperthermia dose–effect relationship in 420 patients with cervical cancer treated with combined radiotherapy and hyperthermia. Eur J Cancer. 2009;45:1969–1978.
- Jones EL, Oleson JR, Prosnitz LR, et al. Randomized trial of hyperthermia and radiation for superficial tumors. J Clin Oncol. 2005;23:3079–3085.
- Thrall DE, Page RL, Dewhirst MW, et al. Temperature measurements in normal and tumor tissue of dogs undergoing whole body hyperthermia. Cancer Res. 1986;46:6229–6235.
- Paulides MM, Bakker JF, Neufeld E, et al. The HYPERcollar: a novel applicator for hyperthermia in the head and neck. Int J Hyperthermia. 2007;23:567–576.
- Paulides MM, Stauffer PR, Neufeld E, et al. Simulation techniques in hyperthermia treatment planning. Int J Hyperthermia. 2013;29:346–357.
- Kok HP, Kotte A, Crezee J. Planning, optimisation and evaluation of hyperthermia treatments. Int J Hyperthermia. 2017;33:593–607.
- Fortunati V, Verhaart RF, van der Lijn F, et al. Tissue segmentation of head and neck CT images for treatment planning: a multiatlas approach combined with intensity modeling. Med Phys. 2013;40:071905.
- Fortunati V, Verhaart RF, Niessen WJ, et al. Automatic tissue segmentation of head and neck MR images for hyperthermia treatment planning. Phys Med Biol. 2015;60:6547–6562.
- Verhaart RF, Fortunati V, Verduijn GM, et al. CT-based patient modeling for head and neck hyperthermia treatment planning: manual versus automatic normal-tissue-segmentation. Radiother Oncol. 2014;111:158–163.
- Verhaart RF, Verduijn GM, Fortunati V, et al. Accurate 3D temperature dosimetry during hyperthermia therapy by combining invasive measurements and patient-specific simulations. Int J Hyperthermia. 2015;31:686–692.
- Pennes HH. Analysis of tissue and arterial blood temperatures in the resting human forearm. J Appl Physiol. 1948;1:93–122.
- Crezee J, Lagendijk J. Temperature uniformity during hyperthermia: the impact of large vessels. Phys Med Biol. 1992;37:1321–1337.
- Van den Berg CAT, Van de Kamer JB, De Leeuw AAC, et al. Towards patient specific thermal modelling of the prostate. Phys Med Biol. 2006;51:809–825.
- Mitchell JW, Myers GE. An analytical model of the counter-current heat exchange phenomena. Biophys J. 1968;8:897–911.
- Lagendijk J. The influence of bloodflow in large vessels on the temperature distribution in hyperthermia. Phys Med Biol. 1982;27:17–23.
- Kolios MC, Sherar MD, Hunt JW. Large blood vessel cooling in heated tissues: a numerical study. Phys Med Biol. 1995;40:477–494.
- Zhu L, Xu LX, He Q, et al. A new fundamental bioheat equation for muscle tissue-part II: temperature of SAV vessels. J Biomech Eng. 2002;124:121–132.
- Kok HP, Gellermann J, van den Berg CAT, et al. Thermal modelling using discrete vasculature for thermal therapy: a review. Int J Hyperthermia. 2013;29:336–345.
- Kotte A, van Leeuwen G, de Bree J, et al. A description of discrete vessel segments in thermal modelling of tissues. Phys Med Biol. 1996;41:865–884.
- Kotte A, Van Leeuwen GMJ, Lagendijk J. Modelling the thermal impact of a discrete vessel tree. Phys Med Biol. 1999;44:57–74.
- Van Leeuwen GMJ, Kotte A, De Bree J, et al. Accuracy of geometrical modelling of heat transfer from tissue to blood vessels. Phys Med Biol. 1997;42:1451–1460.
- Van Leeuwen GMJ, Kotte A, Crezee J, et al. Tests of the geometrical description of blood vessels in a thermal model using counter-current geometries. Phys Med Biol. 1997;42:1515–1532.
- Wardlaw JM, Chappell FM, Best JJK, et al. Non-invasive imaging compared with intra-arterial angiography in the diagnosis of symptomatic carotid stenosis: a meta-analysis. Lancet. 2006;367:1503–1512.
- Kumamaru KK, Hoppel BE, Mather RT, et al. CT angiography: current technology and clinical use. Radiol Clin North Am. 2010;48:213–235.
- Verhaart RF, Fortunati V, Verduijn GM, et al. The relevance of MRI for patient modeling in head and neck hyperthermia treatment planning: a comparison of CT and CT-MRI based tissue segmentation on simulated temperature . Med Phys. 2014;41:123302–11.
- Mendrik AM, Vonken E-J, Rutten A, et al. Noise reduction in computed tomography scans using 3-D anisotropic hybrid diffusion with continuous switch. IEEE Trans Med Imaging. 2009;28:1585–1594.
- Larsen CT, Iglesias JE, Van Leemput K. N3 bias field correction explained as a Bayesian modeling method. Bayesian and graphical models for biomedical imaging. Springer; 2014. p. 1–12.
- Nyúl LG, Udupa JK, editors. New variants of a method of MRI scale normalization. Biennial International Conference on Information Processing in Medical Imaging. Visegrád: Springer; 1999.
- Fortunati V, Verhaart RF, Angeloni F, et al. Feasibility of multimodal deformable registration for head and neck tumor treatment planning. Int J Radiat Oncol Biol Phys. 2014;90:85–93.
- Fortunati V, Verhaart RF, van der Lijn F, et al. editors. Hyperthermia critical tissues automatic segmentation of head and neck CT images using atlas registration and graph cuts. 2012 9th IEEE International Symposium on Biomedical Imaging (ISBI). Barcelona: IEEE; 2012.
- Frangi AF, Niessen WJ, Vincken KL, et al., editors. Multiscale vessel enhancement filtering. International Conference on Medical Image Computing and Computer-Assisted Intervention; 1998. Cambridge (MA): Springer.
- Selle D, Preim B, Schenk A, et al. Analysis of vasculature for liver surgical planning. IEEE Trans Med Imaging. 2002;21:1344–1357.
- Rijnen Z, Bakker JF, Canters RAM, et al. Clinical integration of software tool VEDO for adaptive and quantitative application of phased array hyperthermia in the head and neck. Int J Hyperthermia. 2013;29:181–193.
- Gabriel C, Gabriel S, Corthout YE. The dielectric properties of biological tissues: I. Literature survey. Phys Med Biol. 1996;41:2231–2249.
- Hasgall PA, Di Gennaro F, Baumgartner C, et al. IT’IS database for thermal and electromagnetic parameters of biological tissues. Version 4.0; 2018. [cited 2018 May 15] Available from: www.itis.ethz.ch/database/
- Bakker JF, Paulides MM, Neufeld E, et al. Children and adults exposed to low-frequency magnetic fields at the ICNIRP reference levels: theoretical assessment of the induced electric fields. Phys Med Biol. 2012;57:1815–1829.
- Ford MD, Alperin N, Lee SH, et al. Characterization of volumetric flow rate waveforms in the normal internal carotid and vertebral arteries. Physiol Meas. 2005;26:477–488.
- Murray CD. The physiological principle of minimum work: I. The vascular system and the cost of blood volume. Proc Natl Acad Sci. 1926;12:207–214.
- van Lier AL, Kotte A, Raaymakers BW, et al. Radiofrequency heating induced by 7T head MRI: thermal assessment using discrete vasculature or Pennes' bioheat equation. J Magn Reson Imaging. 2012;35:795–803.
- Flyckt VMM, Raaymakers BW, Lagendijk J. Modelling the impact of blood flow on the temperature distribution in the human eye and the orbit: fixed heat transfer coefficients versus the Pennes bioheat model versus discrete blood vessels. Phys Med Biol. 2006;51:5007–5021.
- Kok HP, Van den Berg CAT, Bel A, et al. Fast thermal simulations and temperature optimization for hyperthermia treatment planning, including realistic 3D vessel networks. Med Phys. 2013;40:103303.
- Van Leeuwen GMJ, Kotte A, Raaymakers BW, et al. Temperature simulations in tissue with a realistic computer generated vessel network. Phys Med Biol. 2000;45:1035–1049.
- Lemons DE, Chien S, Crawshaw LI, et al. Significance of vessel size and type in vascular heat transfer. Am J Physiol-Regul Integr Comp Physiol. 1987;253:R128–R135.
- Raaymakers BW, Crezee J, Lagendijk J. Modelling individual temperature profiles from an isolated perfused bovine tongue. Phys Med Biol. 2000;45:765–780.
- Verduijn GM, de Wee EM, Rijnen Z, et al. Deep hyperthermia with the HYPERcollar system combined with irradiation for advanced head and neck carcinoma – a feasibility study. Int J Hyperthermia. 2018;34:994–1001.
- van der Zee J, Peer-Valstar JN, Rietveld PJM, et al. Practical limitations of interstitial thermometry during deep hyperthermia. Int J Radiat Oncol Biol Phys. 1998;40:1205–1212.
- Kroesen M, Mulder HT, van Holthe N, et al. The effect of the time interval between radiation and hyperthermia on clinical outcome in 400 locally advanced cervical carcinoma patients. Front Oncol. 2019;9:134.
- Crezee J, van Leeuwen CM, Oei AL, et al. Biological modelling of the radiation dose escalation effect of regional hyperthermia in cervical cancer. Radiat Oncol. 2016;11:14.
Appendix. Verification of Sim4Life DIVA solver
The Sim4Life (and SEMCAD X) DIVA solver is a reimplementation of the approach presented by Kotte et al. [Citation24,Citation25]. The original terminology introduced by Kotte is used throughout this Appendix. 1D vascular network simulations of blood-flow heat transport are coupled with spatio-temporal 4D thermal simulations (based on the Pennes bioheat equation (PBHE) [Citation16]), whereby energy exchange resulting from temperature differences between the vascular blood temperature and its tissue environment is considered. For that purpose, the vascular network is discretized into buckets, while the anatomical domain is voxeled (rectilinear mesh). The heat exchange between the two simulations is realized by combining the temperature in voxels neighboring the vessel bucket with the temperature in the bucket to fit an analytical solution of the radial temperature dependence and to thus derive the energy flux through the bucket surface. The Sim4Life implementation goes beyond the original implementation by allowing for adaptive (inhomogeneous, but still rectilinear) gridding and voxeling. For more information, see the original work of Kotte.
Within this paper, a reduced set of functionalities from the DIVA model is employed: flow rates are defined at in-flows and the division of flow rates at branching points is specified. However, no blood uptake from the tissue along the vasculature is modeled, nor is the blood considered to flow into the tissue at endings of the vascular network, or elsewhere. This simplification is acceptable, as the heating is localized and vessels are starting and ending well outside the volume-of-interest. Therefore, the following aspects need to be verified: transport within the vascular network, energy exchange with the 4D thermal simulation, as well as correct handling of inflow- and branching-points. As the Sim4Life solver is re-implementing the original model from Kotte, the original validation work [Citation17,Citation20,Citation24,Citation25] does not need to be re-performed, provided the verification successfully demonstrates that the implementation was performed correctly. This is the purpose of this Appendix.
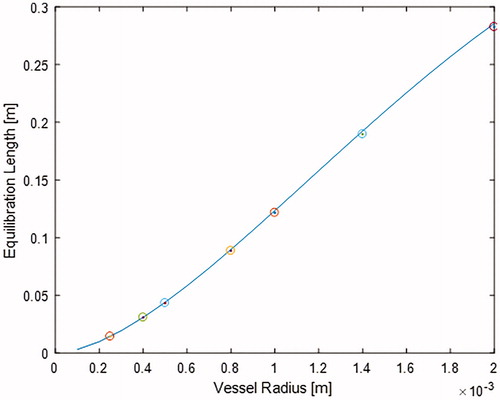
The most important benchmark that will be used, is the case of a straight vessel along the axis of a tissue cylinder (), for which an analytical formula for the thermal equilibrium length (Leq) has been derived in [Citation24]. Unless specified differently, the simulation parameters provided in are used, in line with the original publication.
Figure 6. Principal verification benchmark: a coaxial setup involving a straight vessel inside a tissue cylinder.
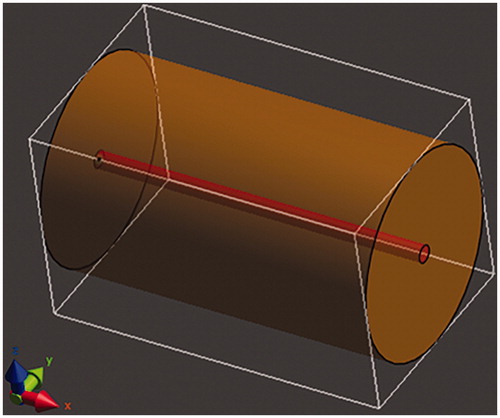
Table 2. Basic model parameters (in accordance with Table 1 in [Citation24]).
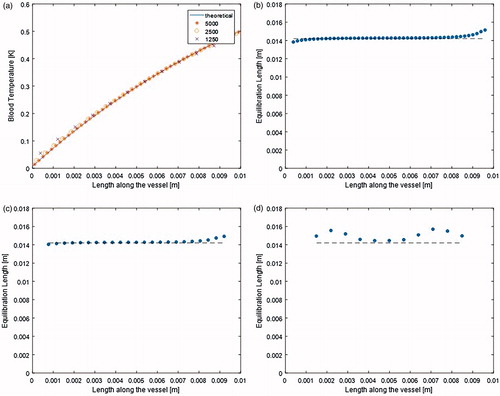
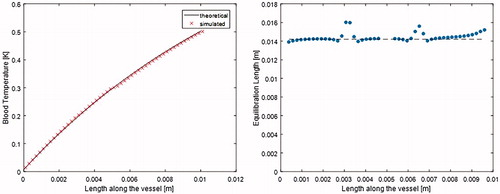
Implementation correctness and convergence with discretization refinement (bucket density): shows the theoretical and simulated temperature along the vessel for different bucket densities, while shows the local equilibration length along the vessel as computed from the simulation results (using Equation (11) from [Citation24]) in comparison to the theoretical equilibration length. In , blood temperature along the vessel for theoretically calculated and simulated results for different bucket densities are reported. The simulated results show agreement with the theoretical results. As expected, the agreement gets better with increasing bucket density. With increasing bucket density, the computed equilibration lengths approach the theoretical value, with the strongest deviations seen at the in- and out-flow (as expected). More importantly, these results are identical to those shown in from [Citation24], demonstrating the correctness (or equivalence) of the Sim4Life implementation of in- flow, energy exchange, convective transport and 4D thermal simulation.
Figure 7. (a) Theoretical and simulated temperature along the vessel for different bucket densities. Theoretical and simulated Leq for a bucket density of (b) 5000, (c) 2500 and (d) 1250.
Vessel radius dependence: The vessel radius dependences of the theoretical and numerically obtained equilibration lengths are shown in , further verifying the solver. Again, these results are in agreement with those shown in from [Citation24].
Figure 8. Leq as a function of the vessel radius.
Connected segments and branching: It remains to be demonstrated that connections between vascular segments, as well as branching points are correctly handled. First, connections have been tested by connecting three similarly sized segments back to back. The computed vascular temperature along the connected branches are shown in along with the theoretical values. Small deviations can be seen at the connection points, which are related to how the exchange and estimation voxels are placed and are more apparent when looking at the derived equilibration lengths (sensitivity of derivative). However, the thermal impact is minor and simulation results are close to the analytical solution.
Figure 9. Temperature profile along three connected vessel segments (computed and theoretical; left) and Leq (right).
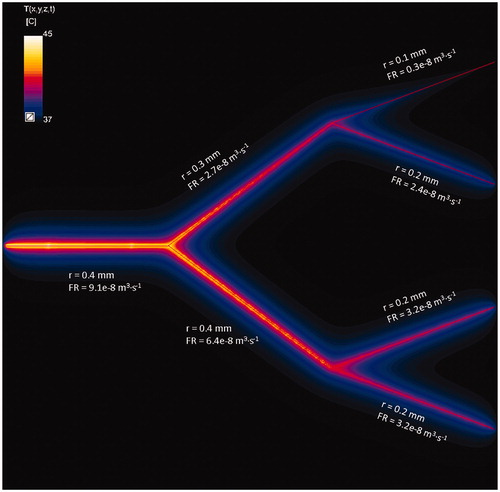
To test the implementation of branching, another benchmark was constructed. This benchmark is qualitative, as no analytical solution is known. A parent vessel goes through two branching levels. Both, symmetric and asymmetric branching (radiuses of child vessels) is modeled. Flow is distributed according to Murray’s law. In , the resulting tissue temperature distribution is shown. To estimate the four expected temperature at the midpoint of 2nd generation child vessels, the analytical solution for the cylindrical case is used in each segment (with the slab thickness as cylinder radius). The computational results agree within 0.4–6% with the estimated values.
Figure 10. DIVA benchmark illustrating branching with symmetric and asymmetric flow-rate division. Red straight lines are indicating the vessel centerlines.