
 ?Mathematical formulae have been encoded as MathML and are displayed in this HTML version using MathJax in order to improve their display. Uncheck the box to turn MathJax off. This feature requires Javascript. Click on a formula to zoom.
Abstract
Purpose
Thermal intervention is a potent sensitizer of cells to chemo- and radiotherapy in cancer treatment. Glioblastoma multiforme (GBM) is a potential clinical target, given the cancer’s aggressive nature and resistance to current treatment options. The annular phased array (APA) technique employing electromagnetic waves in the radiofrequency (RF) range allows for localized temperature increase in deep seated target volumes (TVs). Reports on clinical applications of the APA technique in the brain are still missing. Ultrahigh field magnetic resonance (MR) employs higher frequencies than conventional MR and has potential to provide focal temperature manipulation, high resolution imaging and noninvasive temperature monitoring using an integrated RF applicator (ThermalMR). This work examines the applicability of RF applicator concepts for ThermalMR of brain tumors at 297 MHz (7.0 Tesla).
Methods
Electromagnetic field (EMF) simulations are performed for clinically realistic data based on GBM patients. Two algorithms are used for specific RF energy absorption rate based thermal intervention planning for small and large TVs in the brain, aiming at maximum RF power deposition or RF power uniformity in the TV for 10 RF applicator designs.
Results
For both TVs , the power optimization outperformed the uniformity optimization. The best results for the small TV are obtained for the 16 element interleaved RF applicator using an elliptical antenna arrangement with water bolus. The two row elliptical RF applicator yielded the best result for the large TV.
Discussion
This work investigates the capacity of ThermalMR to achieve targeted thermal interventions in model systems resembling human brain tissue and brain tumors.
Introduction
Glioblastoma multiforme (GBM) is the most frequent and aggressive malignant brain tumor with the least chance of long-term survival, in spite of multimodal therapeutic approaches that include surgery, radiotherapy and chemotherapy [Citation1]. Local thermal therapy is a potent sensitizer of several cancer cell types to chemo- and radiotherapy [Citation2–5] and significantly improves survival [Citation5]. In case of GBM, adding thermal therapy to standard treatment could improve prognosis [Citation1,Citation5]. A randomized trial showed the principal effectiveness of brachytherapy and adjunct interstitial hyperthermia, prolonging median survival [Citation6]. The disproportional effort and burden of this approach has prevented broader clinical application and constitutes the rationale for a noninvasive approach for thermal therapy. GBM treatment could also benefit from manipulation of the blood brain barrier enhancing its permeability and thus targeted drug delivery to the tumor location [Citation7–9].
Limitations of energy delivery restrict the use of conventional thermal therapy approaches in the brain. Capacitive approaches were already clinically applied [Citation10]. Their ability to achieve high SAR in deep tissue and to focus to a well-defined target region is limited [Citation11,Citation12]. MR-guided focused ultrasound (MRgFUS) permits noninvasive thermo-ablation of deep seated brain tumors [Citation13]. This approach provides unmatched focal quality [Citation14], although excessive treatment duration often results in incomplete treatment of the clinical target volumes (TVs) [Citation15].
Radiative annular phased arrays (APAs) of antennae operating in the radiofrequency (RF) range enable localized temperature intervention in deep-seated TVs in the pelvis and abdomen [Citation2], where the commonly applied frequencies of f = 70–130 MHz result in wavelengths λ between 50 and 25 cm and thus the minimum size of the heated volume is as large as about 10 cm (about one-third of the wavelength) [Citation16,Citation17]. Employing a higher frequency of f = 434 MHz affords smaller TVs in the treatment of head and neck cancers [Citation18]. Numerical simulations demonstrated that moving to frequencies of up to 1 GHz and a potential combination thereof enables better control over the distribution of the delivered RF energy to the target [Citation19–22].
A plethora of reports highlights the need and growing clinical interest for RF-based thermal therapy in the brain [Citation19,Citation21–24]. However, reports on clinical applications of the APA technology are still missing due to the lack of a noninvasive method to manipulate brain tissue temperature while concomitantly characterizing its outcome in vivo, which is a pivotal prerequisite when targeting the brain. Temperature probes provide accurate readings but are constrained to point-wise measurements. Their placement is invasive and might not be feasible depending on the size and location of the TV.
Magnetic resonance imaging (MRI) provides anatomic reference, facilitates functional contrast and supports noninvasive temperature mapping and is therefore of great interest but has still limited accessibility for clinical users [Citation12,Citation25]. Current implementations use separate RF antenna systems for RF hyperthermia and MRI [Citation12]. For the latter, the MR scanner’s body RF coil is employed. This approach constrains MR thermometry (MRTh) to a low signal-to-noise ratio, which limits the spatial resolution and accuracy of temperature maps [Citation26,Citation27]. Further constraints apply to the design of the RF heating device: the RF antenna system for hyperthermia must be efficiently decoupled from the MR imaging system to avoid RF induced artifacts in the MRTh data as well as perturbations in the RF transmission during treatment [Citation2,Citation28].
Thermal magnetic resonance (ThermalMR) has the unique potential to circumvent these limitations by providing temperature intervention, proton (1H) MRI for anatomic and functional imaging and temperature mapping (MRTh) in an integrated RF applicator. Ultrahigh field MR (UHF-MR) at B0≥7.0 Tesla (f ≥ 297 MHz) enables high focusing of RF fields, provides thermal dose delivery for hyperthermia in relatively large tumor areas and affords enhanced spatial resolution for MRI and MRTh [Citation20,Citation23,Citation27,Citation29,Citation30]. By enabling treatment and therapy monitoring on the same RF antenna hardware, the risk of interferences between treatment and therapy monitoring is eliminated.
Recognizing the opportunities of adding a thermal intervention dimension to a UHF-MR device, this work examines RF applicator concepts tailored for simultaneous RF heating and UHF-MR to combine diagnostic MRI, RF hyperthermia treatment and real-time therapy control with MRTh. En route to RF-induced hyperthermia treatment of glioblastoma in the human brain, this work focuses on electromagnetic field (EMF) simulations that incorporate models based on clinical data obtained from GBM patients and presents two algorithms for specific RF energy absorption rate (SAR)-based hyperthermia treatment planning (HTP) for small and large TVs in the brain.
Materials and methods
Radiofrequency antenna array concepts
Ten RF arrays comprising 8, 16 or 32 antenna building blocks () were modeled. Each building block consists of a bow tie dipole antenna [Citation23,Citation31] submerged in a high permittivity medium enclosed in a polymethylmethacrylate (PMMA) box (wall thickness = 3 mm).
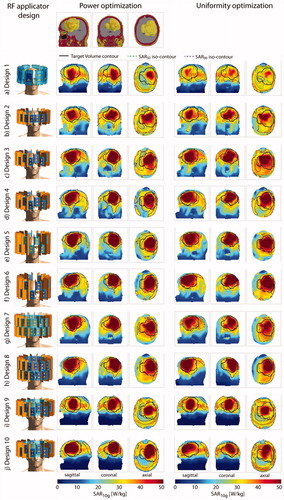
Figure 1. Overview over all 10 RF applicator designs investigated in this work. In the center column, cross-sectional view of the RF arrays depicts the arrangement of the building blocks around the head and details about their position with respect to each other. The rightmost column shows the designs and their positioning for the small tumor model.
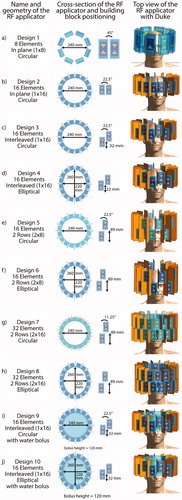
Design 1 () provides a reference [Citation22] and consists of eight building blocks (size: (35 × 70 × 150) mm³) positioned azimuthally (inner diameter = 24 cm) around the human head. D2O (εr ≈ 80) was used as high permittivity medium for antenna size reduction [Citation32].
For Designs 2–6, the number of transmit channels was increased to 16 versus the reference design, which potentially improves in-plane RF steering capabilities and the ratio between deep seated and superficial SAR [Citation20]. In order to allow for the increased number of channels, while keeping the overall dimensions of the applicator comparable, a higher permittivity dielectric (εr ≈ 200) was employed, which reduced the building block size to (40 × 40 × 80) mm³.
Design 2 () comprises 16 resonators arranged in a circular array in plane.
Starting with Design 3 (), an interleaved arrangement of building blocks along the head-feet-direction (z-direction) was introduced in order to sharpen and move the focus along the third dimension. Designs 3 and 4 use an offset of 32 mm between adjacent building blocks, which represents half the length of the dipole.
Design 4 () is an elliptical variant of Design 3 to reduce the proximity of the elements to the front and the back of the head and to mitigate formation of local SAR maxima. The eccentricity of the ellipse (a1=220 mm, a2=260 mm) was chosen to reproduce the circumference of the circular arrays.
To enhance brain coverage, the offset of the building blocks in head-feet-direction was set to the length of the building block (89 mm) for Designs 5–8, forming two separate rows.
Design 5 () is a circular two row arrangement with eight elements each.
Design 6 () is an elliptical variant of Design 5 with improved longitudinal coverage over Design 4.
For Designs 7 and 8, 32 building block elements were used. The circular Design 7 ((g)) consists of two rows, each equipped with 16 elements.
Design 8 () is an elliptical variant of Design 7 with an enhanced conformity to the shape of the head. Note that for Designs 1–8 an air gap is assumed between antennae and head.
Building block arrangements in Designs 9 and 10 () are identical to Designs 3 and 4, with the exception that a cylindrical water bolus (h = 120 mm) was introduced to fill the air gap between the RF arrays and the human head for better coupling of the RF waves to the body [Citation33].
A prerequisite of MRI is the perpendicularity of the magnetic transmission field (B1+) and the static magnetic field of the MR system (B0). Due to the radiation pattern of bow tie dipole antennae, the building blocks need to be arranged with their long axis parallel to the head-feet-direction. For Designs 2–10, copper shields were introduced between the RF building blocks to reduce nearest neighbor coupling. The position of each array was chosen so that the brain is centered within the x–y-plane (left–right, anterior–posterior) of the array and the TV for HTP is centered in the z-direction (superior–inferior). The combination of a voxel model with a specific RF applicator design will further be referred to as ‘configuration’.
All material parameters used for the EMF simulations are provided in .
Table 1. Materials and dielectric parameters used for electromagnetic field simulations.
Electromagnetic field simulations
EMF simulations were performed using Sim4Life V3.4 (ZurichMedTech, Zurich, Switzerland), with a broadband excitation at 297 ± 50 MHz and a simulation time of t = 120 ns. The resolution was limited to a maximum step size of 3 mm within the skull and 5 mm within the lower region of the voxel model. A much finer resolution of down to 0.5 mm was applied to resolve the triangular shape of the bow tie dipoles.
Human voxel models
To address patients’ individuality, EMF simulations were performed for two voxel models of the human head:
Human voxel model ‘Duke’ of the virtual family [Citation34] (IT’IS Foundation, Zürich, Switzerland) was modified to include an intracranial sphere (d = 4 cm, σTumor=1.15 S/m, εr,Tumor=66.5 [Citation34]) mimicking a small (<λ/2) tumor in the right parietal region of the brain with a TV of Vtarget=33.5 ml. To ensure a closed layer of cerebrospinal fluid (CSF) to account for a potential RF shielding effect [Citation37], the dura of the voxel model was assigned electromagnetic material properties of CSF (σ = 2.22 S/m) [Citation35]. This model will be further referred to as ‘small tumor model’.
To mimic the clinical scenario, a realistic voxel model representing a patient with GBM encompassing a large TV (>λ/2, Vtarget=500 ml) was generated from a computed tomography (CT) scan of a patient [Citation39]. The resulting voxel data exhibits the same resolution as the planning CT and distinguishes up to 20 labeled tissues, which were assigned EM material properties of tissue [Citation35]. A closed layer of external CSF was generated by upscaling the size of the brain by 5% while maintaining its shape and overwriting existing voxels assigned to muscle and skull. Assigning EM properties of CSF to the created envelope resulted in a closed layer with a thickness of 2–3 mm depending on the local mesh. This model will be further referred to as ‘large tumor model’.
Data processing
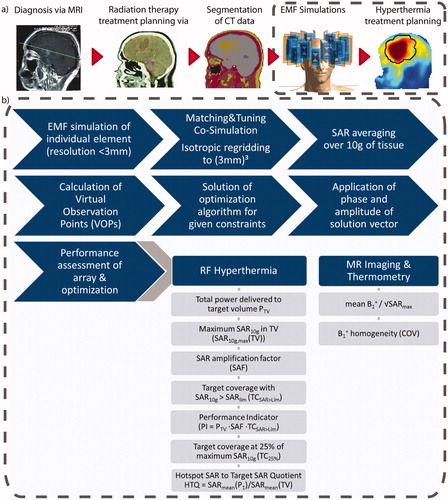
A circuit co-simulation was performed in MATLAB (MATLAB 2016b, The MathWorks, Natick, MA), optimizing the values of two lossy capacitances (equivalent series resistance = 0.15 Ω, equivalent series inductance = 1 nF) for channel-wise matching and tuning [Citation40], minimizing the trace of the scattering matrix. The multi-channel point-SAR distributions were scaled based on the resulting scattering matrix and rebinned [Citation41] to an isotropic grid of 3 mm. Our approach of thermal MR includes HTP and MR imaging. For the latter, guidelines ensuring patient safety rely on SAR averaging over cubes covering 10 g of tissue [Citation42]. To be in compliance with these guidelines and to be consistent throughout our calculations, SAR10g averaging [Citation43] was also employed for the HTP. A good correlation of this averaging mass with temperature rise has been reported for the applied frequency range [Citation43,Citation44], in the head [Citation45,Citation46] and in hyperthermia treatment of a human subject [Citation47]. This IEEE guideline foresees that averaging volumes comprising more than 10% air shall be assigned values from averaging cubes reaching into body instead of outwards. Since this does not generate new insights on the search for maximum SAR10g values but rather assigns values to two locations, the locations resulting in a volume with a fill rate of less than 90% were discarded to decrease the data volume. Virtual observation points (VOPs) were calculated to accelerate the optimization [Citation48,Citation49], yielding a VOP-based result. The overestimation was chosen for each configuration so that the number of VOPs was 500 ± 10%. After optimization, the non-compressed field data were combined with the obtained phase and amplitude setting (full result). Values for local (SAR10g,max(healthy)) and global (PHead) exposure were compared with and without the use of VOPs and the amplitude of the excitation vectors was scaled to match the full results to the VOP-based results, thus partially removing the intrinsic overestimation by the VOP approach. A general overview of the workflow is given in .
Figure 2. (a) Schematic presentation of the workflow from the diagnostic MRI of the patient to the SAR10g distribution as the hyperthermia treatment planning. (b) Details of the simulation and optimization process from the tumor models to the metrics to be evaluated to assess the RF array for hyperthermia treatment planning and magnetic resonance imaging performance.
Hyperthermia treatment planning
For the HTP, two optimization algorithms were developed, evaluated and compared for all RF coil array designs and for both tumor models. The goal of the optimization is to find excitation vectors defining the phase and amplitude setting for each channel. The resulting SAR pattern of the interfering incident electric fields causes the TV to heat up while the healthy tissue is spared of such exposure. We consider the scenario where multiple excitation settings can be played out consecutively so that their cumulative exposure constitutes the overall SAR pattern. The number of settings can be as high as the number of channels in the RF array. To suppress all solutions that contribute with less than 0.1% to the total delivered RF power, a threshold was introduced.
To describe the problem, we describe the power as the average power delivered in each of the m excitations, as previously described for a single excitation in [Citation50]:
(1)
(1)
where xj are the individual excitation vectors and
is the positive (semi)definite (psd) power correlation matrix of the tumor [Citation51]. The dimension N of the vector corresponds to the number of channels of the system. With a local SAR matrix
for each healthy voxel
local SAR for these excitations equates to
(2)
(2)
A similar matrix can be constructed to calculate global SAR. Using appropriate compression methods, the SAR matrices can be replaced by a much smaller number of VOPs [Citation48]. Both expressions for power deposition and local SAR are sums of quadratic forms, which can be rewritten using the trace operator to yield
(3)
(3)
By construction, is a positive (semi)definite matrix formed from the sum of outer products of the individual excitation vectors. We now seek to find
(4)
(4)
where
are the SAR constraints to be observed.
This problem has a well-understood structure, appearing in the semidefinite relaxation approximation of quadratic form maximization [Citation50], and can be solved via commonly available approaches such as the MATLAB-based modeling system for convex optimization (CVX [Citation52]) using different constraints. The actual excitation vectors can be recovered from Y using its Eigen decomposition. The phase and amplitude settings are determined from the product of the Eigen vector and the square root of its Eigen value. Time multiplexing [Citation53] is used when providing a better outcome, which is automatically determined by the algorithm.
First, the optimization goal was set to maximize total power absorption in the TV:
(5)
(5)
where tr is the trace of matrix; Y is the solution matrix (psd); Q is the tumor-SAR matrix; Vi is the SAR matrices of the generalized VOPs; Pmax is the power limit chosen for the optimization. Constraints to be defined are SAR10g,max (healthy tissue), the total power delivered to the healthy part of the head PHead (i.e., the remaining part of the head after numerically removing the TV so that the optimization does not limit itself) and the total available forward power PForward. Head power deposition was constrained via the global SAR matrix P. The possibility to limit Pmax is implemented in this approach but so far this has itself been the subject of investigations. Pmax was set so that SARLim would be the limiting factor in all cases. For further considerations one has to bear in mind that PHead is subject to varying absolute limits since the mass of the remaining exposed healthy tissue depends on patient anatomy and size of the TV. This optimization procedure will be further referred to as the ‘power optimization’.
The power optimization maximizes the total power delivered to the TV but does not consider the distribution of the power deposition inside the TV. Especially in large TVs, this could lead to a local SAR maximum while other regions of the TV experience low RF exposure. To address this shortcoming, a second optimization algorithm was implemented which homogenizes the power distribution within the TV by minimizing the deviation of every local SAR10g(TV) value from a given target SAR [Citation50]. High target values favor the maximization of the power deposition while lower values favor its flatness:
(6)
(6)
where s is the optimization goal to minimize the deviation between each local SAR10g value and b; b>0 is the targeted SAR10g(TV): to ensure that the algorithm targets voxels with low exposure that need increasing rather than voxels with high exposure that need reducing, we chose a high target SAR of b = 100 W/kg as previously reported in [Citation54]; Y = solution matrix (psd); Qi = random subsample of the SAR matrices in the target region to reduce computational burden, considering that spatially dense sampling is not required. We used an undersampling factor of 0.5 resulting in about 20 matrices per cm³; Vi = SAR matrices of the generalized VOPs and P = global SAR matrix. Constraints that can be defined are maximum SAR10g in the healthy tissue SAR10g,max(healthy), the total power delivered to the healthy part of the head PHead and the targeted SAR10g in the TV b. This optimization procedure will be further referred to as the ‘uniformity optimization’.
To define a safe limit for SAR10g,max, we simplified the Pennes’ bioheat transfer equation [Citation55], setting both the time-dependent and the conductive term to zero. Under the assumption of a basal brain perfusion of 50 ml/100 g/min, an average SAR of 50 W/kg results in a temperature increase of ΔT ≈+1.5 K without taking the protective response of thermoregulatory perfusion increase into account [Citation12]. Based on this estimation, we chose the SAR10g,max(healthy)=SARlim = 40 W/kg for our optimizations.
For the small tumor, only the tumor volume was chosen as TV for optimization. For the large tumor model, the TV was defined along the clinical target volume (CTV) used for radiation therapy according to the current guidelines of the Radiation Therapy Oncology Group (RTOG, https://www.rtog.org), i.e., comprising the macroscopic tumor growth, an isotropic margin of 2 cm to cover potentially infiltrated brain tissue plus further edematous areas. All other tissues were considered healthy tissue and subject to the stringent constraint of a maximum allowed power deposition.
HTP quality assessment
Quantitative assessment of SAR-based HTP quality offers a broad range of suggested metrics [Citation56], each with their own merits and drawbacks, and is still of interest to define most promising surrogates for the resulting temperature distribution [Citation57]. We assessed the following commonly [Citation21,Citation58,Citation59] used metrics:
SAR amplification factor (SAF)
(7)
TC25%
The target coverage (TC) with 25% of the maximum SAR10g (TC25%) is a measure for the SAR coverage of the TV while taking the exposure of the healthy tissue into account, but neglects the absolute SAR10g values reached. It is quantified as the fraction of voxels in the TV exhibiting a local SAR10g larger than 25% of the maximum exposure value found in the TV, SAR10g,max(TV).
Hotspot to target SAR quotient (HTQ)
In addition, to address some shortcomings of these metrics, we propose:
Performance indicator (PI)
A schematic overview of all metrics is summarized in .
MR imaging evaluation
To demonstrate that the RF applicators are also suitable for MRI and MRTh, magnetic transmission field (B1+) maps were calculated. A magnitude least square phase and amplitude B1+ shimming [Citation60] was performed in MATLAB for an ellipsoidal region of interest covering the brain by using the dimensions of a bounding box around the brain to define the axes of the ellipsoid. The imaging performance of each design was evaluated based on the transmit efficiency and transmit uniformity across the ellipsoidal region of interest (coefficient of variation, COV).
Results
Radiofrequency antenna arrays
For both head models, the reflection coefficients for all configurations are below –32 dB. Among all designs, the coupling coefficients for Design 1 (SmallTumorModel) are the highest with –12.8 dB. For the building blocks with the high dielectric permittivity (ɛr=200), all arrays could be perfectly matched and tuned to Sii<Sij<–17.8 dB. Such ceramic slurry can be produced using a mixture of BaTiO3 and CaTiO3 powder immersed in D2O [Citation27]. The highest scattering parameters for all designs are given in (full matrices are provided in the Supplementary Figure 1.2).
Table 2. Summary of all metrics assessing the performance of the RF-applicators, including the worst reflection and coupling coefficients (column 1, ‘Scattering’), the Hyperthermia Treatment Planning (HTP) results using the power optimization (column 2, ‘Power optimization’), the HTP results using the uniformity optimization (column 3, ‘Uniformity Optimization’) with # indicating the number of additive excitation phase and amplitude settings as well as the results of the B1+ shimming (column 4, ‘MRI’) for the small tumor model (top half) and the large tumor model (bottom half).
Small tumor model
The power optimization algorithm yielded an increased RF power deposition with a TC25% of 100% in the small TV for all configurations. For Designs 1, 5, 6 and 7, the cumulative exposure of two excitation settings (phase and amplitude) yields the optimized SAR10g distribution. The solution for all other designs consists of one excitation vector. The maximum intensity projections (MIPs) for the obtained SAR10g distributions overlaid with the SAR50 and SAR90 iso-contours are shown in the center column of . Additionally, the SAR10g maps in three orthogonal slices positioned in the center of the TV are shown in the center column of Supplementary Figure 3.2. The metrics are visualized in the top left of while all values are listed in .
Figure 3. Top row: sagittal, coronal and axial section through the small tumor model. Left: description and front view of each design simulated together with the small tumor model; maximum intensity projection of the SAR10g distribution after hyperthermia treatment planning for the power optimization (center) and the uniformity optimization (right).
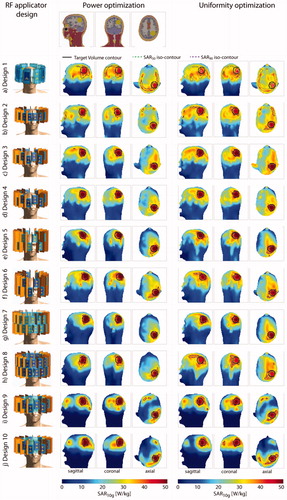
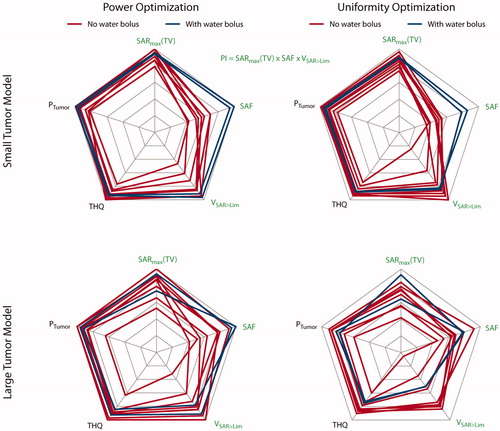
Figure 4. Qualitative comparison of the metrics used to assess HTP quality. The top row displays the results obtained for the small tumor model; the bottom row shows the results for the large tumor model. The results in the left column are obtained using the power optimization; the results of the uniformity optimization are in the right column. Blue lines highlight designs 9 and 10 equipped with a water bolus. All values are normalized to their respective intra-design, intra-optimizer maximum. Metrics labeled with a green font combine to the performance indicator. For better visualization so that higher values are always better, we plotted the reciprocal of the HTQ (1/HTQ = THQ). For the small tumor model, adding the water bolus clearly improved the SAF and pushed toward the highest values for SARmax(TV) and VSAR>Lim. For the large tumor model, the results are very heterogeneous; the water bolus does not add a clear improvement.
Increasing the number of channels from 8 to 16 when moving from Design 1 to Design 2 showed an increase in RF power deposition in the TV (PTumor(Design 2)=1.6 W vs. PTumor(Design 1)=1.5 W) – but also in the healthy part of the brain. Moving to Design 3 and introducing the third focusing dimension significantly decreased the exposure of the healthy tissue (SARmean(healthy, Design 3)=11.8 W/kg vs. SARmean(healthy, Design 2)=14.6 W/kg). Arranging the antennae in the elliptical manner (Design 4) allowed for higher total incident power (PHead(Design 4)=77.0 W vs. PHead (Design 3)=70.9 W) before reaching the local SAR10g (healthy) limit, yielding a performance indicator of PI = 88 W/kg, according to EquationEquation (9)(9)
(9) . The HTQ as defined in EquationEquation (8)
(8)
(8) decreases from HTQ (Design 1)=1.00 to HTQ (Design 4)=0.79 with these design improvements. Increasing the longitudinal coverage of the head (Design 5) enabled further focusing of the RF waves to the TV (PI = 178 W/kg). Changing to the elliptical setup of Design 6 decreased the PI (PI(Design 6) = 152 W/kg). Adding more degrees of freedom by increasing the number of channels to 32 further increased the PI for the circular but not for the elliptical arrangement (PI(Design 7)=191 W/kg, PI(Design 8) = 116 W/kg). Again, the HTQ values support these findings. The introduction of the water bolus allowed for a significant reduction of surface SAR10g. As a result, Designs 9 and 10 are the only designs where the limiting SAR10,max = 40 W/kg was reached adjacent to the TV rather than at the surface. In combination with a significant decrease in exposure of healthy tissue (PHead(Design 9) = 38.5W vs. PHead(Design 3) = 70.9 W and PHead(Design 10) = 36.6 W vs. PHead(Design 4) = 77.0 W), this resulted in significantly better performance for both arrays with water bolus (PI(Design 9) = 244 W/kg, PI(Design 10)= 277 W/kg). The HTQ values are among the lowest (HTQ(Design 9) = 0.83, HTQ(Design 10)=0.82) but outperformed by Design 7. Overall, the differences in HTQ for all 10 designs are very low, except for Design 1, showing the highest HTQ (HTQ(Design 1)=1.00).
The uniformity optimization yielded a superposition of two excitation phase and amplitude settings for all arrays without a water bolus (Designs 1–8), where one setting was found sufficient. The MIPs for the obtained SAR10g distributions overlaid with the SAR50 and SAR90 iso-contours are shown in the right column of . Additionally, the SAR10g maps in three orthogonal slices positioned in the center of the TV are shown in the right column of Supplementary Figure 3.2. The metrics are visualized in the top right of while all values are listed in . An increased TCSAR>Lim of the TV was achieved for Designs 2, 3 and 5 when compared to the power optimization. However, in all cases, the improvement comes at the expense of a decrease in SAF, as defined in EquationEquation (7)(7)
(7) , and maximum SAR10g in the TV. The TC25% of 100% could be maintained for all configurations. The HTQ values show the same behavior throughout the design iterations but exhibit a minor increase overall (lowest: HTQ(Design 4)=0.82, highest: HTQ(Design 1)=1.04). As a consequence, employing the uniformity optimization with the small tumor model showed no significant PI improvement.
Large tumor volume
The more frontal location of the large TV (V = 500 ml) resulted in a higher power deposition in the entire brain and including the region of the eyes and the nose. The MIPs for the obtained SAR10g distributions overlaid with the SAR50 and SAR90 iso-contours are shown in . Additionally, the SAR10g maps in three orthogonal slices positioned in the center of the TV are shown in the Supplementary Figure 5.2. The metrics are visualized in the bottom row of while all values are listed in .
Figure 5. Top row: sagittal, coronal and axial section through the large tumor model. Left: description and front view of each design simulated together with the large tumor model; maximum intensity projection of the SAR10g distribution after hyperthermia treatment planning for the power optimization (center) and the uniformity optimization (right).
The power optimization yielded a superposition of two excitation phase and amplitude settings for Designs 1, 2, 3, 7 and 8. The TC25% was well above 75% for all configurations (84–100%) without the water bolus. Significant differences were observed for TV coverage by using a higher amount of channels. At the same time, a reduction in exposure of healthy tissue was achieved. The PI increased with every iteration of the antenna array up to Design 6 (PImin=21 W/kg, PImax=210 W/kg), which also exhibits the best HTQ value (HTQ(Design 6)=0.79). This level of exposure could not be maintained when moving to Design 7, due to the high density of transmit elements close to the nose, resulting in the formation of a local SAR maximum (PI(Design 7)=82 W/kg, HTQ = 0.87). This could partly be countered with the elliptical arrangement in Design 8 (PI(Design 8)=131 W/kg, HTQ(Design 8)=0.84). The inclusion of a water bolus in Designs 9 and 10 did not show the same improvement as for the small TV. While an increase in SARmax(TV) and SAF could be observed, the enhanced RF focusing led to a significant decrease in TCSAR>Lim and TC25% (PI(Design 9)=105 W/kg vs. PI(Design 3)=117 W/kg, HTQ(Design(9)=0.99 vs. HTQ(Design 3)=0.86, TC25%(Design 9)=76% vs. TC25%(Design 3)=93%). Improvements were observed by moving to the elliptical Design 10 (PI(Design 10)=141 W/kg, HTQ(Design(10)=0.91, TC25%(Design 10)=93%), but the results did not match Design 6.
The uniformity optimization was designed to improve the HTP for large TVs by spreading the power deposition in the TV. This was achieved by a superposition of two excitation settings for all arrays but Design 10, where a third setting contributed another 8% to the total delivered power. In all non-bolus designs, the second phase setting contributed as much as 16–40% to the total delivered power vs. 0–31% in the power optimization.
The modest performance achieved with the in-plane arrays of Designs 1 and 2 was substantially enhanced when increasing the longitudinal coverage (PI(Design 5)=99 W/kg, PI(Design 3)=93 W/kg, PI(Design 2)=26 W/kg; HTQ(Design 5)=0.88, HTQ(Design 3)=0.92, HTQ(Design 2)=1.28). The additional degree of freedom of 32 channels in Design 7 did not add to the improvement but rather boosted the formation of a local SAR maximum (PI(Design 7)=47 W/kg, HTQ(Design 7)=0.98). All elliptical configurations outperformed the circular counterparts in PI (PI(Design 4)=95 W/kg vs. PI(Design 3)=93, HTQ(Design 4)=0.91 vs. HTQ(Design 3)=0.92; PI(Design 6)=128 W/kg vs. PI(Design 5)=99 W/kg, HTQ(Design 6)=0.85 vs. HTQ(Design 5)=0.88; PI(Design 8)=131 W/kg vs. PI(Design 7)=47 W/kg, HTQ(Design 8)=0.89 vs. HTQ(Design 7)=0.98). Minor improvements in SAF and as a result in PI were found when increasing the number of channels from 16 to 32 in the elliptical arrangement (PI(Design 8)=131 W/kg vs. PI(Design 6)=128 W/kg). Adding the water bolus significantly decreased the PI results for Design 9 (PI(Design 9)=63 W/kg vs. PI(Design 3)=17 W/kg) due to overfocusing (TCSAR>Lim(Design 9)=29.7% vs. TCSAR>Lim(Design 3)=47.5%), despite an increase in maximum power deposition (SARmax(TV,Design 9)=101.1 W/kg vs. SARmax(TV,Design 3)=82.43 W/kg) with poorer results for HTQ and TC25% (HTQ(Design 9)=1.02 vs. HTQ(Design 3)=0.92, TC25%(Design 9 = 80% vs. TC25%(Design 3)=100%). For Design 10, no improvement could be found (PI(Design 10)=63 W/kg, HTQ(Design 10)=1.06, TC25%(Design 10)=100%). Using the uniformity optimization helped TC25% values reach 100% for all arrays except Design 9, where only 80% could be reached, stating a significant improvement over the power optimization.
MR imaging evaluation
For the small tumor model, the best B1+ transmit efficiency was obtained for Design 1 (), which was comparable to Design 2
). The transmit efficiency was lowest for Design 7
) although the homogeneity improved (COV(Design 7)=11.0%).
For the large tumor model, all designs except Design 1 ) showed lower or similar B1+ transmit efficiencies compared to the small tumor model. Design 8 showed the lowest B1+ transmit efficiency (
COV(Design 8)=14.8%). A synopsis of the transmit efficiency and transmit uniformity is provided in the right column of .
Discussion
This work examined the applicability of high density annular-phased-array RF applicators and HTP in a small (<λ/2, Vtarget=33.5 ml) and large (>λ/2, Vtarget=500 ml) TV in the brain using EMF simulations.
Regarding the metrics used to examine our HTP quality, we found TC25% to be least informative, reaching 100% in 33 out of 40 HTP results, even in cases where SAR10g distribution did not appear promising for treatment. The validity of our proposed PI is supported by its correlation with the well-established HTQ. We believe that the PI adds to the HTP quality assessment since it offers a measure for absolute SAR and a higher differentiation compared to the HTQ. This being said, this work is, to the best of our knowledge, the first to present an HTQ <1 for HTP in the head [Citation61].
For the small tumor model, the power optimization clearly outperformed the uniformity optimization. The TV diameter of 4 cm approximates a third of the wavelength in tissue at 297 MHz and thus stresses the physical limits of RF focusing, thereby leading to good TC. Adding the uniformity as an optimization criterion limits maximization of delivered RF power. In conclusion, HTP for small TVs should be preferably performed using the power optimization. When lifting the SAR10g,max constraint of healthy tissue, this optimization converges to an optimization of the SAF [Citation21].
An incremental improvement in HTP performance was accomplished when moving from Design 1 to Design 5. Enabling the longitudinal steering in Design 3 resulted in increased sparing of healthy tissue. The elliptical arrangement of Design 4 afforded enhanced control over superficial power deposition. Without the use of a water bolus, the best RF focusing was achieved by using the highest degree of freedom for the 32 elements in Design 7. Design 8 could not maintain this performance due to higher power deposition in the temporal regions of the head.
Employing the uniformity optimization for the large TV resulted in a higher coverage TCSAR>Lim for only Designs 3 and 4. Further expenses at the cost of SARmax and SAF do not justify the use of the uniformity optimization, even though its principal effectiveness was shown by the higher contribution of secondary excitation settings and higher TC25% values.
Given the large geometrical extent of the TV in the large tumor model, the increased longitudinal coverage was essential to obtain good HTP results, peaking in the results found for the power optimization for Design 6. All elliptical arrangements allowed for better results than their circular counterparts. Increasing the number of elements from 16 to 32 added no clear improvement. Only TC25%(Design 8) in the power optimization and SAF and TCSAR>Lim(Design 8) in the uniformity optimization could be improved. All other metrics show no improvement, even a poorer performance, upon increasing the channel count.
Adding the water bolus supported an improvement in coupling of the RF energy to the body as well as focusing for the small tumor model. For the large tumor model, the increased focusing lead to a decreased TV coverage in Design 9. Moving to the elliptical Design 10 counters for some of this behavior but does not outperform the arrays without a water bolus. These designs show encouraging HTP results, whereby high enough power deposition in the TV may be reached without the requirement of a water bolus as coupling medium. This would substantially benefit patient comfort.
From an engineering perspective, our results suggest that it is possible to limit the RF applicator to 16 building blocks for both tumor models. This simplifies the RF applicator setup. Such a setup would be compatible with state-of-the-art 7.0 T MR instruments offering up to 16 RF amplifiers (Pmax=2 kW) for parallel transmission. In addition, the low coupling coefficients suggest that the copper shields might become obsolete, which would relax engineering and manufacturing constraints.
To summarize, our results revealed that the 16 element interleaved array using an elliptical arrangement provided the best results for the small tumor model, while the 16 element elliptical two row arrangement showed the best results for the large tumor model. This supports the idea of a ‘sliding applicator’, where the two rows of RF antennae can be displaced with respect to each other, adapting the longitudinal coverage of the brain individually in response to the size of the TV. Since our findings support the use of a water bolus for the small TV but not for the large TV, the question as to whether the engineering effort of designing an adaptable water bolus for such an applicator is weighed by the benefit will need to be answered by the ongoing investigation into a higher number of realistic tumor models. The elimination of the copper shields would ease the realization of this applicator.
To conclude, this work adds to the literature by examining integrated RF applicator concepts for thermal interventions in the brain including treatment planning based on realistic patient models. Swift translation of the RF applicator designs examined with numerical simulations into experimental prototypes remains conceptually appealing and an ambitious undertaking en route to clinical feasibility studies of thermal interventions of GBM.
Fig5-2__LargeTumor_centralAxis
Download TIFF Image (13.5 MB)Fig3-2__SmallTumor_centralAxis
Download TIFF Image (13.7 MB)Fig1-2__S-Matrices
Download TIFF Image (11.9 MB)Acknowledgements
The authors thank Hana Dobsicek Trefna and Massimiliano Zanoli (Chalmers University of Technology, Gothenburg, Sweden) for fruitful discussions about RF hyperthermia solutions in the treatment of brain tumors. Further gratitude goes to Sonia Waiczies for her thorough proofreading.
Disclosure statement
No potential conflict of interest was reported by the author(s).
Additional information
Funding
References
- McGuire S. World Cancer Report 2014. Geneva, Switzerland: World Health Organization, International Agency for Research on Cancer, WHO Press, 2015. Adv Nutr. 2016;7(2):418–419.
- Wust P, Hildebrandt B, Sreenivasa G, et al. Hyperthermia in combined treatment of cancer. Lancet Oncol. 2002;3(8):487–497.
- Horsman MR, Overgaard J. Hyperthermia: a potent enhancer of radiotherapy. Clin Oncol. 2007;19(6):418–426.
- Issels RD, Lindner LH, Verweij J, et al. Neo-adjuvant chemotherapy alone or with regional hyperthermia for localised high-risk soft-tissue sarcoma: a randomised phase 3 multicentre study. Lancet Oncol. 2010;11(6):561–570.
- Titsworth WL, Murad GJA, Hoh BL, et al. Fighting fire with fire: the revival of thermotherapy for gliomas. Anticancer Res. 2014;34(2):565–574.
- Sneed PK, Stauffer PR, McDermott MW, et al. Survival benefit of hyperthermia in a prospective randomized trial of brachytherapy boost ± hyperthermia for glioblastoma multiforme. Int J Radiat Oncol Biol Phys. 1998;40(2):287–295.
- McDannold N, Vykhodtseva N, Jolesz FA, et al. MRI investigation of the threshold for thermally induced blood–brain barrier disruption and brain tissue damage in the rabbit brain. Magn Reson Med. 2004;51(5):913–923.
- Zhang F, Xu C-L, Liu C-M. Drug delivery strategies to enhance the permeability of the blood–brain barrier for treatment of glioma. Drug Des Dev Ther. 2015;9:2089–2100.
- Wang D, Wang C, Wang L, et al. A comprehensive review in improving delivery of small-molecule chemotherapeutic agents overcoming the blood–brain/brain tumor barriers for glioblastoma treatment. Drug Deliv. 2019;26(1):551–565.
- Fiorentini G, Sarti D, Milandri C, et al. Modulated electrohyperthermia in integrative cancer treatment for relapsed malignant glioblastoma and astrocytoma: retrospective multicenter controlled study. Integr Cancer Ther. 2019;18:153473541881269.
- Kok HP, Navarro F, Strigari L, et al. Locoregional hyperthermia of deep-seated tumours applied with capacitive and radiative systems: a simulation study. Int J Hyperthermia. 2018;34(6):714–730.
- Wust P. Thermotherapy in oncology. Bremen, London, Boston: UNI-MED Verlag; 2016.
- Coluccia D, Fandino J, Schwyzer L, et al. First noninvasive thermal ablation of a brain tumor with MR-guided focused ultrasound. J Ther Ultrasound. 2014;2(1):17.
- Maloney E, Hwang JH. Emerging HIFU applications in cancer therapy. Int J Hyperthermia. 2015;31(3):302–309.
- Schneider CS, Woodworth GF, Vujaskovic Z, et al. Radiosensitization of high-grade gliomas through induced hyperthermia: review of clinical experience and the potential role of MR-guided focused ultrasound. Radiother Oncol. 2020;142:43–51.
- Paulides MM, Wielheesen DHM, Van Der Zee J, et al. Assessment of the local SAR distortion by major anatomical structures in a cylindrical neck phantom. Int J Hyperthermia. 2005;21(2):125–140.
- Bellizzi GG, Paulides MM, Drizdal T, et al. Selecting the optimal subset of antennas in hyperthermia treatment planning. IEEE J Electromagn RF Microw Med Biol. 2019;3(4):240–246.
- Verduijn GM, de Wee EM, Rijnen Z, et al. Deep hyperthermia with the HYPERcollar system combined with irradiation for advanced head and neck carcinoma – a feasibility study. Int J Hyperthermia. 2018;34(7):994–1001.
- Dobsicek Trefna H, Jonathan J, Vessman B, et al. Antenna applicator for microwave hyperthermia treatment of pediatric brain cancer. 8th European Conference on Antennas and Propagation, EuCAP 2014; 2014 Apr 6–11; The Hague, The Netherlands; 2014.
- Winter L, Oezerdem C, Hoffmann W, et al. Thermal magnetic resonance: physics considerations and electromagnetic field simulations up to 23.5 Tesla (1GHz). Radiat Oncol. 2015;10(1):1.
- Guérin B, Villena JF, Polimeridis AG, et al. Computation of ultimate SAR amplification factors for radiofrequency hyperthermia in non-uniform body models: impact of frequency and tumour location. Int J Hyperthermia. 2018;34(1):87–100.
- Andre K, Eva O, Helmar W, et al. Solving the time-and frequency-multiplexed problem of constrained radiofrequency induced hyperthermia. Cancers. 2020;12:1072.
- Winter L, Özerdem C, Hoffmann W, et al. Design and evaluation of a hybrid radiofrequency applicator for magnetic resonance imaging and RF induced hyperthermia: electromagnetic field simulations up to 14.0 tesla and proof-of-concept at 7.0 tesla. PLoS One. 2013;8(4):e61661.
- de Bever J, Pendse M, Rutt BK. Design of focused radio frequency heating array coils for non-invasive hyperthermia with ultra-high field MRI. 28th ISMRM-ESMRMB Joint Annual Meeting and Exhibition; Paris, France; 2018.
- Mallory M, Gogineni E, Jones GC, et al. Therapeutic hyperthermia: the old, the new, and the upcoming. Crit Rev Oncol/Hematol. 2016;97:56–64.
- Rieke V, Butts Pauly K. MR thermometry. J Magn Reson Imaging. 2008;27(2):376–390.
- Winter L, Oberacker E, Paul K, et al. Magnetic resonance thermometry: methodology, pitfalls and practical solutions. Int J Hyperthermia. 2016;32(1):63–75.
- Paulides MM, Mestrom RMC, Salim G, et al. A printed Yagi–Uda antenna for application in magnetic resonance thermometry guided microwave hyperthermia applicators. Phys Med Biol. 2017;62(5):1831–1847.
- Guérin B, Villena JF, Polimeridis AG, et al. Ultimate hyperthermia: computation of the best achievable radio-frequency hyperthermia treatments in non-uniform body models. 24th ISMRM Annual Meeting and Exhibition; Toronto, Canada; 2015.
- Ertürk MA, Sathyanarayana Hegde S, Bottomley PA. Radiofrequency ablation, MR thermometry, and high-spatial-resolution MR parametric imaging with a single, minimally invasive device. Radiology. 2016;281(3):927–932.
- Oezerdem C, Winter L, Graessl A, et al. 16-channel bow tie antenna transceiver array for cardiac MR at 7.0 tesla. Magn Reson Med. 2016;75(6):2553–2565.
- Raaijmakers AJE, Ipek O, Klomp DWJ, et al. Design of a radiative surface coil array element at 7 T: the single-side adapted dipole antenna. Magn Reson Med. 2011;66(5):1488–1497.
- Ebrahimi-Ganjeh MA, Attari AR. Study of water bolus effect on SAR penetration depth and effective field size for local hyperthermia. Prog Electromagn Res B. 2008;4:273–283.
- Restivo MC, van den Berg CAT, van Lier ALHMW, et al. Local specific absorption rate in brain tumors at 7 tesla. Magn Reson Med. 2016;75(1):381–389.
- Gabriel C. Compilation of the dielectric properties of body tissues at RF and microwave frequencies. DTIC Document; 1996.
- Athey TW, Stuchly MA, Stuchly SS. Measurement of radio frequency permittivity of biological tissues with an open-ended coaxial line: part I. IEEE Trans Microwave Theory Techn. 1982;30(1):82–86.
- Stuchly MA, Athey TW, Samaras GM, et al. Measurement of radio frequency permittivity of biological tissues with an open-ended coaxial line: part II—experimental results. IEEE Trans Microwave Theory Techn. 1982;30(1):87–92.
- Kozlov M, Kalloch B, Hlawitschka M, et al. Toward individualized specific absorption rates: building a surface-based human head model. 25th ISMRM Annual Meeting and Exhibition; Honolulu, Hawaii, United States; 2017.
- Nadobny J, Weihrauch M, Zschaeck S, et al. Fast and efficient generation of patient models for hyperthermia based on radiation therapy contours. 32nd Annual Meeting of the European Society for Hyperthermic Oncology. Berlin: Strahlentherapie und Onkologie; 2018.
- Lemdiasov RA, Obi AA, Ludwig R. A numerical postprocessing procedure for analyzing radio frequency MRI coils. Concepts Magn Reson. 2011;38A(4):133–147.
- Volken W, Frei D, Manser P, et al. An integral conservative gridding-algorithm using Hermitian curve interpolation. Phys Med Biol. 2008;53(21):6245–6263.
- IEEE recommended practice for determining the spatial‐peak specific absorption rate (SAR) in the human body due to wireless communications devices: measurement techniques; 2003.
- Kuehne A, Seifert F, Ittermann B. GPU-accelerated SAR computation with arbitrary averaging shapes. 20th ISMRM Annual Meeting and Exhibition; Melbourne, Australia; 2012.
- Razmadze A, Shoshiashvili L, Kakulia D, et al. Influence of specific absorption rate averaging schemes on correlation between mass-averaged specific absorption rate and temperature rise. Electromagnetics. 2009;29(1):77–90.
- Hirata A, Shirai K, Fujiwara O. On averaging mass of SAR correlating with temperature elevation due to a dipole antenna. Prog Electromagn Res. 2008;84:221–237.
- Morimoto R, Laakso I, De Santis V, et al. Relationship between peak spatial-averaged specific absorption rate and peak temperature elevation in human head in frequency range of 1–30 GHz. Phys Med Biol. 2016;61(14):5406–5425.
- Wainwright PR. The relationship of temperature rise to specific absorption rate and current in the human leg for exposure to electromagnetic radiation in the high frequency band. Phys Med Biol. 2003;48(19):3143–3155.
- Eichfelder G, Gebhardt M. Local specific absorption rate control for parallel transmission by virtual observation points. Magn Reson Med. 2011;66(5):1468–1476.
- Kuehne A, Waiczies H, Niendorf T. Massively accelerated VOP compression for population-scale RF safety models. 25th ISMRM Annual Meeting and Exhibition; Honolulu, Hawaii, USA; 2017.
- Luo Z-q, Ma W-k, So A, et al. Semidefinite relaxation of quadratic optimization problems. IEEE Signal Process Mag. 2010;27(3):20–34.
- Bardati F, Borrani A, Gerardino A, et al. SAR optimization in a phased array radiofrequency hyperthermia system. IEEE Trans Biomed Eng. 1995;42(12):1201–1207.
- Grant MC, Boyd SP, Ye Y. CVX: Matlab software for disciplined convex programming (web page and software). Available from: http://cvxr.com/cvx
- Zastrow E, Hagness SC, Van Veen BD, et al. Time-multiplexed beamforming for noninvasive microwave hyperthermia treatment. IEEE Trans Biomed Eng. 2011;58(6):1574–1584.
- Oberacker E, Kuehne A, Nadobny J, et al. Radiofrequency applicator concepts for simultaneous MR imaging and hyperthermia treatment of glioblastoma multiforme. Curr Direct Biomed Eng. 2017;3(2):473–477.
- Pennes HH. Analysis of tissue and arterial blood temperatures in the resting human forearm. J Appl Physiol. 1948;1(2):93–122.
- Canters RAM, Wust P, Bakker JF, et al. A literature survey on indicators for characterisation and optimisation of SAR distributions in deep hyperthermia, a plea for standardisation. Int J Hyperthermia. 2009;25(7):593–608.
- Bellizzi GG, Drizdal T, van Rhoon GC, et al. Predictive value of SAR based quality indicators for head and neck hyperthermia treatment quality. Int J Hyperthermia. 2019;36(1):455–465.
- Myerson RJ, Perez CA, Emami B, et al. Tumor control in long-term survivors following superficial hyperthermia. Int J Radiat Oncol Biol Phys. 1990;18(5):1123–1129.
- Lee HK, Antell AG, Perez CA, et al. Superficial hyperthermia and irradiation for recurrent breast carcinoma of the chest wall: prognostic factors in 196 tumors. Int J Radiat Oncol Biol Phys. 1998;40(2):365–375.
- Setsompop K, Wald LL, Alagappan V, et al. Magnitude least squares optimization for parallel radio frequency excitation design demonstrated at 7 Tesla with eight channels. Magn Reson Med. 2008;59(4):908–915.
- Takook P. Optimising microwave hyperthermia antenna systems. Chalmers University of Technology; 2018.