
 ?Mathematical formulae have been encoded as MathML and are displayed in this HTML version using MathJax in order to improve their display. Uncheck the box to turn MathJax off. This feature requires Javascript. Click on a formula to zoom.
Abstract
Introduction
The Cumulative Equivalent Minute at 43 °C (CEM43) thermal dose model has been empirically derived more than 30 years ago and still serves as a benchmark for hyperthermia protocols despite the advent of regulatory network models. However, CEM43 suffers from several limitations regarding its inability to predict the effect of complex time varying profiles (thermotolerance, step-down heating), to predict synergistic effects with drug treatments or to explain the specificity of a cell line in thermal resistance.
Objective
Define a new generic predictive tool for thermal injury based on regulatory network models. Identify the biological parameters that account for the thermal resistance.
Materials
Comparative study of cell survival upon hyperthermia collected from literature (17 sets in 11 publications that cover 14 different cell lines from 8 different tissues).
Results
A dynamical model describes accurately cell survival according to the amplitude and duration of exposure but also molecular chaperone expression level. In the case of square shape hyperthermia, approximated analytical expression of the cell survival is derived from the dynamical model and compared to CEM43 description. The molecular chaperone expression level defines the thermal resistance of a given cell line and can be estimated from a single experimental result through an easy-to-use graphical tool.
Conclusion
The tools offered here can be useful for designing treatments combining hyperthermia and chemotherapy targeting molecular chaperones, but also for designing personalized hyperthermic treatment by prior biochemical screening of molecular chaperones. These tools could advantageously replace the description of CEM43.
1. Introduction
Quantification of thermal injury of tissues is important for a wide variety of intentional and unintentional thermal exposures. In the oncological environment, thermal-based treatments are generally subdivided into two groups with respect to the targeted tissue temperature. Ablation therapy relies on the direct cytotoxic effect of temperature elevation (in general above 50 °C) [Citation1]. In contrast, hyperthermia-based therapies rely on elevating the tissue temperature between 40 and 45 °C to either kill cells or enhance the efficiency of other treatments [Citation1,Citation2].
Two methods have proved valuable for quantifying the relationship between thermal exposure and damages. The damage index (or the 50 °C isothermal contour) is used by the ablation community, whereas the cumulative equivalent minutes at 43 °C (CEM43) is typically used by the hyperthermia community [Citation1,Citation2]. Both the damage index and CEM43 methods are based on the underlying premise that tissue damages follow an irreversible first-order chemical reaction, with the rate constant following an Arrhenius relationship. These methods have been used for the last decades, with some rationalizations between them reported in the published literature [Citation3–6].
Experimental cell survival results have accumulated for many cell lines in recent decades [Citation1,Citation7–14]. They reveal that the survival response strongly varies among tissues but also among cell types of a given tissue. Breast cancer cells for instance are much more resistant than colon cancer cells: a 10 min exposure at 50 °C leads to 60% of MCF10A cell survival [Citation14] but fewer than 5% of RWPE cell survival [Citation13]. In the framework of phenomenological descriptions (CEM43 or Damage index), the variation of survival response with cell line is described by a simple parameter shift [Citation15], without providing any interpretation regarding the biological origins of these differences. However, all cells share the same architecture of the heat shock response network and cell death. Such variability raises several questions: Can we identify the key biological parameters that account for the cell type-specific thermal sensitivity? How can cell sensitivity to thermal exposure be enhanced or inhibited?
To answer those questions, we perform a comparative study of cell survival upon hyperthermia based on the literature survey and mathematical modeling. Comparative study based on CEM43 parameters cannot help: CEM43 parameters are not related to any intracellular properties (heat induced-damage, repair or damage-dependent effect on division, or survival pathways). In contrast, a dynamical model has recently been proposed to accurately describe cell survival data in HeLa cell line while overcoming some CEM43 limits [Citation16]. This model is derived from a data-driven biochemical network model of the heat-shock response in HeLa cells [Citation17], and connects the cell survival to elementary biochemical processes like synthesis, repair, degradation and the overall protein abundance of molecular chaperones. This is the reason why we use this dynamic model to perform mathematical modeling in the comparative study; the fact that the model components can be specifically targeted and modulated by drug therapies are also a clear motivation for its use.
First, we collect cell survival datasets from the literature (17 sets in 11 publications that cover 14 different cell lines from 8 different tissues listed in and replotted in ). These datasets are finely adjusted by a low-dimensional dynamical model where the Molecular Chaperone Expression Level (MCEL) is the prevailing biological parameter that varies among cell lines and explains their relative thermal resistance. Finally, we perform a mathematical analysis of the model to formulate a rescaled exposure time as a basis of comparison with CEM43, and also present an easy-to-use graphical tool to predict the cell survival upon both hyperthermia and anti-chaperone treatment.
Table 1. Collected experimental data sets.
2. Material and methods
2.1. Literature survey
Experimental data were collected from literature (). Publications containing graphs depicting survival of cells as a function of hyperthermic stress duration for different temperatures were selected when the data points could be quantified precisely enough by data extraction software. Only single-dose rectangular-shaped temperature profiles were considered. Each experimental point consists of three coordinates: survival fraction or percentage S, hyperthermia temperature TC, and duration of hyperthermia Δ. In addition, where available, time after exposure to hyperthermia before measuring survival has been taken into account, and reproduced in the numerical experiments. contains the list of cell lines together with references and label identification code used in the remaining of this paper. Experimental cell survival results are re-plotted as open circles in .
2.2. Dynamical model of the cell survival upon hyperthermia
The generic dynamical model of cell survival consists of two differential equations describing the time evolution of the damage D (the amount of misfolded protein), and the cell population S:
(1a)
(1a)
(1b)
(1b)
In the generic dynamical model of cell survival EquationEquations (1)(1a)
(1a) where t denotes the time in hours from the stress onset, T denotes the temperature in Celsius degrees, T = TC for
and 37 °C otherwise. The temperature-dependent function f denotes the temperature-dependent production rate of damage D where f is normalized such that
The function f has been previously estimated to
[Citation18].
EquationEquation (1a)(1a)
(1a) accounts for three biochemical processes: (1) the denaturation process, which creates misfolded proteins D from heat-labile proteins with a heat-dependent rate
(2) the degradation process, which destroys misfolded proteins without repair trials with a rate
(3) the renaturation process, which restores back misfolded proteins into heat-labile proteins, with a rate
EquationEquation (1a)(1a)
(1a) includes four cell line-dependent parameters: σ, the amount of damages created per hours at 37 °C, H the abundance of molecular chaperones; δ, the life time of damage in the high damage limit (where
); and γ the renaturation rate in the low damage limit (where
). In the high damage limit, the renaturation rate is limited by the MCEL H and the maximal renaturation rate is
Alternatively, the maximal renaturation rate
may be expressed as the renaturation rate for a so-called breakup temperature TB as
defining TB by an inverse problem. The breakup temperature roughly indicates the temperature above which the renaturation saturates and then the degradation dominates.
The second equation (EquationEquation 1b(1b)
(1b) ) describes the cell population S decaying with a rate
proportional to damages. The population equation (EquationEquation 1b
(1b)
(1b) ) does not include cell division process because the initial value of S is set to
where D37 is the D value in a steady state at 37 °C and
defines the experiment duration. Therefore,
(2)
(2)
corresponds to the cell survival measured by cell colony assay, where
for a constant exposure at 37 °C. The parameter α quantifies the cellular lethality in response to a given accumulated damage, which may differ from one cell line to another.
To quantitatively describe the cell survival response obtained over decades in different labs, we also add to EquationEquation (1)(1a)
(1a) an extra equation which accounts for the unknown incubator or water bath rise time. So, the temperature is assumed to follow the equation
where TC denotes the setpoint temperature and
the incubator rise time. The parameter
is estimated together with the core model parameters.
2.3. Parameter estimation procedure
In the first setting, the dynamical model defined by EquationEquation (1)(1a)
(1a) displays five parameters (σ, δ, γ, H, and α) which may vary among cell lines. This extensive parameterization (EquationEquation 1
(1a)
(1a) ) is likely to suffer from a lack of parameter identifiability in the absence of quantitative data on the misfolded protein concentration induced by the hyperthermia protocols. To circumvent this issue, we perform a normalization procedure for damage and chaperone to express them in an adapted concentration unit
all cells have therefore the same stationary levels of effective temperature-dependent damages
in the high damage regime (
). We also assign the parameter γ to its estimated value of γ = 1200 h–1 [Citation19] in U2OS, as the renaturation rate is very unlikely to differ between cell lines.
Upon these two assumptions, we obtain a generic dynamical model with only three parameters left: the MCEL,
the rescaled renaturation rate; and
It is worth noting that the maximal renaturation rate defines a breakup temperature
by an inverse problem. Using breakup temperature
conveniently determines the thermal resistance of a given cell line from parameter values.
Only three parameters retain to be estimated (κ, h, and ρ, in addition to the incubator temperature rise time τinc), which is sufficient to adjust the cell survival experimental set for various cell lines (solid lines in ). The parameters of the model defined in EquationEquation 1(1a)
(1a) (κ, h, ρ,
) are optimized to adjust each experimental data-set through Levenberg-Marquardt optimization Algorithm (LMA) [Citation20]. LMA minimizes the score function defined as a Root-Mean-Square Error (RMSE) (EquationEquation 3
(3)
(3) ) between the experimental data and the numerical results (open circles and line of ).
(3)
(3)
where
and
are experimental and numerical survival fractions, respectively. N is the total number of experimental points for a given experiment. Since LMA is a local optimization procedure and can strongly depend on the initial point, the method is applied to a hundred different initial conditions and the selected parameter set corresponds to the smallest score function. For each experimental data-set, we obtain an optimal parameter set
such that:
(4)
(4)
In addition, the parameter distributions are generated by Markov Chain Monte Carlo (MCMC) method through Metropolis-Hastings algorithm [Citation21] for each cell line; and represented as Box and whisker plots on Figure S1 of the Supplemental Material (displayed in gray) to visualize the confidence intervals.
The incubator rise time value is always well determined with a narrow distribution around the typical time scale of a standard incubator (
min); the estimated values are moreover similar for the different experimental results arising from the same lab. Regarding the free parameters (κ, h, and ρ), we found a weak local identifiability, characterized by parameter distributions covering several orders of magnitude, for breast and prostate cancer and for CHO in particular. Weak local identifiability undoubtedly indicates over-fitting. We therefore use a reductionist approach to reduce the parameter space dimensions and avoid over-fitting.
The systematic parameter estimation procedure reveals that, for most cell lines, κ and ρ parameter distributions almost overlap from one cell line to another (Figures. S1b and S1e) whereas only h, and consequently TB, vary with cell lines. Therefore, we restart the parameter estimation process with ρ and κ defined as global parameters i.e., with common value for all cell lines, whereas only h and are optimized with cell-line specific values.
In practice, parameter non-identifiability is reduced by defining two global parameters For each of
parameter values, optimal parameter set
is re-estimated using LMA:
(5)
(5)
while the optimal values of the global parameters
are also estimated using LMA:
(6)
(6)
where
is the number of experiments (see ). Parameter distributions for h and
are generated by MCMC–method through Metropolis-Hastings algorithm with a fixed value of the global parameters
This procedure ends up with h−1 and κ = 209 as optimal global parameters, while h and
values still vary significantly across cell lines with the same trend as previously.
If we assume that the h median value (around 0.1) corresponds to a typical concentration of HSP70 in mammalian cells (around 1 μM [Citation22,Citation23]), we get an estimation of M and thus are able to define all parameter values:
μM–1 h−1;
h−1; and
μM h−1. summarizes the parameter values or expressions used in the original model (given by EquationEquation 1
(1a)
(1a) ) as well as their used estimation methods. The choice of u-value does not affect the quality of the description but permit to fix a parameter set.
Table 2. Summary of model EquationEquation (1)(1a)
(1a) expression or parameter values and their estimation methods.
The relevance of this procedure of parameter space reduction is assessed by a good RMSE score adjustment for all cell lines except those that were already poorly described (Supplementary Figure S1A), and by a much stronger local identifiability (Supplementary Figure S1B-E). Even though two parameters are freely adjusted, the differences between cell lines can be essentially explained by the relative MCEL H in this cell survival upon hyperthermia model because the incubator time scale is only related to the experimental set-up.
2.4. Steady state analysis of survival curves
We aim to establish a detailed comparison between this new description and the standard CEM43 description. So, we first derive an analytical expression of the cell survival obtained in the generic dynamical model under two assumptions. First, we assume quasi-equilibrium for dynamical variables D and S. Second, we assume constant cell populations at 37 °C during the exposure duration Δ, thereby neglecting the normalization by the control population at 37 °C during the exposure duration Δ.
At a constant temperature T, damage can reach its fixed point value which is a stationary solution of EquationEquation (1a)
(1a)
(1a) ,
Analytical expression of the fixed point can be expressed in a simple setting by the use of the rescaled temperature parameter
where
(7)
(7)
summarizes the characteristic values of damage concentration in steady states. With parameter values given in , one finds a 10% decrease of the control cell population (at 37 °C) over one cell cycle (24 h) due to the heat-induced damage at 37 °C.
Table 3. Steady state concentration of damages as function of temperature.
How fast damage evolves to the fixed point depends on parameter (here
min). In the limit
damage reaches the fixed point value fast enough compared to the duration of hyperthermic stress, so that the contribution to the integral of damage during the transient dynamics at the moment and after the stress is negligible compared to the contribution during the stress. The integral of damage can, then, be approximated by the rectangular function of duration Δ and high
such that
can be rewritten as:
(8)
(8)
where
(9)
(9)
is a rescaled exposure duration at TB and
(10)
(10)
defines the survival for one hour exposure at TB temperature. The rescaled exposure duration corresponds to the exposure duration (
) when the temperature corresponds to the breakup temperature (TC = TB).
For each cell line, we compute the CEM43 for each experimental data point by using the standard expression with
and estimate the D0 parameter by a linear regression analysis.
3. Results
3.1. Survival response of cell lines mostly depends on their chaperone concentrations
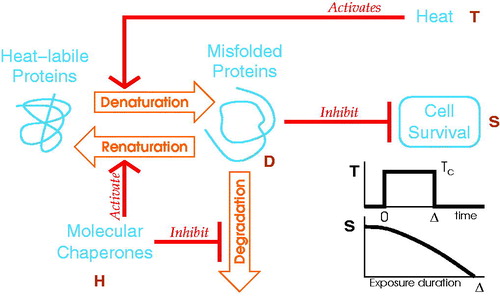
A generic model of cell survival, schematically drawn in , accounts for the heat inhibition of the cell survival via the heat induced misfolded proteins. Three molecular biochemical processes are used: (1) the denaturation process, which creates misfolded proteins D from heat-labile proteins with a heat-dependent rate; (2) the degradation process, which destroys misfolded proteins without repair trials; (3) the renaturation process, which restores back misfolded proteins into heat-labile proteins. The rate of the last two processes vary with the MCEL H. In this model, it is assumed that misfolded proteins D inhibit the cell survival S. This study aims to describe at best the cell survival experimental data in various cell lines upon transient hyperthermia protocol of duration Δ and setpoint temperature TC.
Figure 1. Cartoon of the generic model description of cell survival. Biochemical processes (orange arrows) control the misfolded protein concentration (D). Biochemical rates are modulated (red arrows) by heat (T) or by MCEL (H). The misfolded proteins inhibit the cell survival (S). The network globally describes a heat inhibited cell survival.
The model given by EquationEquation (1)(1a)
(1a) describes suitably the overall collected cell survival data, but with varying degree of accuracy depending on cell lines and parameters. The best data adjustments are obtained for human breast, cervix and colon cancer, melanoma, and mouse leukemia cell lines, while the data adjustment of human prostate cancer and Chinese hamster ovary cell lines being less satisfactory. The available data are nevertheless not always enough to really constrain the optimal parameters, independently of the data description goodness.
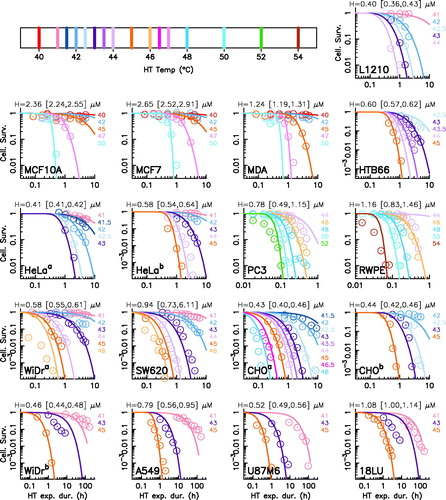
By a reductionist approach based on a parameter estimation procedure, we identify the MCEL H as the key cell type dependent parameter, all other parameters of the model being fixed to consensus values. With this single free parameter, the generic dynamical model succeeds to describe the collected cell survival data (). For each cell line, the estimated value of H with confidence interval (quartiles) is indicated directly on the corresponding panel in and reported in Table S1 of the Supplemental Material.
Figure 2. Generic model description of cell survival in various cell lines. Each panel corresponds to a cell survival experimental data-set (open circles) taken from the literature and displays the cell survival as a function of the exposure duration (Δ) at various maximum temperature TC. The corresponding experiment is identified directly on the panel by its abbreviation code according to . A color code is used to indicate the maximum temperature (see the legend on the top). Best descriptions via the generic model are displayed as solid lines the estimated MCEL and the confidence interval (quartiles of the MCMC parameter distributions) are displayed on the top of each panel.
To ease the interpretation, the H value may alternatively be converted into a so–called breakup temperature TB. The breakup temperature indicates the threshold temperature value above which the degradation process dominates the renaturation process in a steady state. In this framework, thermal resistant cell lines are thus characterized by high value of H and TB (see Table S1 of the Supplemental Material).
Up to now, the H is a model parameter value, mathematically adjusted to fit the experimental data. To test our prediction and link the estimated H values with the HSP70 protein abundance for various cancer types, we compare for each tissue the estimated values with Reverse Phase Protein Arrays (RPPA) measurements obtained from Cancer Proteome Atlas (). The good correlation between the two validates the here used modeling and reductionist approach.
Figure 3. Correlation between estimated H values and HSP70 protein abundance measured by Reverse Phase Protein Arrays (RPPA) (data are taken from The Cancer Proteome Atlas [Citation24]). Each rectangle corresponds to a different human tissue. The width of a rectangle corresponds to the dispersion of the h parameter values (given in ) over the various cell lines coming from the same human tissue (or the confidence interval if the cell line is unique), the height of a rectangle corresponds to the interquartile range of the HSP70 protein abundance in cancer cells of the tissue obtained from The Cancer Proteome Atlas [Citation24]. The color of a rectangle defines the tissue as indicated directly on the figure.
![Figure 3. Correlation between estimated H values and HSP70 protein abundance measured by Reverse Phase Protein Arrays (RPPA) (data are taken from The Cancer Proteome Atlas [Citation24]). Each rectangle corresponds to a different human tissue. The width of a rectangle corresponds to the dispersion of the h parameter values (given in Figure 2) over the various cell lines coming from the same human tissue (or the confidence interval if the cell line is unique), the height of a rectangle corresponds to the interquartile range of the HSP70 protein abundance in cancer cells of the tissue obtained from The Cancer Proteome Atlas [Citation24]. The color of a rectangle defines the tissue as indicated directly on the figure.](/cms/asset/2a44682c-9146-4551-84df-6b2218a437bb/ihyt_a_1762005_f0003_c.jpg)
In the collected data sets, three cell lines (HeLa, WiDR, and CHO) include duplicate results obtained in different labs. The CHO data are consistent and are characterized in our framework by a similar value of H, while HeLa and WiDR data display significant discrepancies between the labs. In particular, the fact that R.J. Palzer et al. survival data (HeLaa) display a shoulder, whereas E.G. Gerner et al. survival data (HeLab) do not, is here explained by a lower value of MCEL. Such a variability of the MCEL in the same cell line but different labs could arise from different cell culture conditions. It is more difficult to derive conclusion about WiDR because the data are poorly described by the reduced model. This is probably because the model does not take into account the slow (>3 h) transcriptional upregulation of molecular chaperones, while WiDrb data consider much longer exposure (up to 180 h).
3.2. Rationalization of thermal injury quantification methods
As demonstrated in the previous result sections, the generic dynamical model is a suitable description of the cell survival upon transient hyperthermia in various cell lines. For those hyperthermia protocol, and under reasonable assumptions (see M&M section for details), one can derive an analytical expression of the cell survival obtained in the generic dynamical model so as to establish a detailed comparison between this new description and the standard CEM43 description. The two descriptions are summarized in where the constant parameter values have been replaced by their values for clarity. In both descriptions, one free parameter remains to be determined: the dose parameter D0 in the CEM43 description and the MCEL H in the new description.
Table 4. Thermal injury quantification tools.
In the here developed description Δr is a new rescaled exposure duration at and
defines the survival for one hour exposure at TB temperature. The rescaled exposure duration corresponds to the exposure duration (
) when the temperature corresponds to the breakup temperature (
). Δr is thus similar to CEM43 whereas
is equivalent to the damage index. Detailed mathematical expressions of Δr and
are presented in the Material and Methods section only.
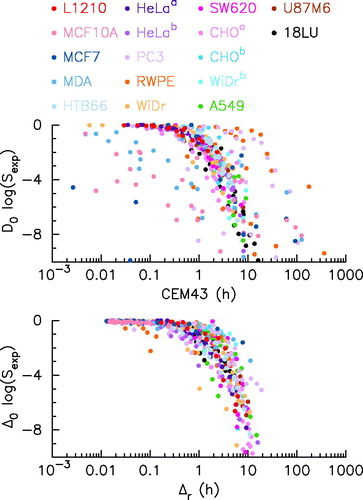
According to those descriptions all experiments may be recast on one simple curve by plotting vs. CEM43 in the CEM43 description () or by plotting
vs. Δr in the here developed description. As shown in , if both descriptions give satisfactory results, the description developed here slightly increases the quality of the description.
Figure 4. Survival and time rescaling. The dose survival response for various cell-line experiments (see the legend for color code) plotted as a function of cumulative equivalent minutes at 43 °C according (upper panel) or as function of equivalent minute at according to EquationEquation (8)
(8)
(8) (lower panel). D0 and CEM43 (upper panel) or
and Δr (lower panel) are estimated from regression.
In more details, the CEM43 and Δr are always positively correlated even if their values for the same experiment may significantly differ (see Figure S2 of the Supplemental Material). A difference between CEM43 and Δr appears when the value found by the optimization process moves away from the 43 °C of CEM43; this is especially clear for the breast (MCF10A, MCF7, and MDA) and prostate (PC3 and RWPE) cell lines (see of the Supplemental Material). The temperature dependency of CEM43 and Δr is highlighted in the of the Supplemental Material by plotting the quantity
where X refers to D0 in the CEM43 description and
in the generic model description (). In the CEM43 description, two different regimes are predicted: below and above the breakpoint (43 °C here), whereas the Generic Model Description predicts three different regimes:
and
(). Unfortunately, none of these experiments displays a sufficiently wide range of exposure temperature to discriminate between the two predictions.
3.3. Graphical determination of molecular chaperones concentration from a single experimental result
Based on the analytical results derived in the previous section, one can build a universal graphical tool () to estimate the H parameter value from one single cell survival experiment. Let us assume that one measures the cell survival in another cell line for one transient thermal exposure at temperature T for an exposure duration Δ, for instance 37% of cell survival for 1 h at 42 °C. Then by computing
(1 in the previous example), and using EquationEquation 8
(8)
(8) , one can estimate the H parameter value from the overlapping of the experimental result and the H-isolines (
in the previous example), without having to implement fitting procedures. Obviously, the validity of this graphical approach depends on the conditions previously defined: the exposure duration must be much longer than the incubator rise time, and the precision of the H value determination is maximal where the H isolines are well separated on the graph.
Figure 5. Graphical determination of H value from a single experimental result. The H parameter value can be graphically determined from one cell survival experimental result by using this abacus. For instance, a 37% cell survival () for a 1 h exposure at 42 °C corresponds to
(brown continuous line). Continuous lines are obtained by using EquationEquation (8)
(8)
(8) with κ = 209 and
the color code defines the H value (see the legend on the top).
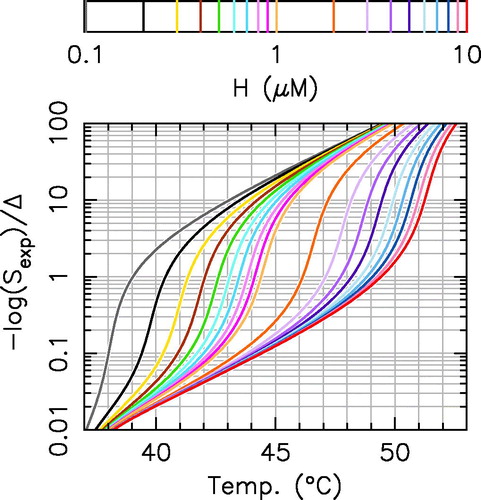
The may also be used to predict graphically the effect of a drug treatment targeting molecular chaperones. In the framework of the previous example (%, for
C and Δ = 1 h), predicts that a two-fold inhibition of molecular chaperones
leads to a 4.5-fold increase of
and thus 1% of cell survival. The clearly identifies the parameter region where molecular chaperone inhibition strongly decreases the cell survival upon hyperthermia e.g., the parameter area where a significant vertical shift is obtained by moving from one H isoline to another without changing the temperature.
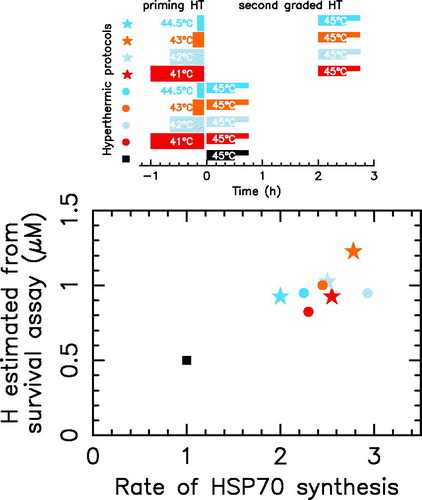
To test the graphical determination method of H, we search in the literature for cell survival experimental results on a given cell line with quantified varying MCELs and we found a complete experimental data set obtained in the field of thermotolerance study. It is well known that a first non-lethal heat treatment induce the HSP70 synthesis and thus increases the cell survival obtained in a second treatment. Long time ago, G. Li and J. Mak contributed to establish this knowledge by studying the induction of Heat Shock Protein synthesis during the development of thermotolerance with squamous cell Carcinoma implanted in the flank of C3H mice ([Citation25]). These authors applied a first priming heat treatment in vivo (41 °C for 60 min, 42 °C for 40 min, 43 °C for 15 min, or 44.5 °C for 10 min) followed by graded second treatments at 45 °C in vitro where they performed cell survival assay. The various thermal protocols are schematically displayed in . In parallel they measure the relative rate of HSP70 synthesis induced by the first priming heat treatment. As shown in , the H parameter value that is estimated from survival assay in each thermal protocol by using , is highly correlated with the HSP70 synthesis rate measured by G. Li and J. Mak. Therefore, the here presented model is a valuable tool to predict the thermotolerance once the molecular chaperone induction is known.
Figure 6. Thermotolerance induced by HSP70 induction. The upper panel schematically exhibits the thermal protocols used to study the induction of HSP70 during the development of thermotolerance. The first priming treatment corresponds to no priming treatment (black), 41 °C for 60 min (red), 42 °C for 40 min (light blue), 43 °C for 15 min (orange), 44.5 °C for 10 min (dark blue). For each first priming treatment, survival assay is performed through three different second treatments: (1) no second treatment, (2) 45 °C for 30 min, or (3) 45 °C for 45 min. Three cases are considered: (1) no priming treatment (filled square), (2) no recovery between the two treatments (filled circles), and (3) a 2 h recovery between the two treatments (filled stars). The lower panel highlights the correlation between the rate of HSP70 synthesis and the estimated H value from survival assay.
4. Discussion
Thermal dose tools quantify hyperthermia lethality, whether caused by intentional exposure or not, and assist treatment design and side damage prevention. The widely used CEM43 description suffers from numerous limitations acknowledged for long, thereby restricts elaboration of new treatment strategies. In particular, CEM43 leaves out thermotolerance, step-down heating effect, and more generally lacks of accuracy in case of complex time varying hyperthermia [Citation16,Citation26]. Furthermore, the CEM43 phenomenological origin disconnects parameters values from fundamental biological or biochemical processes, and thus leaves the thermal sensitivity variation with cell line unexplained [Citation27]. Such a disconnectedness harms new therapies design as treatments personalization. So, beyond the simple rational satisfaction, unveiling such links would indeed assist chemotherapeutic hyperthermia design, either by designing the drug that specifically targets the pathway responsible for thermal resistance, or by designing hyperthermic protocols that reckon on the chemotherapy-induced downregulation of thermal sensitivity. Unveiling such links would also assist treatments personalization in which identified biomarkers would quantify thermal resistance of tumors based on biopsy [Citation28].
To overcome those CEM43 limitations while keeping its accuracy, we propose here a dynamic and mechanistic modeling framework as a CEM43 alternative. The new description may, thus, be used by either performing numerical integration of the dynamical model (EquationEquation 1(1a)
(1a) ) or by using the approximate analytical description ( and spreadsheet provided in the Supplemental Material) or by using the graphical determination methods (). However, some limitations of CEM43 still remain in this new thermal injury quantification tool: both tools focus on cell survival and are not suitable to describe nor predict the improved perfusion and oxygenation in tumor after a mild hyperthermia [Citation29,Citation30]. The new description uses MCEL as a master regulator of thermal sensitivity, in line with parameter analysis and experimental cross checking. The new description therefore predicts cell survival in the event of hyperthermia in the first place, but also in the event of MCEL inhibition. Because the HSP70 chaperone function prevents heat-induced apoptosis [Citation31] and lysosomal cell death [Citation32,Citation33], HSP70s indeed negatively influence antiproliferative and apoptosis-inducing therapies [Citation34,Citation35]. HSP70 has therefore been suggested as a prognosis biomarker [Citation36–39] and molecular chaperones inhibition has also been suggested and experimentally tested as a promising drug target for anticancer treatment [Citation40–44]. The new description could for instance be used to optimize hyperthermic intraperitoneal chemotherapy design [Citation45].
Over a population or a tumor, MCEL cell-to-cell variability deeply influences thermal cytotoxicity: cells having a higher MCEL being more thermal resistant [Citation46,Citation47]. This known result differs from the one derived here: average MCEL of a cell line explains thermal cytotoxicity. Highlighting those two facts consistency requests to consider two kinds of MCEL variation. The first one to consider is the MCEL variation in a cell population (cell-to-cell variability). The MCEL lognormal distribution induces the cell-to-cell variability (phenotypic heterogeneity) of the heat shock network dynamic response [Citation48] and of the thermal cytotoxicity [Citation46,Citation47]. In our opinion, the MCEL cell-to-cell variability explains the fractional killing: only cells having higher values of the MCEL survive. The second one to consider is the variation of the average MCEL from one cell type to another (cell line variability) e.g., a variation of the center of the MCEL distribution. This variation defines thermal sensitivity of a given cell line. In the cell population model given by EquationEquations (1a,b(1a)
(1a) ), a death probability directly accounts for fractional killing and the surviving fraction thus is one of the model variables. The H-parameter therefore corresponds to the average value of MCEL. In contrast, a single cell model would have given as an output a binary death (dead or alive) and the cell-to-cell variability of MCEL would have given fractional killing.
The CEM43 description is an isoeffect tool: CEM43 defines a relation between amplitude and exposure time to obtain the same cell survival fraction. Performing numerous colony formation tests, aiming to determine the parameter d0, is indeed an essential prerequisite for cell survival quantification from CEM43. Consequently, in the laboratory, with each new cell line, with each new condition of laboratory culture, but also in the clinic, with each new tumor or each new patient, the parameter d0 must be recalibrated beforehand to target a cell survival setpoint by tuning an hyperthermic protocol. This is obviously very tedious and almost impossible to implement. We believe that these new tools could constitute a valuable step toward personalized hyperthermia protocols. Let’s imagine having, in the lab, a control cell culture with well-established cell survival assay and thus well-estimated H-parameter value used as a reference (named ). Then, to design the hyperthermia treatment, the value of the H-parameter of the tumor considered can be estimated relatively to
by a biochemical measurement (immunohistochemistry, western blot or PCR) targeting HSP70. To clarify, let us take the example of a measurement by ELISA indicating an over-expression of 20% of the HSPs in the tumor biopsy whereas the reference line is characterized by an H value of 0.4; in this case the tumor will be characterized by a value of the parameter H of 0.48. This protocol is much faster than colony assays and could therefore be implemented routinely. Once the H value is calibrated, the proposed abacus () for instance can be used to design hyperthermic protocols to achieve the targeted cell kill.
The reliability and accuracy of survival model predictions are essential expectations for designing optimal personalized hyperthermic treatments. As shown here, the predictions of the mathematical model are in good quantitative agreement with the experimental data, three possible refinements may nevertheless be pointed out. First, the reductionist approach used, which keeps only one free parameter to capture cell line-specific properties, can be considered as an extreme. Undoubtedly, some other differences between different cell lines contribute in some ways to thermal sensitivity, as extracellular pH or nutrient levels. However, the MCEL may still be the master regulator of thermal sensitivity, for instance the MCEL increases with pH [Citation49] while the cell survival upon hyperthermia decreases whith pH [Citation50], in consistency with the model predictions. Clear quantification of these secondary factors would require, for each cell line, joint measurements of chaperone concentration and cell survival to track discrepancies. Second, the denaturation rate considered has, however, been established by indirect fitting procedure rather than direct measurement [Citation18] and, up to our knowledge, no information is available concerning the precision of its formulation. Detailed investigation on the denaturation function could, thus, be an important source of model refinement. Finally, third, the regulated synthesis of molecular chaperones, which is responsible for the phenomenon of thermotolerance [Citation51], is missing in the present model. This simplifying assumption was convenient to reduce the number of model parameters, and thus avoid overfitting given the experimental data available. As we have shown, the model nevertheless depicts this phenomenon provided the concentration of molecular chaperone is correctly and manually adjusted for each pulse of hyperthermia. Yet, the model could be extended to implement active transcription of molecular chaperones, which would require a well-supplied set of experimental data to reach a survival prediction model for fractional treatments, which would be a major advance compared at CEM43.
To conclude, we present a new tool to define the cell survival in various cell lines upon hyperthermia and/or anti-chaperones treatment that challenges the CEM43 description accuracy while overcoming some CEM43 limitations and which offers refinement perspectives through extended experimental studies.
Disclosure statement
No potential conflict of interest was reported by the author(s).
Additional information
Funding
References
- Dewhirst MW, Viglianti B, Lora-Michiels M, et al. Basic principles of thermal dosimetry and thermal thresholds for tissue damage from hyperthermia. Int J Hyperther. 2003;19(3):267–294.
- Yarmolenko PS, Moon EJ, Landon C, et al. Thresholds for thermal damage to normal tissues: an update. Int J Hyperther. 2011;27(4):320–343.
- Sapareto SA, Dewey WC. Thermal dose determination in cancer therapy. Int J Radiat Oncol Biol Phys. 1984;10(6):787–800.
- Lepock JR. Cellular effects of hyperthermia: relevance to the minimum dose for thermal damage. Int J Hyperther. 2003;19(3):252–266.
- Pearce JA. Comparative analysis of mathematical models of cell death and thermal damage processes. Int J Hyperther. 2013;29(4):262–280.
- Viglianti BL, Dewhirst MW, Abraham JP, et al. Rationalization of thermal injury quantification methods: application to skin burns. Burns. 2014;40(5):896–902.
- Palzer RJ, Heidelberger C. Studies on the quantitative biology of hyperthermic killing of HeLa cells. Cancer Res. 1973;33(2):415–421.
- Gerner EW, Boone R, Connor WG, et al. A Transient Thermotolerant Survival Response Produced by Single Thermal Doses in HeLa Cells. Cancer Res. 1976;36(3):1035–1040.
- Bhuyan BK, Day KJ, Edgerton CE, et al. Sensitivity of different cell lines and of different phases in the cell cycle to hyperthermia. Cancer Res. 1977;37(10):3780–3784.
- Bauer KD, Henle KJ. Arrhenius analysis of heat survival curves from normal and thermotolerant cho cells. Radiat. Res. 1979;78(2):251–263.
- Armour EP, McEachern D, Wang Z, et al. Sensitivity of human cells to mild hyperthermia. Cancer Res. 1993;53(12):2740–2744.
- Hildebrandt B, Wust P, Ahlers O, et al. The cellular and molecular basis of hyperthermia. Crit Rev Oncol Hematol. 2002;43(1):33–56.
- Feng Y, Tinsley Oden J, Rylander MN. A two-state cell damage model under hyperthermic conditions: theory and in vitro experiments. J Biomech Eng. 2008;130(4):041016.
- Thompson EA, Graham E, MacNeill CM, et al. Differential response of MCF7, MDA-MB-231, and MCF 10A cells to hyperthermia, silver nanoparticles and silver nanoparticle-induced photothermal therapy. Int J Hyperth. 2014 ;30(5):312–323.
- Bhuyan BK. Kinetics of cell kill by hyperthermia. Cancer Res. 1979;39(6 Pt 2):2277–2284.
- Ladjimi M, Labavić D, Guilbert M, et al. Dynamical thermal dose models and dose time-profile effects. Int J Hyperther. 2019;36(1):720–729.
- Sivéry A, Courtade E, Thommen Q. A minimal titration model of the mammalian dynamical heat shock response. Phys Biol. 2016;13(6):066008.
- Peper A, Grimbergen CA, Spaan J, et al. A mathematical model of the hsp70 regulation in the cell. Int J Hyperther. 1998;14(1):97–124.
- Ebbinghaus S, Dhar A, McDonald JD, et al. Protein folding stability and dynamics imaged in a living cell. Nat Methods. 2010;7(4):319–323.
- Moré JJ. The levenberg-marquardt algorithm: implementation and theory. In: Numerical analysis. Scotland: Springer; 1978. p. 105–116.
- Geyer CJ. Markov chain monte carlo maximum likelihood. Fairfax Station (VA): Interface Foundation of North America; 1991.
- Nagaraj N, Wisniewski JR, Geiger T, et al. Deep proteome and transcriptome mapping of a human cancer cell line. Mol Syst Biol. 2011;7(1):548.
- Finka A, Goloubinoff P. Proteomic data from human cell cultures refine mechanisms of chaperone-mediated protein homeostasis. Cell Stress and Chaperones. 2013;18(5):591–605.
- The cancer proteome atlas. 2019; [cited 2019 Oct 21]. Available from: https://tcpaportal.org/tcpa/.
- Li GC, Mak JY. Induction of heat shock protein synthesis in murine tumors during the development of thermotolerance. Cancer Res. 1985;45(8):3816–3824.
- Mouratidis PX, Rivens I, Civale J, et al. Relationship between thermal dose and cell death for “rapid” ablative and “slow” hyperthermic heating. Int J Hyperther. 2019;36(1):228–243.
- Dewey WC. Arrhenius relationships from the molecule and cell to the clinic. Int J Hyperther. 1994;10(4):457–483.
- Meric-Bernstam F, Mills GB. Overcoming implementation challenges of personalized cancer therapy. Nat Rev Clin Oncol. 2012;9(9):542–548.
- Song C, Park H, Lee CK, et al. Implications of increased tumor blood flow and oxygenation caused by mild temperature hyperthermia in tumor treatment. Int J Hyperther. 2005;21(8):761–767.
- van Rhoon GC. Is cem43 still a relevant thermal dose parameter for hyperthermia treatment monitoring? Int J Hyperther. 2016;32(1):50–62.
- Mosser DD, Caron AW, Bourget L, et al. The chaperone function of hsp70 is required for protection against stress-induced apoptosis. Mol Cell Biol. 2000;20(19):7146–7159.
- Nylandsted J, Gyrd-Hansen M, Danielewicz A, et al. Heat shock protein 70 promotes cell survival by inhibiting lysosomal membrane permeabilization. J Exp Med. 2004;200(4):425–435.
- Gyrd-Hansen M, Nylandsted J, Jäättelä M. Heat shock protein 70 promotes cancer cell viability by safeguarding lysosomal integrity. Cell Cycle. 2004;3(12):1484–1485.
- Van’t Veer LJ, Dai H, Van De Vijver MJ, et al. Gene expression profiling predicts clinical outcome of breast cancer. Nature. 2002;415(6871):530–536.
- Ciocca DR, Calderwood SK. Heat shock proteins in cancer: diagnostic, prognostic, predictive, and treatment implications. Cell Stress Chaperones. 2005;10(2):86–103.
- Vargas-Roig LM, Fanelli MA, López LA, et al. Heat shock proteins and cell proliferation in human breast cancer biopsy samples. Cancer Detect. Prev. 1997;21(5):441–451.,
- Luk JM, Lam CT, Siu AF, et al. Proteomic profiling of hepatocellular carcinoma in chinese cohort reveals heat-shock proteins (hsp27, hsp70, grp78) up-regulation and their associated prognostic values. Proteomics. 2006;6(3):1049–1057.
- Pfister K, Radons J, Busch R, et al. Patient survival by hsp70 membrane phenotype: association with different routes of metastasis. Cancer: Interdis Int J Am Cancer Soc. 2007;110(4):926–935.
- Gehrmann M, Specht HM, Bayer C, et al. Hsp70-a biomarker for tumor detection and monitoring of outcome of radiation therapy in patients with squamous cell carcinoma of the head and neck. Radiat Oncol. 2014;9(1):131.
- Calderwood S, Asea A. Targeting hsp70 induced thermotolerance for design of thermal sensitizers. Int J Hyperther. 2002;18(6):597–608.
- Goloudina AR, Demidov ON, Garrido C. Inhibition of hsp70: a challenging anti-cancer strategy. Cancer Lett. 2012;325(2):117–124.
- Balaburski GM, Leu JI-J, Beeharry N, et al. A modified hsp70 inhibitor shows broad activity as an anticancer agent. Mol Cancer Res. 2013;11(3):219–229.
- Nylandsted J, Wick W, Hirt UA, et al. Eradication of glioblastoma, and breast and colon carcinoma xenografts by hsp70 depletion. Cancer Res. 2002;62(24):7139–7142.
- Gabai VL, Yaglom JA, Wang Y, et al. Anticancer effects of targeting hsp70 in tumor stromal cells. Cancer Res. 2016;76(20):5926–5932.
- Pelz JO, Vetterlein M, Grimmig T, et al. Hyperthermic intraperitoneal chemotherapy in patients with peritoneal carcinomatosis: role of heat shock proteins and dissecting effects of hyperthermia. Ann Surg Oncol. 2013;20(4):1105–1113.
- Marquez CM, Sneed PK, Li GC, et al. Hsp 70 synthesis in clinical hyperthermia patients: preliminary results of a new technique. Int J Radiat Oncol Biol Phys. 1994;28(2):425–430.
- Liu FF, Miller N, Levin W, et al. The potential role of hsp70 as an indicator of response to radiation and hyperthermia treatments for recurrent breast cancer. Int J Hyperther. 1996;12(2):197–208.
- Guilbert M, Anquez F, Pruvost A, et al. Protein level variability determines phenotypic heterogeneity in proteotoxic stress response. FEBS J. 2020. doi:10.1111/febs.15297
- Neuhaus-Steinmetz U, Skrandies S, Rensing L. Heat shock protein synthesis is affected by intracellular ph: inhibition by monensin-induced alkalosis in c6 rat glioma cells. Brain Res. 1996;724(1):16–24.
- Overgaard J. Influence of extracellular ph on the viability and morphology of tumor cells exposed to hyperthermia. J Natl Cancer Inst. 1976;56(6):1243–1250.
- Mizzen LA, Welch WJ. Characterization of the thermotolerant cell. i. effects on protein synthesis activity and the regulation of heat-shock protein 70 expression. J Cell Biol. 1988;106(4):1105–1116.