
 ?Mathematical formulae have been encoded as MathML and are displayed in this HTML version using MathJax in order to improve their display. Uncheck the box to turn MathJax off. This feature requires Javascript. Click on a formula to zoom.
Abstract
Purpose
The quality assurance guidelines of the European Society for Hyperthermic Oncology (ESHO) specify the requirements for appropriate superficial heating using phantoms. In this current piglet study, we have examined these requirements under in vivo conditions.
Materials and Methods
The evaluation is based on simultaneous, invasive temperature measurements at 8 different depths between 2 and 20 mm in the thigh of anesthetized piglets during irradiation with water-filtered infrared radiation (wIRA). Temperature probes were equally distributed in an area of 10 cm diameter of homogeneously irradiated skin. Piglets were irradiated to 126.5 mW cm−2 in the spectral range of IR-A.
Results
Heating rates and specific absorption rates were in full accordance with the ESHO standards. Due to early onset of thermoregulation, the desired temperature rise of 6 K at a depth of 5 mm was achieved after about 10 min of exposure, i.e. 4 min later than required for phantoms. After reaching thermal steady state, on average T90 ≥ 40 °C occurred in tissue depths up to 20 mm, T50 ≥ 41 °C up to 16 mm, and a mean CEM43T90 ≈ 1 min was calculated for depths up to 8 mm.
Conclusions
Piglet data are comparable with preliminary literature data assessed in vivo in the abdominal wall and in recurrent breast cancer of humans. The potential of wIRA-HT for adequate treatment of superficial tissues/cancers in the clinical setting thus is confirmed. To ensure therapeutically needed doses of wIRA-HT, irradiation times should be extended.
1. Introduction
Water-filtered infrared-A radiation (wIRA) is considered by the European Society for Hyperthermic Oncology (ESHO) as an ‘external non-contacting IR heating system’ for superficial hyperthermia in oncology [Citation1] with reference to a number of published data [Citation2–12]. Notter et al. [Citation13–15] reported the successful use of wIRA-HT, immediately followed by hypofractionated re-irradiation for the treatment of locally recurrent breast cancer. Physical and photobiological basics of wIRA in thermal therapy were provided by Piazena et al. [Citation16] and Vaupel et al. [Citation17] with reference to the ESHO quality assurance guidelines for superficial hyperthermia in oncology (see [Citation1]). According to these guidelines, devices for superficial hyperthermia in oncology should comply with a number of quality standards regarding heating rate (HR), specific absorption rate (SAR) and different characteristics of the temporal and local temperature rise (TR) in the tissue which have to be proved in muscle-equivalent phantoms [Citation1]. Compliance with clinical criteria related to the thermal state and the thermal dose (TD) should be ensured during treatment time [Citation18]. However, currently required phantom-based measurements do not take into account significant factors which affect the kinetics and the degree of heating under in vivo conditions, such as the initial thermal state, the effectiveness of cutaneous thermoregulation and the thickness of the skin and fat layer. Therefore, it is of fundamental interest to evaluate the effectiveness of wIRA-hyperthermia under in vivo conditions considering thermal response during and upon heating and its clinical applicability in a realistic and quantitative way.
For this purpose, data sets of invasive in vivo measurements of the thermal field formation in skin and subcutis of piglets during wIRA-irradiation were used [Citation19].
The evaluation was based on calculations of the ESHO quality criteria for adequate superficial heating to prove compliance.
2. Materials and methods
2.1. wIRA-irradiation
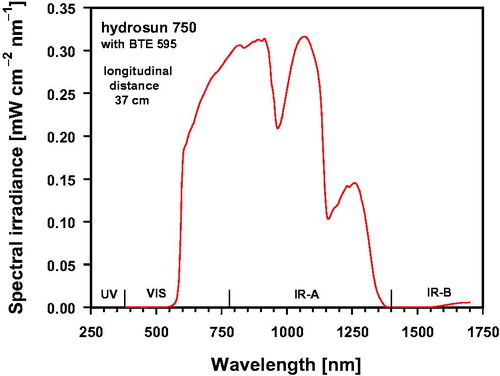
Exposures of the skin of four piglets to wIRA were performed with a wIRA irradiator (type hydrosun 750, hydrosun, Müllheim, Germany) equipped with a cutoff filter of type BTE 595 (BTE, Elsoff, Germany). The distance between the exit window of the irradiator and the skin surface of the piglets was 37 cm. In this setup, the IR-A (780–1400 nm) irradiance was 126.53 mW cm−2 corresponding to 73.09% of the total irradiance (173.12 mW cm−2) ranging from 590 to 1400 nm, and mainly responsible for thermal effects in the tissue. Irradiance at wavelengths >1400 nm (IR-B and IR-C) was about 0.55 mW cm−2 (0.32%), and at wavelengths < 780 nm (visible range) about 46.04 mW cm−2 (26.59%, see ).
Figure 1. Spectral irradiance of the wIRA-irradiator (type: hydrosun 750, hydrosun, Müllheim, Germany) equipped with a cutoff filter (type BTE 595, BTE Elsoff, Germany) as a function of wavelength. Measurements were performed at longitudinal distances between the center of the irradiator exit window and the center of the entrance window of the spectroradiometer of 37 cm. Both windows were parallel to each other.
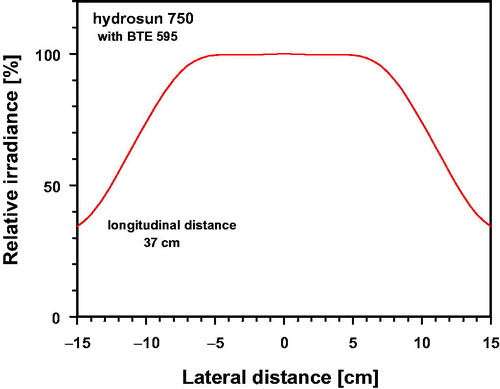
As shown in , incident irradiance differed only insignificantly from ideal horizontal uniformity within a centered circle of 10 cm diameter at a longitudinal distance of 37 cm applied during the skin exposure (deviations ≤ 0.47%).
Figure 2. Relative irradiance (%) as a function of the lateral distance to the center, normalized to the value measured at the center of the irradiated area (longitudinal distance of 37 cm).
Measurements of spectral irradiance were performed using a double-monochromator spectroradiometer (type SPECTRO 320 D, Instrument Systems, Munich, Germany) equipped with an Ulbricht sphere as optical entrance window which was parallel to the radiation exit window of the irradiator. The spectroradiometer was calibrated by the manufacturer before starting the study, whereas offset correction was performed immediately before each measurement.
2.2. Subjects
Invasive in vivo temperature measurements in the skin and subcutis were performed in four piglets (body weights: 15–25 kg). Each piglet was locally irradiated within a circle with a diameter of 10 cm at its upper thigh which was positioned perpendicularly to the incident wIRA-radiation (deviations from ideal planarity ≤1 cm). Before starting the measurements, skin hairs were sheared within the assessed area, and the thicknesses of skin and fat layers were measured with an ultrasound scanner (type: HS-166V with probe No. HCS-87112M/7.5 MHz, Honda Electronics, Toyohashi, Japan).
During irradiation piglets were anesthetized, ventilated to keep respiratory parameters constant and infused with a balanced solution to keep mean arterial blood pressure >50 mm Hg. Body core temperatures were monitored before and throughout the exposures (for details see [Citation19]). Data of individual thicknesses of skin and fat layers as well as of body core temperatures before and after wIRA exposure are listed in .
Table 1. Individual thicknesses of skin and fat layers, and body core temperature of piglets before and immediately after wIRA-irradiation.
2.3. Temperature measurements in superficial tissues
Temperatures were measured simultaneously before, during and after wIRA – irradiation in time intervals of 1 min on the skin surface and within the underlying tissue.
On the skin surface temperatures were assessed using an IR thermometer (type: FLUKE 575, Everett, USA). Temperature measurements within the tissue were performed using fiber probes vertically inserted at different depths (type: PSC-D-N-N-N with 8 Opsens-ProSensModul PSR-G1-N100ST-L and probe type: OTG-M600-10-62ST-3. OPTFE-XN-00PIT-M1, Soliton Laser- und Messtechnik, Gilching, Germany) [Citation19].
Before measurements, offsets of the probes were eliminated by calibration in water with melting ice. In this way, the relative error of the probes was limited to ±0.3 K. According to the manufacturer’s information, resolution of the probes is 0.03 K, and the response time is 10 ms.
The accuracy of the infrared thermometer was verified by comparison with readings of a precision mercury thermometer immersed into homogeneously tempered water. Temperature data of the infrared thermometer measured at the water surface differed by less than ±1.5% within the range of 30–50 °C. For this test, the infrared thermometer was used with an emission coefficient of ε ≈ 0.93, and was set to ε ≈ 0.98 for skin temperature measurements.
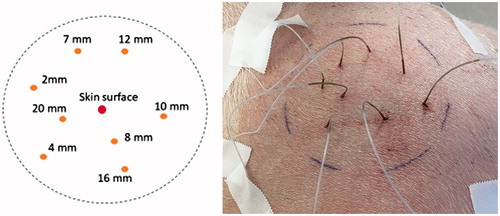
For tissue measurements, the above mentioned 8 fiber probes were distributed within the irradiated skin area at depths of 2, 4, 7, 8, 10, 12, 16 and 20 mm (see ).
Figure 3. Template for sensor positions and tissue depths at which temperature measurements were performed (left), marked target field with inserted temperature sensors (right). The sensors were inserted through catheters (type: SURFLO IV Catheter and SUPERFLASH IV Catheter, TERMURO, Tokyo, Japan).
2.4. Definitions and calculations
To characterize heating properties, the following parameters were calculated according to [Citation1,Citation18,Citation20–26] as a function of exposure time and tissue depth: (a) HR; (b) SAR; (c) effective penetration depth (EPD); (d) TR after 6 min of exposure and in the thermal steady state; (e) thermal effective penetration depth (TEPD); (f) exposure time to reach a TR of 6K (ET6K); (g) 10th, 50th and 90th percentiles of temperature data, and T90, T50 and T10 as temperatures exceeded by 90%, 50% and 10% of temperature data measured during the exposure; (h) 100th percentile and maximum temperature Tmax; (i) tissue depths related to T90 ≥ 40 °C and by T50 > 41 °C; (j) TD expressed as cumulative thermal equivalent minutes at 43 °C (CEM43) calculated for tissue temperatures measured as a function of time within the exposure period; (k) TD expressed as CEM43T90 calculated by using data of T90 upon achieving thermal steady state.
HR was calculated using the temperature increase in the tissue (δT) as a function of depth (d) during the first minute of exposure (δt = 1 min) according to:
(1)
(1)
The SAR was estimated as a function of depth and tissue type according to Wust et al. [Citation25,Citation26] by:
(2)
(2)
Specific heat capacity cp was chosen to cp = 3.662 Ws g−1 K−1 for skin, cp = 2.387 Ws g−1 K−1 for fat, cp = 3.639 Ws g−1 K−1 for muscle tissue, and cp = 3.852 Ws g−1 K−1 for tumor tissue [Citation27–29]. EquationEquation (2)(2)
(2) should be restricted as first estimation of SAR neglecting the effect of superficial perfusion and refers to more accurate models, such as Pennes’ Bioheat equation [Citation25,Citation26,Citation30,Citation31].
EPD is the tissue depth at which SAR-values are decreased to 50% of their maximum. TEPD defines the tissue depth at which the TR after 6 min of exposure has decreased to 50% (value at skin surface = 100%).
CEM43 converts the various time-temperature exposures applied during the treatment into an equivalent exposure time expressed as minutes at the reference temperature of 43 °C. Calculations were performed according to [Citation20–24]:
(3)
(3)
T(t, d) is the temperature measured at time t and at depth d throughout the treatment, and δt the time step, chosen to δt = 1 min. (R = 0.5 for T(t, d) > 43 °C and R = 0.25 for T(t, d) ≤ 43 °C).
In addition, CEM43T90 describes TD as cumulative equivalent minutes at 43 °C exceeded by 90% of temperature data [Citation23,Citation24]. Since CEM43(d) depends on heating-up time during the treatment [Citation21], data of CEM43T90(d) were related to the period of total exposure time after achieving thermal steady state (where tissue temperature depends on tissue depth, but only insignificantly -or not at all- on time), and calculated per step of time (δt = 1 min):
(4)
(4)
Data of HR, SAR, TR, ET6K, CEM43, CEM43T90 and of percentiles calculated for the piglets investigated were presented as mean values and standard deviations using data of each single measurement, and fitted as functions of the tissue depth by using polynominal regression. Assuming normal distribution of measured data, confidence limits of the mean values of parameters X (= percentiles, CEM43 and CEM43T90) were calculated using a significance level of 5%:
(5)
(5)
(Xmean – mean of X, σx – standard deviation of X, n – number of piglets, tc – critical value of Student’s t-distribution (tc = 3.18 for n = 4) [Citation32]).
3. Results and discussion
3.1. Heating rate
Mean values of HR measured in the upper part of the thigh of the piglets between the skin surface and a tissue depth of 5 mm ranged from 1.3 to 1.5 K min−1. Standard deviations were about ±0.5 K min−1. Mean values decreased with increasing tissue depth to about 0.5 K min−1 at 10 mm, and to approx. 0.2 K min−1 at a depth of 20 mm ().
Figure 4. Heating rate assessed in vivo as a function of tissue depth in the upper thigh of piglets exposed to wIRA using an irradiance of 126.5 mW cm−2 (IR-A). Data: mean values and standard deviations. Curve fit using polynominal regression (diamonds, curve 1). Results are compared with published data from preliminary in vivo-measurements in human abdominal wall (stars, [Citation33]), and in recurrent breast cancer (dots, [Citation13,Citation17]) during wIRA skin exposure with 146.2 mW cm−2 (IR-A).
![Figure 4. Heating rate assessed in vivo as a function of tissue depth in the upper thigh of piglets exposed to wIRA using an irradiance of 126.5 mW cm−2 (IR-A). Data: mean values and standard deviations. Curve fit using polynominal regression (diamonds, curve 1). Results are compared with published data from preliminary in vivo-measurements in human abdominal wall (stars, [Citation33]), and in recurrent breast cancer (dots, [Citation13,Citation17]) during wIRA skin exposure with 146.2 mW cm−2 (IR-A).](/cms/asset/aae314df-3f94-4fdc-a5ec-21db8d9a470e/ihyt_a_1792562_f0004_c.jpg)
Using wIRA-heating with an irradiance of 146.2 mW cm−2 (IR-A) as currently recommended for wIRA-hyperthermia of superficial cancers [Citation17], preliminary HR-data communicated earlier for abdominal wall of volunteers ranged at the upper limit of standard deviation determined for the piglets at a tissue depth of 5 mm [Citation33]. For recurrent breast cancer, HR-values were between 1.2 and 1.3 K min−1 up to a depth of 10 mm and about 0.5 K min−1 at 20 mm [Citation13,Citation17].
It should be underlined that in all tissues investigated, i.e. in the thigh of piglets, in human abdominal wall and in recurrent breast cancer, HR was above the threshold of HR ≥1 K min−1 up to a depth of 5 mm as requested by ESHO for appropriate heating [Citation1].
3.2. SAR and EPD
In the thigh of piglets, mean SAR-values were 78–90 mW g−1 at tissue depths <5 mm, 35–20 mW g−1 at 5–10 mm, and 5–10 mW g−1 at depths >10 mm (). Preliminary SAR data published earlier for human abdominal wall were about 110–122 mW g−1 and ranged within the standard deviation of the corresponding data for piglet tissue at a reference depth of 5 mm [Citation33]. So far, limited SAR data calculated for recurrent breast cancer were distinctly higher at 10 mm (78 mW g−1) and 20 mm (28 mW g−1) [Citation13,Citation17].
Figure 5. Absolute (a) and relative values (b) of SAR assessed in vivo as a function of tissue depth in the upper thigh of piglets exposed to wIRA irradiance using 126.5 mW cm−2 (IR-A). Data: mean values and standard deviations. Curve fit using polynominal regression (diamonds, curve 1). Results are compared with published data from preliminary in vivo-measurements in human abdominal wall (stars, [Citation33]), and in recurrent breast cancer (dots, [Citation13,Citation17]) during wIRA skin exposure with 146.2 mW cm−2 (IR-A).
![Figure 5. Absolute (a) and relative values (b) of SAR assessed in vivo as a function of tissue depth in the upper thigh of piglets exposed to wIRA irradiance using 126.5 mW cm−2 (IR-A). Data: mean values and standard deviations. Curve fit using polynominal regression (diamonds, curve 1). Results are compared with published data from preliminary in vivo-measurements in human abdominal wall (stars, [Citation33]), and in recurrent breast cancer (dots, [Citation13,Citation17]) during wIRA skin exposure with 146.2 mW cm−2 (IR-A).](/cms/asset/97a3ddde-d22d-4259-8cd2-4a57703d3164/ihyt_a_1792562_f0005_c.jpg)
Accordingly, EPD, i.e. the tissue depth, at which SAR decreases to 50% of its maximum, reached values of about 7 mm for the thigh of piglets (see ). Comparable data were obtained for human abdominal wall [Citation33]. Due to missing data for tissue depths between 10 and 20 mm, respective data for recurrent breast cancers are not available.
According to these results, all SAR values presented for the thigh of piglets, for human abdominal wall tissue and for recurrent breast cancer are in accordance with the ESHO quality standards for adequate heating requiring values ≥60 mW g−1 at a tissue depth of 5 mm [Citation1].
3.3. TR and TEPD
TRs in the piglet thigh measured after 6 min of wIRA-exposure decreased with increasing tissue depth (). Up to a depth of 5 mm, the mean TR ranged from 4.8 to 5.6 K (with standard deviations up to about ±1.2 K).
Figure 6. Temperature rise measured in vivo as a function of tissue depth in the upper thigh of piglets during wIRA exposure with an irradiance of 126.5 mW cm−2 (IR-A) after 6 min of exposure (a) and after achieving thermal steady state (b). The dotted line indicates the temperature rise TR = 6 K as required by ESHO for adequate heating [Citation1]. Data: mean values and standard deviations (diamonds). Curve fit using polynominal regression. Results are compared with published data from preliminary in vivo-measurements in human abdominal wall exposed to 146.2 mW cm−2 of wIRA (IR-A) during thermal steady state (stars, [Citation33]) (b).
![Figure 6. Temperature rise measured in vivo as a function of tissue depth in the upper thigh of piglets during wIRA exposure with an irradiance of 126.5 mW cm−2 (IR-A) after 6 min of exposure (a) and after achieving thermal steady state (b). The dotted line indicates the temperature rise TR = 6 K as required by ESHO for adequate heating [Citation1]. Data: mean values and standard deviations (diamonds). Curve fit using polynominal regression. Results are compared with published data from preliminary in vivo-measurements in human abdominal wall exposed to 146.2 mW cm−2 of wIRA (IR-A) during thermal steady state (stars, [Citation33]) (b).](/cms/asset/2d5fed8b-b89a-433a-a491-17ea24143056/ihyt_a_1792562_f0006_c.jpg)
TEPD was about 12 mm. The threshold of 6 K, as defined by ESHO for adequate tissue heating, was not reached within the requested time of 6 min [Citation1]. However, compliance with this criterion was achieved at longer heating times (see and ). The time delay was caused by the rapid onset of thermoregulation increasing heat dissipation under in vivo conditions (in contrast to phantoms, where this effect is solely based on thermal conduction with no convection). According to , TR values ≥6 K were measured in the thermal steady state up to tissue depths of about 10 mm in the thigh of piglets, and according to Thomsen et al. [Citation33] at a tissue depth of about 7 mm in the human abdominal wall, whereas related TEPD values were about 16 mm for both tissues.
Figure 7. Exposure time required to increase the tissue temperature by 6 K (ET6K) in the upper thigh of piglets as a function of tissue depth during wIRA-irradiation using an irradiance of 126.5 mW cm−2 (IR-A). Data: mean values and standard deviations. Curve fit using polynominal regression.
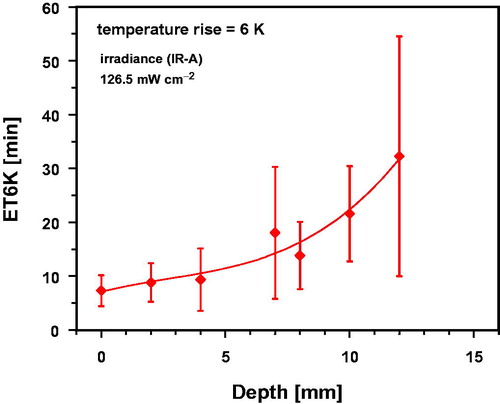
wIRA exposure times to achieve TR = 6 K (ET6K) in the thigh of piglets are shown in as a function of tissue depth. ET6K was approx.10 min up to a depth of 5 mm within the tissue. In deeper tissue layers, ET6K values and standard deviations increased significantly.
3.4. Percentiles of temperature data and values of T90, T50, T10 and Tmax
Calculation of 10th, 50th and 90th percentiles of tissue temperatures in the thigh of piglets was related to two periods of wIRA- exposure times: (i) to the total exposure time of 35 min which included both, temperature increase during heating-up and constant temperatures after achieving thermal steady state (, curve 1), and (ii) to the last 15 min of heat exposure under thermal steady state conditions (, curve 2). This procedure resulted in significantly higher values of percentiles if the heating-up period was excluded in order to prove effectiveness of wIRA- tissue heating under thermal steady state conditions (, curve 2). By definition, T90 results from data of the 10th percentile of tissue temperature, T50 from data of the 50th percentile and T10 from data of the 90th percentile [Citation18]. Accordingly, maximum temperature Tmax resulted from the 100th percentile of data referring to the total exposure time ().
Figure 8. Temperatures T90 (a), T50 (b), T10 (c) and Tmax (d) derived from data of the 10th, 50th, 90th and 100th percentiles of the temperature distributions in the upper thigh of piglets as a function of tissue depth using wIRA with an irradiance of 126.5 mW cm−2. Data were related to a total exposure time of 35 min (curve 1) and to the last 15 min of exposure time upon achieving thermal steady state (curve 2). Broken lines mark the settled thresholds for T90 ≥ 40 °C and T50 ≥ 41 °C [Citation18]. Data: mean values and standard deviations. Dotted lines: upward confidence limit of curve 2 (red) and lower confidence limit of curve 1 (blue), significance level = 5%. Curve fits using polynominal regression.
![Figure 8. Temperatures T90 (a), T50 (b), T10 (c) and Tmax (d) derived from data of the 10th, 50th, 90th and 100th percentiles of the temperature distributions in the upper thigh of piglets as a function of tissue depth using wIRA with an irradiance of 126.5 mW cm−2. Data were related to a total exposure time of 35 min (curve 1) and to the last 15 min of exposure time upon achieving thermal steady state (curve 2). Broken lines mark the settled thresholds for T90 ≥ 40 °C and T50 ≥ 41 °C [Citation18]. Data: mean values and standard deviations. Dotted lines: upward confidence limit of curve 2 (red) and lower confidence limit of curve 1 (blue), significance level = 5%. Curve fits using polynominal regression.](/cms/asset/1a926e50-9d52-43fb-ae1f-de4af2ff5565/ihyt_a_1792562_f0008_c.jpg)
According to the ESHO clinical quality assurance guidelines, adequate hyperthermia of superficial tumors should comply with the following conditions: (i) to enable therapeutic effectiveness, T90 ≥40 °C for 60 min, and T50 ≥41 °C throughout the target volume are required, and (ii) to reduce the risk of thermal damage in normal skin and subcutis, temperature maxima between 43 °C and 45 °C during the entire exposure time and the exposed tissue should not be exceeded [Citation18].
Related to a total exposure time of 35 min, the criterion T90 ≥ 40 °C could not be verified within the tissue, whereas T50 ≥ 41 °C was met up to depths of 10 mm in all piglets (, curve 1). After achieving thermal steady state, on average T90 ≥ 40 °C data were obtained up to a depth of 20 mm (, curve 2), and T50 ≥ 41 °C on average up to 16 mm (, curve 2).
Upon wIRA-heating of superficial recurrences of breast cancers, Notter et al. [Citation14] reported mean tissue temperatures between 42 °C at the skin surface and about 40 °C at a depth of 20 mm after reaching thermal steady state. These data agree with heating states assessed in piglets and which are comparable with tissue temperatures previously reported for various therapeutic applications of wIRA [Citation2–13,Citation15]. However, considering values for standard deviations and of the lower confidence limits, reduction of T90 ≥ 40 °C to depths < 16 mm, and of T50 ≥ 41 °C to depths < 12 mm should be expected due to individual variability in 16% of the cases, and to depths < 12 mm for T90 ≥ 40 °C and to depths <8 mm for T50 ≥ 41 °C in 2.5% of the cases. Thus, agreement with the criterion T90 ≥ 40 °C can be reached within these tissue depths by prolonging the treatment by the time period required for heating-up, whereas compliance with the second criterion is, on average, limited to a tissue depth of 16 mm which may decrease to less than 8 mm in individual cases.
Heating maxima were characterized by values of T10 and Tmax, depending on tissue depth (). After achieving thermal steady state, mean values of T10 and Tmax exceeded the temperature level of 43 °C at depths up to 10 mm, and reached values of T10 ≈ 44.1 ± 1.2 °C () and of Tmax ≈ 44.1 ± 1.2 °C () at a depth of 4 mm. In contrast, values at the skin surface remained at T10 ≈ 43.6 ± 0.6 °C () and Tmax ≈ 43.8 ± 0.7 °C, respectively (). Tissue heating at these temperatures may cause irreversible epidermal injury and burning in both porcine and human skin if critical exposure times were exceeded. Time-temperature thresholds that may cause chronic damages in normal human and porcine skin, fat and muscle tissues are provided in [Citation34–39], and for scarred or fibrotic superficial tissues of pretreated patients in [Citation40–43].
Based on temperature data in the piglets assessed in constant time steps of 1 min, differences between Tmax, T10, T50 and T90 measured during the thermal steady state reflect temporal fluctuations of the temperature within this time, e.g. 90% of T10 data were lower than depicted in (curve 2), and 10% of T90 data lower than in (curve 2). Therefore, due to temperature measurements for only about 20 min after achieving thermal steady state, calculated values of T10 and Tmax only provide a limited reliability to realistically evaluate the risk of side effects. This should be reserved to measurements of equivalent time periods as used in therapeutic applications to detect possible trends in tissue temperature after the first onset of thermoregulation due to thermal responses over longer time periods.
3.5. CEM43 and CEM43T90
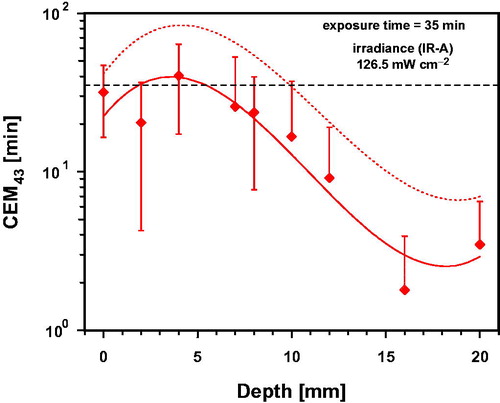
Data for CEM43 calculated from wIRA-exposure of individual piglets during a total exposure time of 35 min depended on (i) tissue depth, (ii) temperature increase during heating-up and (iii) temporal constancy of temperature after achieving the thermal steady state (). Up to a tissue depth of about 8 mm, mean values and standard deviations of CEM43 ranged between 20.4 ± 16.2 min and 40.4 ± 23.1 min (mean: 27.6 min corresponding to about 78.9% of the reference time of 35 min at 43 °C). In deeper tissue layers, mean values of CEM43 distinctly decreased to about 47.4% at 10 mm and to approx. 0.05% at 16 mm. The limits of the confidence interval exceeded the limits of the standard deviation by a factor of 1.59, i.e. values of CEM43 should be expected in 5% of cases which decrease to about 0 min (not shown in ) at depths up to 20 mm, and which increase at a tissue depth of 4 mm up to about 77 min ().
Figure 9. Thermal dose expressed as cumulative equivalent minutes at 43 °C (CEM43) in the thigh of piglets as a function of tissue depth after a total of 35 min of wIRA-exposure with an irradiance of 126.5 mW cm−2. Data: mean values and standard deviations. Broken line: upward confidence limit, significance level = 5%. Curve fit using polynominal regression.
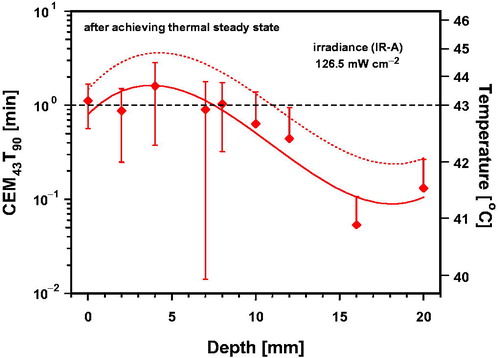
In contrast, CEM43T90 was calculated taking into consideration time intervals of 1 min and by using data of T90 measured for each piglet after achieving thermal steady state. This allowed specification of correlated tissue temperatures. As shown in , CEM43T90 varied at depths ≤8 mm between 0.87 ± 0.63 min and 1.61 ± 1.2 min with a mean value of 1.10 min, i.e. 10% above reference time, whereas values decreased on average to about 63.5% at a depth of 10 mm, and to about 5.3% at 16 mm. The mean value of CEM43T90 ≈ 1.10 min is correlated with a temperature of 43.1 °C, whereas values of 0.87 and 1.61 min correlate with steady state temperatures of 42.9 °C and 43.7 °C, i.e. increasing of temperature by 0.4 K caused an increase of about 74% of TD. Moreover, the lower confidence limit of CEM43T90 was about 0 min (not shown in ), whereas the upper limit reached a maximum value of 3.48 min at a depth of 4 mm, correlated with a heating-up to 44.8 °C.
Figure 10. Thermal dose expressed as cumulative equivalent minutes at 43 °C exceeded by 90% of temperature data (CEM43T90) in the upper part of the thigh of piglets as a function of tissue depth during 1 min of wIRA-exposure with 126.5 mW cm−2 and correlated temperature after achieving thermal steady state. Data: mean values and standard deviations. Dotted line: upward confidence limit, significance level = 5%. Curve fit using polynominal regression.
Applicable TDs are limited by an increasing risk of thermal toxicity and depends on the tissue type [Citation34–38,Citation40–43], as well as on individual factors affecting local heat balance such as metabolic heat production or thermoregulation as shown in and . These factors essentially influence the resulting difference between minimum and maximum of temperature within the irradiated tissue. Thus, the data in and exemplarily show that therapeutic TDs (as required for special indications) may not be achievable if a hot spot outside the target limits the heating.
Comparing the data of both parameters in due consideration of their reference times, it is apparent that CEM43T90 exceeds CEM43 on average by a factor of about 1.39. This supports the recommendation to prolong wIRA-HT treatments by the time period required for heating-up. However, significant standard deviations of data in and indicate that individual variability should be taken into account.
According to van Rhoon, the clinical relevance of both, the CEM43 and CEM43T90 is limited [Citation44]. In addition, it should be considered that significant deviations from the reference temperature of 43 °C result in significant changes in thermal reactions within the tissue. In these cases, the applicability of the Bunsen-Roscoe Law of Reciprocity is not justified to evaluate TDs regarding their therapeutic equivalence [Citation45]. Interpretations of CEM43 and CEM43T90, calculated by using EquationEquations (3)(3)
(3) and Equation(4)
(4)
(4) should, therefore, be consequently restricted to the range between the threshold temperature of the therapeutic effect desired up to the threshold temperature of unwanted side effects. Only in this case, the product of temperature and exposure time results in biologic equivalence of TD. For examples of time-temperature thresholds of different chronic damages in various tissues see [Citation34–38,Citation40–43]. Relations between threshold temperatures and minimum exposure times versus CEM43 were reviewed for different biologic effects by Miller and Ziskin [Citation46] and van Rhoon et al. [Citation47] for tumor treatment using free and thermo-sensitive liposomes (TSL)-based thermochemotherapy.
As a consequence, the applicability of calculated data in and is limited to temperatures above the threshold temperature of the desired effect. Therefore, calculation of CEM43 was subject to a further flaw due to consideration of temperatures below any relevant thresholds measured during heating-up of the tissue, which contributed to calculated values without biologic rationale and increased uncertainty of CEM43. In contrast, CEM43T90 calculated for thermal steady state enabled a more realistic correlation with relevant tissue temperatures. According to , mean values of CEM43T90 were ≥0.0625 min at depths up to 20 mm and correlated with mean tissue temperatures ≥41 °C. Values of CEM43T90 ≥0.25 min correlated with tissue temperatures ≥42 °C were, on average, assessed up to a tissue depth of 12 mm, and up to 20 mm, considering the upper confidence limit.
3.6. Summary
provides a summary of data measured under in vivo conditions in the thigh of piglets during wIRA-irradiation, referring to quality standards for adequate heating as requested by ESHO [Citation1,Citation18] and others [Citation20–26]. Most of the assessed parameters (HR, SAR, TR, EPD, TEPD) refer to a muscle-tissue equivalent phantom without any consideration of effects due to thermoregulation, metabolic energy production and other individual factors affecting heating of the skin and superficial tissues under in vivo conditions. These effects resulted in significant standard deviations of the mean values in the piglets as shown in , and in delayed achievement of thermal steady states regarding TR, TEPD and clinical parameters such as T90, T50, CEM43 and CEM43T90.
Table 2. Mean in vivo-data measured in superficial tissues of piglets exposed to a wIRA-irradiance of 126.5 mW cm−2 (IR-A) with reference to criteria for adequate tissue heating [Citation1, Citation18].
Considering these data, we suggest (i) to adapt the clinical quality assurance procedure to prove therapeutic effectiveness of wIRA-hyperthermia accordingly, and (ii) to eventually prolong treatment times to ensure clinically relevant hyperthermia-levels.
4. Conclusions
HR- and SAR-data assessed under in vivo conditions during the first minute of wIRA-exposure in the upper part of the thigh of piglets are in full accordance with the standards for adequate tissue heating [Citation1]. They are comparable with in vivo SAR-data of 81 mW g−1 in human subcutis and of 29 mW g−1 in recurrent breast cancer at a depth of 20 mm during wIRA treatment as previously reported by Vaupel et al. [Citation17].
Since skin perfusion is a major effector protecting the body from thermal discomfort/stress, rapid onset of thermoregulation after starting irradiation in vivo resulted in a delayed TR in the tissue. At a reference depth of 5 mm, the threshold of TR = 6 K was achieved after about 10 min of wIRA-exposure in the piglets, instead of after 6 min as required for phantoms by ESHO [Citation1]. Maximum TR-values were measured during thermal steady state and were 7–8 K at the reference depth of 5 mm. If these time delays are also valid for wIRA-irradiation of humans in the clinical setting, hyperthermia treatments (39–43 °C) should be adequately prolonged by the time required for heating-up to ensure adequate heating.
According to clinical requirements for quality assurance of ESHO, heating devices for superficial hyperthermia should reach T90 ≥40 °C for 60 min, and T50 ≥41 °C within the entire target volume [Citation18]. Calculation of percentiles based on temperature data measured under thermal steady state conditions confirmed that wIRA-tissue heating on average meets both criteria up to depths of 20 mm for T90 ≥ 40 °C and up to 16 mm for T50 ≥ 41 °C through prolonged exposure times.
It has been shown that determination of thermal equivalent doses should exclude ineffective temperatures below the thresholds of desired therapeutic effects due to the non-applicability of the Bunsen-Roscoe Law of Reciprocity. Thus, it is proposed to start the determination of both CEM43 and CEM43T90 after exceeding of relevant threshold temperatures during the heating-up. Mean values of CEM43T90 calculated during thermal steady state were about 1.10 min up to a depth of 8 mm, ≥0.25 min up to 12 mm and ≥0.0625 min up to 20 mm. Correlated tissue temperatures were 43 °C, 42 °C and 41 °C.
Data provided in this in vivo-study thus clearly confirm the potential of wIRA-HT for the treatment of superficial cancers in the clinical setting. They also show the need for clinically based quality assurance of heating devices for superficial hyperthermia to prove their effectiveness in a realistic way.
Prolongation of the treatment time by the period needed for heating-up is required to reach thermal steady state and to ensure therapeutically required tissue temperatures during wIRA-hyperthermia. For piglets, heating-up time ranged between 10 and 20 min. However, the skin and fat layers of human patients are usually thinner compared to piglets. Moreover, pigs are unable to dissipate heat by sweating. Therefore, more human data assessed in superficial tissues under in vivo conditions are needed to verify transferability of results determined in this study for piglets although comparable data in humans have already been reported [Citation2–15]. For clinical application, additional consideration of significant influencing factors is recommended in order to enable adequate tissue heating of patients, e.g. individual differences of the kinetics of heating-up during the exposure, initial tissue temperature and metabolic heat production, regulations of blood perfusion in the body shell, and thermoregulation in case of whole-body application. For clarification, invasive thermometry is recommended to ensure therapeutically required heating states, and to prevent hot spots and burns within the heated tissue [Citation19,Citation34].
Ethics statement
Ethical approval for the experiments was obtained from Veterinäramt Kanton Zürich (Ref.: ZH180/15). Date of approval: February 9, 2016.
Disclosure statement
The authors declare that the research was conducted in the absence of any commercial of financial relationship that could be constructed as a potential conflict of interest.
Additional information
Funding
References
- Dobsicek Trefna H, Crezee J, Schmidt M, et al. Quality assurance guidelines for superficial hyperthermia clinical trials: II. Technical requirements for heating devices. Strahlenther Onkol. 2017;193(5):351–366.
- Vaupel P, Kelleher DK, Krüger W. Water-filtered infrared-A-radiation: a novel technique to heat superficial tumors. Strahlenther Onkol. 1992;168(11):633–639.
- Vaupel P, Kelleher DK, Krüger W. Wassergefilterte Infrarot-A-Strahlung: Eine neue Technik zur lokalen Hyperthermie oberflächlich liegender Tumoren. In: Vaupel P, Krüger W, editors. Wärmetherapie mit wassergefilterter Infrarot-A-Strahlung. Stuttgart: Hippokrates; 1992. p. 57–62.
- Kelleher DK, Engel T, Vaupel P. Changes in microregional perfusion, oxygenation, ATP and lactate distribution in subcutaneous rat tumours upon water-filtered IR-A hyperthermia. Int J Hyperthermia. 1995;11(2):241–255.
- Thews O, Li Y, Kelleher DK, et al. Microcirculatory functions, tissue oxygenation, microregional redox status and ATP distribution in tumors upon localized infrared-A-hyperthermia at 42 °C. Adv Exp Med Biol. 2003;530:237–247.
- Kelleher DK, Thews O, Rzeznik J, et al. Water-filtered infrared-A radiation: a novel technique for localized hyperthermia in combination with bacteriochlorophyll-based photodynamic therapy. Int J Hyperthermia. 1999;15(6):467–474.
- Kelleher DK, Thews O, Scherz A, et al. Combined hyperthermia and chlorophyll-based photodynamic therapy: tumour growth and metabolic microenvironment. Br J Cancer. 2003;89(12):2333–2339.
- Kelleher DK, Bastian J, Thews O, et al. Enhanced effects of aminolaevulinic acid-based photodynamic therapy through local hyperthermia in rat tumours. Br J Cancer. 2003;89(2):405–411.
- Zywietz F. Infrarot-A-Hyperthermie als strahlensensibilisierendes Agens bei Bestrahlung oberflächennah liegender Tumoren: Tierexperimentelle Untersuchungen. In: Vaupel P, Krüger W, editors. Wärmetherapie mit wassergefilterter Infrarot-A-Strahlung. Stuttgart: Hippokrates; 1995. p. 113–126.
- Morita K, Zywietz F, Kakinuma K, et al. Efficacy of doxorubicin thermosensitive liposomes (40 °C) and local hyperthermia on rat rhabdomyosarcoma. Oncol Rep. 2008;20(2):365–372.
- Seegenschmiedt MH. Erfahrungen mit einem Infrarot-A-Hyperthermie-Projektor mit Wasserfilter zur lokal-perkutanen Hyperthermie kombiniert mit Radiotherapie bei oberflächennahen Tumoren. In: Vaupel P, Krüger W, editors. Wärmetherapie mit wassergefilterter Infrarotstrahlung. Stuttgart: Hippokrates; 1992. p. 63–76.
- Seegenschmiedt MH, Klautke G, Walther E, et al. Water-filtered infrared-A-hyperthermia combined with radiotherapy for advanced and recurrent tumours. Strahlenther Onkol. 1996;172(9):475–484.
- Notter M, Piazena H, Vaupel P. Hypofractionated re-irradiation of large-sized recurrent breast cancer with thermography-controlled, contact-free water-filtered infra-red-A hyperthermia: a retrospective study of 73 patients. Int J Hyperthermia. 2017;33(2):227–236.
- Notter M, Thomsen A, Nitsche M, et al. Combined wIRA-hyperthermia and hypofractionated re-irradiation in the treatment of locally recurrent breast cancer: evaluation of therapeutic outcome based on a novel size classification. Cancers. 2020;12(3):606.
- Notter M, Münch K, Vaupel P. Re-irradiation and wIRA-hyperthermia for superficial widespread breast cancer recurrences: an update. Proceedings of the 31st Annual Meeting of the European Society for Hyperthermic Oncology (ESHO); June 21–23; Athens; 2017
- Piazena H, Meffert H, Uebelhack R. Physical and photobiological basics for prophylactic and therapeutic application of infrared radiation. Akt Dermatol. 2014;40:335–339.
- Vaupel P, Piazena H, Müller W, et al. Biophysical and photobiological basics of water-filtered infrared-A hyperthermia of superficial tumors. Int J Hyperthermia. 2018;35(1):26–36.
- Trefná HD, Crezee H, Schmidt M, et al. Quality assurance guidelines for superficial hyperthermia clinical trials: I. Clinical requirements. Int J Hyperthermia. 2017;33(4):471–482.
- Piazena H, Müller W, Pendl W, et al. Thermal field formation during wIRA-hyperthermia: temperature measurements in skin and subcutis of piglets as a basis for thermotherapy of superficial tumors and local skin infections caused by thermosensitive microbial pathogens. Int J Hyperthermia. 2019;36:938–952.
- Sherar M, Liu F-F, Pintilie M, et al. Relationship between thermal dose and outcome in thermoradiotherapy treatments for superficial recurrences of breast cancer: data from phase III trial. Int J Radiat Oncol Biol Phys. 1997;39(2):371–380.
- Sapareto AS, Dewey WC. Thermal dose determination in cancer therapy. Int J Radiat Oncol Biol Phys. 1984;10(6):787–800.
- Ohguri T, Harima Y, Imada H, et al. Relationships between thermal dose parameters and the efficacy of definitive chemotherapy plus regional hyperthermia in the treatment of locally advanced cervical cancer: data from a multicentre randomised clinical trial. Int J Hyperthermia. 2018;34(4):461–468.
- Jones EL, Oleson JR, Prosnitz LR, et al. Randomized trial of hyperthermia and radiation for superficial tumors. J Clin Oncol. 2005;23(13):3079–3085.
- Lee S-Y, Szigeti GP, Szasz AM. Oncological hyperthermia: the correct dosing in clinical applications. Int J Oncol. 2019;54(2):627–643.
- Wust P, Stahl H, Löffel J, et al. Clinical, physiological and anatomical determinants for radiofrequency hyperthermia. Int J Hyperthermia. 1995;11(2):151–167.
- Wust P. Thermotherapy in oncology. Bremen: Uni-Med Science; 2017.
- Van Leeuwen GM, Lagendijk JJ, Van Leersum BJ, et al. Calculation of change in brain temperatures due to exposure to a mobile phone. Phys Med Biol. 1999;44(10):2367–2379.
- Cetingül MP, Herman C. A heat transfer model of skin tissue for the detection of lesions: sensitivity analysis. Phys Med Biol. 2010;55(19):5933–5951.
- Chanmugam A, Hatwar R, Herman C. Thermal analysis of cancerous breast model. Int Mech Eng Congress Expo. 2012;2012:134–143.
- Pennes HH. Analysis of tissue and arterial blood temperatures in the resting human forearm. J Appl Physiol. 1948;1(2):93–122.
- Chou CK. Use of heating rate and specific absorption rate in the hyperthermia clinic. Int J Hyperthermia. 1990;6(2):367–370.
- Gaus W, Muche R. Medizinische Statistik. Stuttgart (Germany): Schattauer Verlag; 2014.
- Thomsen AR, Saalmann MR, Nicolay NH, et al. Monitoring of key parameters during thermography-controlled wIRA-hyperthermia in the treatment of superficial tumors. Proceedings of the 33rd Annual Meeting, European Society for Hyperthermic Oncology (ESHO); May 22–24; Wars; 2019.
- Moritz AR, Henriques FC. Studies of thermal injury. II. The relative importance of time and surface temperature in the causation of cutaneous burns. Am J Pathol. 1947;23(5):695–720.
- Dewhirst MW, Viglianti BL, Lora-Michiels M, et al. Basic principles of thermal dosimetry and thermal thresholds for tissue damage from hyperthermia. Int J Hyperthermia. 2003;19(3):267–294.
- Viglianti BL, Dewhirst MW, Abraham JP, et al. Rationalization of thermal injury quantification methods: application to skin burns. Burns. 2014;40(5):896–902.
- Dewey WC. Arrhenius relationships from the molecule and cell to the clinic. Int J Hyperthermia. 1994;10(4):457–483.
- Yarmolenko PS, Moon EJ, Landon C, et al. Thresholds for thermal damage to normal tissues: an update. Int J Hyperthermia. 2011;27(4):320–343.
- DIN 33403-2. Klima am Arbeitsplatz und in der Arbeitsumgebung - Teil 2: Einfluss des Klimas auf den Wärmehaushalt des Menschen. Berlin: Beuth; 2000.
- Bakker A, Kolff MW, Holman R, et al. Thermal skin damage during reirradiation and hyperthermia is time-temperature dependent. Int J Radiat Oncol Biol Phys. 2017;98(2):392–399.
- Bakker A, van der Zee J, van Tienhoven G, et al. Temperature and thermal dose during radiotherapy and hyperthermia for recurrent breast cancer are related to clinical outcome and thermal toxicity: a systemic review. Int J Hyperthermia. 2019;36(1):1023–1038.
- Linthorst M, van Geel AN, Baaijens M, et al. Re-irradiation and hyperthermia after surgery for recurrent breast cancer. Radiother Oncol. 2013;109(2):188–193.
- Lindholm CE, Kjellén E, Nilsson P, et al. Prognostic factors for tumour response and skin damage to combined radiotherapy and hyperthermia in superficial recurrent breast carcinomas. Int J Hyperthermia. 1995;11(3):337–355.
- van Rhoon GC. Is CEM43 still a relevant thermal dose parameter for hyperthermia treatment monitoring? Int J Hyperthermia. 2016;32(1):50–62.
- Piazena H, Kelleher DK. Effects of infrared-A irradiation on skin: discrepancies in published data highlight the need for an exact consideration of physical and photobiological laws and appropriate experimental settings. Photochem Photobiol. 2010;86(3):687–705.
- Miller MW, Ziskin MC. Biological consequences of hyperthermia. Ultrasound Med Biol. 1989;15(8):707–722.
- van Rhoon GC, Franckena M, ten Hagen TLM. A moderate thermal dose is sufficient for effective free and TSL based thermochemotherapy. Adv Drug Deliv Rev. 2020. DOI:10.1016/j.addr.2020.03.006