
 ?Mathematical formulae have been encoded as MathML and are displayed in this HTML version using MathJax in order to improve their display. Uncheck the box to turn MathJax off. This feature requires Javascript. Click on a formula to zoom.
Abstract
Purpose
Noninvasive thermometry during magnetic nanoparticle hyperthermia (MNH) remains a challenge. Our pilot study proposes a methodology to determine the noninvasive intratumoral thermal dose during MNH in the subcutaneous tumor model.
Methods
Two groups of Ehrlich bearing-mice with solid and subcutaneous carcinoma, a control group (n = 6), and a MNH treated group (n = 4) were investigated. Histopathology was used to evaluate the percentage of non-viable lesions in the tumor. MNH was performed at 301 kHz and 17.5 kA.m−1, using a multifunctional nanocarrier. Surface temperature measurements were obtained using an infrared camera, where an ROI with 750 pixels was used for comparison with computer simulations. Realistic simulations of the bioheat equation were obtained by combining histopathology intratumoral lesion information and surface temperature agreement of at least 50% of the pixel’s temperature data calculated and measured at the surface.
Results
One animal of the MNH group showed tumor recurrence, while two others showed complete tumor remission (monitored for 585 days). Sensitivity analysis of the simulation parameters indicated low tumor blood perfusion. Numerical simulations indicated, for the animals with complete remission, an irreversible tissue injury of 91 ± 5% and 100%, while the one with recurrence had a lower value, 56 ± 7%. The computer simulations also revealed the in vivo heat efficiency of the nanocarrier.
Conclusion
A new methodology for determining noninvasively the three-dimensional intratumoral thermal dose during MNH was developed. The method demonstrates the potential for predicting the long-term preclinical outcome of animals treated with MNH.
Introduction
Magnetic nanoparticle hyperthermia (MNH) is an innovative cancer therapy that holds the European CE certificate and thus official approval to treat brain tumors when combined with external beam radiotherapy [Citation1–3]. After 10 years since approval, the use in the clinic of this method is still limited and has not been applied to other types of tumors. A possible reason for this comes from the fact that MNH cannot benefit from the MRI-based thermometry, since the high DC magnetic field in MRI systems inhibits heat generation [Citation4,Citation5]. Therefore, different from other heat generation techniques, e.g., high-intensity focused ultrasound (HIFU) or photo-thermal therapy (PTT), there is still an important challenge for MNH technique to overcome: the noninvasive determination of the three-dimension intratumoral thermal dose.
So far, clinical MNH thermometry has been achieved using a few fiber optic thermometers that are inserted into the tumor of the patient. The procedure is minimally invasive, but only monitors temperature locally at a few positions in the tumor. Therefore, heat deposition is not adequately determined in order to affect the clinical treatment and outcome. Nevertheless, MNH shows great potential as a single platform for tumor ablation, where heat delivery plays a role and not necessarily needs to be combined with another standard therapy. The expectation for such heat therapy applications is beyond typical ablation technologies since the nanoparticles are also able to interact with the immunological system in a complex manner [Citation6–8]. Indeed, there are several interesting heat-induced immunological phenomena reported by MNH [Citation9–11]. To explore these applications, it is necessary not only to improve the efficiency of magnetic nano-heaters at the low-field condition (within the safety criteria for clinical applications [Citation12–14]), but also develop strategies for noninvasive three-dimensional thermometry [Citation15].
Since MRI thermometry is not compatible with MNH, new strategies are under investigation, namely ultrasound thermometry (UST), luminescent nanothermometry (LNT) and magnetic nanothermometry (MNT), but none of them has yet achieved application in the clinic [Citation16–18]. Another modality that appears in several preclinical studies is infrared thermometry (IRT) that monitors the surface temperature during in vivo MNH [Citation19–22]. This kind of thermometry, out of the context of any kind of intraoperative thermal imaging during a surgical procedure [Citation23,Citation24], has the limitation of being useful only for superficial tumors (close to/or at the surface of the skin) and needs to be properly employed, or else it may result in gross errors in determining the temperature of a region of interest (ROI). First, this kind of thermometry is strongly dependent on the angle (θ) formed between the direction of the camera's objective lens and the normal direction of the imaged surface, and this is due to the spectral-directional dependence of the skin's thermal emissivity [Citation25]. Second, the error in determining the apparent temperature of a curved surface, in addition to the effects of emissivity, is also strongly dependent on the difference between the surface temperature and the ambient temperature [Citation26]. Third, the real intratumoral temperature achieved during MNH, that is a function of position and time, would not be reported but, instead, the surface temperature due to transport of heat from the interior of the tumor to the surface through different tissue layers. Tumors that appear far away from the surface cannot get any benefit from this technology, since heat transport affects the temperature at the organs interface.
Indeed, defining the temperature error as the difference between the surface real temperature
and the apparent temperature measured with the IR Cam
(which is
-dependent), Rodrigues et al. demonstrated that, upon increasing this angle, the experimental error can reach
for θ = 60° during in vivo MNH [Citation27]. Hence, it is of crucial importance to adequately design the in vivo MNH experiment. Despite this, for preclinical trials, xenograft solid and subcutaneous tumor models can benefit from such technology, if properly used. IRT has the advantage of being noninvasive and more importantly, each pixel, at the surface, can be treated as a thermometer. Therefore, instead of just measuring a few points in space, if properly used, a huge ROI can be analyzed.
One of the goals of the present report is related to its methodological aspects, while our overarching objective, although limited by carrying out an MNH pilot in vivo study in a small number of animals (n = 4), is to determine the fundamentals (with proof-of-concept demonstration) for the complete theoretical and experimental development of reliable treatment planning for subcutaneous tumors via MNH therapy. This is achieved by demonstrating the effectiveness of a new theranostic nanocarrier for both in situ therapeutic heat delivery as well as in vivo intratumoral imaging of the nano-heaters location. Also, by combining three safe in vivo imaging techniques, to provide more realistic computational modeling abilities to predict tumoral recurrence (or complete remission (CR)) following MNH therapy in a murine tumor model.
To achieve this goal, we propose to combine IRT with heat transport numerical simulations, and the solution to this problem involves the application of several techniques. First, the digital photogrammetry (PG) is used to obtain the exact shape of the animal’s surface submitted to the MNH procedure. Second, the 3D geometry of the tumor is reconstructed from two-dimensional ultrasound (US) images by a technique known as sensorless freehand 3D US reconstruction [Citation28]. Finally, to extract information about the location of the nano-heaters, we developed a multifunctional nanocarrier that contains fluorescent tracers in the near-infrared (NIR) region coupled to the nanoparticles (namely MalbIR), so that their location in the tumor can be extracted using the fluorescence molecular tomography (FMT) technique.
Moreover, to verify if the numerically calculated intratumoral thermal damage parameter adequately describes our pilot data set for the tumor growth response of a few animals that underwent 30 min of MNH, a comparison was made between apoptotic/necrotic regions identified in one of the treated tumors (by histopathological analysis after heating) and the corresponding computer simulations. This allowed us to identify critical conditions for irreversible thermal injuries in the Ehrlich solid and subcutaneous carcinoma model. Essentially, the apoptotic/necrotic regions of the tumor were determined using histological sections, and through them it was possible to determine the percentage of apoptotic/necrotic (irreversible) lesions in the tumor of the animal that underwent MNH. On the other hand, through computer simulations and the concept of thermal damage, we obtained the heat dose for each voxel of the reconstructed tumor shape and established if the lesion was irreversible or not.
The steps for the success of this strategy included the development of some experimental and theoretical methodologies that allowed: (i) to obtain an accurate description of the spatial distribution of the nano-heaters after intratumoral injection; (ii) the reconstruction of quite realistic geometries where Pennes's bioheat transfer equation could be numerically solved, i.e., the tumor volume in all its complexity and off-target surrounding structures, including the animal’s body shape, since in our experiments, the skin surface temperature measurements are a quite important reference; (iii) to take into account specific non-linear modeling for tumor blood perfusion rate, since this parameter depends on temperature; (iv) inside the reconstructed geometry of the tumors volume, build a voxel-dependent heat source distribution function to model the nano-heaters intratumoral power generation; (v) the development of a tissue thermal damage escalation in order to find thresholds that could be truly associated with the long-term tumor response after the in vivo MNH procedure.
After choosing the above-mentioned algorithm, two concepts must be properly introduced, in order to make clear to the reader which kind of mathematical problem we are dealing with here. By definition, direct heat transfer problems (DHTPs) belong to the class of well-posed mathematical problems where the causes are expressed and the effect is determined. Hence, the main goal of the solution of a DHTP is to predict (or to recover) the temperature field in the medium/body where the heat transport takes place [Citation29].
On the other hand, for the inverse heat transfer problems (IHTPs) the effect is given (e.g., the temperature field), and the causes are estimated. The solution of IHTPs relies on temperature and/or heat flux measurements at some specified section of the medium/body that might be used as the input data for the approximate calculation of the unknown causal thermophysical parameters. For example, to be able to determine the heat source spatial distribution that promotes an observed heat transport effect, but with few/or no prior information about boundary and initial conditions of the system (i.e., an ill-posed mathematical problem) [Citation29].
Strategies that explore this kind of inverse reconstruction algorithm have been proved to be valuable for extracting quantitative information in the scenarios of estimating size, location (depth under the skin) and blood perfusion (as an indicator of the tumor growth rate) for cancerous breast injuries using only the skin surface temperature data [Citation30–36]. Among several works in the literature, one can highlight the important contributions of Herman who have developed accurate methods for the early detection of melanoma [Citation37,Citation38] and breast cancer [Citation39–41] using a technique of transient skin temperature measurements by IR thermography and applying the Levenberg–Marquardt method [Citation40].
In this pilot study, we develop a methodological strategy that allowed us to numerically calculate the temperature field within the tumor during MNH. Several parameters for the simulations are extracted/assumed from the literature, as discussed in the text. But a sensitivity and uncertainty analysis is also included to better determine some important simulation parameters. Anyway, since the MNH heat efficiency (SLP – specific loss power) of the nanoparticles inside the tumor is not known (because particle-particle and particle-tissue interactions might affect SLP [Citation42,Citation43]), we combine this DHTP with surface temperature measurements during MNH. More specifically, numerical simulations are compared with IRT surface temperature data, at the stationary regime, in a particular time point (30 min of MNH). The objective of this method is to determine the best SLP value that represents the in vivo case. Note that although this approach seems similar to IHTP, there are some important differences since the nano-heaters intratumoral location, and the tumor and the animal’s surface body geometry are known, i.e., were determined experimentally through PG, US and FMT. Indeed, the 3D intratumoral nano-heaters distribution determined from FMT was only possible by the development of a multifunctional NIR magnetic nanocarrier, which is an important contribution of the present report because of its potential for MNH in clinically relevant conditions. Further, the method is only successful after taking into account histopathology data analysis, which permits the calibration of the tumor irreversible damage parameter in the simulation.
The pilot animal study presented here also shows the potential for predicting the long-term preclinical outcome of animals treated with MNH therapy. Furthermore, it might be extremely useful for future MNH applications, for instance, heat-induced immunological response studies, since from this method one might actually estimate noninvasively the three-dimensional intratumoral thermal dose. This approach is very different from the previously reported MNH studies, since they determined the local thermal dose using invasive fiber optic thermometers.
Methods
Tumor model and animal manipulation protocols
Swiss mice were maintained under standard laboratory conditions (temperature 22–25 °C with a dark/light cycle, 12/12 h), allowed free access to a standard dry pellet diet and water ad libitum, and acclimatized to laboratory conditions for five days before the start of the experiments. All the procedures described in this current work were reviewed and approved by the ethics committee for animal care at the Federal University of Goiás (CEUA/UFG) (protocol 098/14). In order to study the effects of in vivo MNH, 6–8 week old Swiss albino male mice, with body weight ranging from 35 to 40 g, were used for animal experimentation. The Ehrlich bearing-mice with solid and subcutaneous carcinoma were prepared as follows. Seven days after cell inoculation, the peritoneal fluid of a first animal (Ehrlich Ascites Carcinoma bearing mouse) was aspirated, the cells were washed in sterile PBS and an aliquot of the cell suspension was put in trypan blue 2% (m/v) (Sigma, St. Louis, MO) and quantified by LunaTM automated cell counter (Logos, Biosystems, Annandale, VA). Only cell dilutions with ≥90% of viable cells were used for in vivo study. After that, we used the previously prepared Ehrlich ascites cells dilution to induce solid tumors in a new group of healthy male mice (n = 10): at day 0, they were inoculated subcutaneously (4 mm deep) in the cervical region with 2 × 10⁷ viable cells.
From the time the tumor became palpable, daily measurements of the tumor major () and minor (
) axis, for each animal, were performed with a digital caliper. The tumor volume (in mm3) was daily calculated from the following equation:
For the tumor cell inoculation, intratumoral magnetic nanocarrier MalbIR injection, PG and in vivo MNH experiments, the animals were anesthetized with a solution of 0.2 ml/100 g of body weight containing ketamine (100 mg.ml−1) (Dopalen, Vetbrands Brasil LTDA, Jacarei, Brazil) and xylazine (100 mg.ml−1) (Dorcipec, Vallée S/A, São Paulo, Brazil). The same anesthesia procedure was used for animal sacrifice by cervical dislocation. For US, FMT imaging and the hair removal procedures, they were sedated only with isofluorane (starting with a 3% induction dose and maintaining at 1%) combining with oxygen flow at a rate of 1 l.min−1. The depilation of animals was always done using depilatory creams (Veet-Reckitt, Benckiser, Hull, UK) [Citation44].
Synthesis of the theranostic nanocarrier
The nanocarriers, that were specifically designed for this in vivo pilot study, consisted of manganese ferrite (MnFe2O4) nanoparticles surface-coated with bovine serum albumin (BSA) that contained molecules of IR-780 iodide coupled to the protein, a NIR fluorescent dye [Citation45]. We named this theranostic nanocomposite MalbIR, i.e., an acronym for magnetic nanoparticles + albumin + IR-780. Details of nanoparticle synthesis can be found elsewhere [Citation45,Citation46].
MalbIR physical characterization
The MalbIR size distribution was determined by Nanoparticle Tracking Analysis (NTA) using a NanoSight NS500 equipment (Amesbury, UK) using a 532 nm laser beam. The quantification of IR-780 in MalbIR nanocarrier was done by means of a fluorescence spectrophotometer (Varian, Cary Eclipse), with excitation in the 780 nm wavelength and the fluorescent emission detection at 800 nm. A calibration curve was obtained by diluting pure IR-780 in ethanol (from 60 to 250 µg.ml−1) to determine the amount of IR-780 coupled to the MalbIR samples, which was found to be 10 µg.ml−1.
Experimental setup for in vivo MNH
The MNH in vivo experimental setup consisted of an Ambrell system model EasyHeat-LI (Ameritherm, Inc., Scottsville, NY). The system operated at 301 kHz with a Helmholtz-like (2 + 2)-turn coil configuration (see Fig. S1-A in the supplementary material) and was cooled using a closed-loop circulating water system with the water temperature maintained at 20 °C. A commercial ac magnetic field probe (AMF Lifesystems®, Rochester, MI) was used to map two-dimensionally the field generated by the coil (Fig. S1-B) and the alternating magnetic field (AMF) rms amplitude is estimated to be 220 G (17.5 kA.m−1) at the place where the tumor (induced in the animal’s back) is positioned inside the coil, during the in vivo MNH treatment experiments. Temperature monitoring was performed in two ways. Fiber optic thermometers (measurement range from −100 to 330 °C, accuracy (calibrated)±0.5 °C within 50 °C of calibration point, flexible microprobes bought from LumaSense Technologies, Denver, CO) are positioned at the mouse skin surface over the tumor region (reference point) and inside the animal’s rectum (reporting basal temperature). Infrared thermography (IR Cam from FLIR, model SC 620, Wilsonville, OR) configured for recording with a frame rate of 60 fps in the resolution of 640
480 pixels.
The IR Cam spectral bandwidth of acquisition is in the long-wave infrared range (7.5–13 μm), with a temperature measurement ranging from –40 °C to 500 °C and uncertainty of ±2% (an uncooled vanadium oxide-based microbolometer detector). Noise-equivalent temperature difference is less than 40 mK at 30 °C. The objective lens has a focal length equal to 19.31 mm and when IR Cam is placed at a distance from the target its field of view (FOV) is equal to 45°
34° regarding the horizontal (azimuthal) and vertical (polar) aperture angles that can be seen from the objective lens, respectively. According to the camera manufacturer’s specifications for this FOV, when d = 50 cm and a resolution of 640
480 pixels, the focal plane matrix area (regarding the solid angle from IR Cam's objective lens) corresponds to a physical flat surface of temperature acquisition values with an area of 1271 cm2: a horizontal size of 410 mm and a vertical size of 310 mm, since each pixel has the physical squared dimension of (0.65
0.65)=0.4225 mm2. The commercial software used for IR imaging analysis was the FLIR ResearchIR® (version 1.2.10173.1002). During the MNH treatment, the objective lens of the IR Cam is maintained parallel to the normal direction of the animals tumor to avoid curved object error effects on the surface temperature determination. The temperature error with IR Cam in the in vivo MNH studies is estimated to be
1.0 °C due to directional emissivity effects [Citation27].
Protocols for in vivo MNH
The Ehrlich bearing-mice with solid and subcutaneous tumors (n = 10) used in this pilot in vivo study were divided into two groups: (i) a control (n = 6), that had the tumor volume growth monitored, but with one animal separated for the histopathologic assay and (ii) an MNH group (n = 4), that received MalbIR intratumoral injections and were submitted to in vivo MNH experiments. In this case, each animal received a single dose of 90 μl of the MalbIR magnetic colloid, injected intratumorally (5 mm depth below the skin) and equally divided into three symmetric sites along the major axis of the tumor.
Before the MNH experiment, to perform the three-dimensional reconstruction for computer simulations, each animal underwent ultrasonography scanning for 3D tumor reconstruction using the veterinary US equipment (model SIUI-CTS-5500V Ultrasound Machine) with a linear transducer to improve the quality of the images [Citation47]. For a better three-dimensional reconstruction of the tumors, a gelatin standoff was placed covering the animal’s body along its dorsal spine (see Fig. S3). The series of slices within the ROI of the tumor (ROITumor) are extracted from the recorded ultrasonography (a video file). The methodology to generate the 3D tumor geometry via 2D images is similar to that applied in other tomographic imaging modalities, and involves three steps at least: segmenting the US video in sequential frames, stacking the extracted images along a certain axis and, finally, reconstructing the model three-dimensionally. To do the segmentation process and, subsequently, reconstruct a reliable three-dimensional object, we used the program ImageJ/(Fiji) [Citation48,Citation49].
Also, a digital PG technique is used to determine the exact shape of each animal’s body. This is accomplished by taking many pictures from different angle positions (carried out with a Nikon® D3200 SLR camera with lenses from 18 to 55 mm) and, thereafter, overlapping the stereoscopic images producing digital elevation models (virtual topographic reliable shapes). The photographs are taken at a fixed short radial distance, but in distinct positions, rotating the camera according to the azimuthal angle (θ) (tilting step 15°) and the polar angle (φ) (tilting step 30°). After collecting a close-range photographic dataset with the digital camera, Autodesk's 123 D-catch license-free software was used to processing these data (currently, this program is no longer available, the software's name has been changed to RECAP Photo) and build the three-dimensional object.
Further, 1 h before the MNH procedure, the MalbIR sample is intratumorally injected and the 3D nanoparticle distribution inside the tumor is obtained using the FMT technique. The in vivo images were obtained using the FMT in vivo Imaging System bought from Perkin Elmer (Waltham, MA), which operates at four channels, namely: 635, 680, 750 and 790 nm. The fluorescence studies of this work were performed using the 790 nm excitation channel with a maximum laser output power of 80 mW. The three-dimensional mapping of the nanocarriers inside the animal's tumor (3D-FMT procedure) takes about 20–25 min.
Then, after completing the baseline 3D-FMT mapping, each mouse was placed inside the coil and underwent a single 30 min session of MNH treatment. To substantially minimize eddy currents effects avoiding unwanted tissue injuries, our pilot data from animal models were obtained as a combination of H = 17.5 kA.m−1 (rms value) and resulting in the product value
5.4 × 10⁹ A.m−1.s−1 that is very near to the Dutz–Hergt safe limit criterion (equal to 5.0 × 10⁹ A.m−1.s−1) for feasible applications of AMF for humans [Citation13,Citation14]. Further, previous studies of the group have revealed a 2–3 °C degrees of increase in the animal’s skin surface temperature due to free current loss at this condition [Citation27], which is far lower than the value reported during in vivo MNH after magnetic nanoparticle injection (see Fig. S3). The temperature monitoring consisted of 1 min without field (AMF-Off), 30 min under treatment (AMF-On) and 5 min of temperature recovering (AMF-Off).
Three of these animals (animals #2, #3 and #4) were followed after their MNH treatment, some animals up to 585 days. Animal #1 was euthanized after the MNH protocol and the excised tumoral tissue was used for histopathological analysis.
Histopathological determination of tumor irreversible lesions
The tumor histopathological examination was performed using the method of hematoxylin–eosin (HE). In some cases, the tumors were divided into three parts, with a size small enough to fit on one slide. The tumors were fixed in 4% paraformaldehyde in 0.1 mol.l−1 phosphate buffer, pH 7.2 for 24 h and then, were dehydrated in graded ethanol concentrations (70%, 80%, 90% and 100%), diafinized in xylene and embedded in histological paraffin Paraplast. The whole tumor in the block was cut (microtome Leica RM2245 – 5 µm – thick sections) in several slices, e.g., 160 slices (for the control animal) and
100 slices (for animal #1) and stained applying HE method, see Fig. S5. Then, the microphotographs were taken using a Carl Zeiss Axio Vert 25 optical microscope and a Leica M205A stereomicroscope with integrated Leica DFC550 digital camera (to get histological images of the whole tumor).
Then, the control and treated (animal #1) passed through a histopathologic study to estimate the percentage of apoptotic/necrotic volume (small amount of viable cell, cariolisis, cariorexis, apoptotic bodies and eosinophilic areas, fibrotic tissue), i.e., the fraction of irreversibly damaged tumor tissue. The slide was analyzed by a pathologist who classified the viable and apoptotic/necrotic regions in the image. After the identification by the pathologist, the image underwent a color binarization process using the Thresholding Color filter from ImageJ/Fiji Software. Here, we defined that the red color delimits the necrotic regions and the black one the regions of viable cells in the tumor slice. This procedure validation was established by the pathologist. After the critical threshold determination (by the pathologist) of the slide, we performed a computational analysis of all the other slides. The fraction of apoptotic/necrotic regions was then calculated through the equation:
(1)
(1)
where
is the identified apoptotic/necrotic volume,
is the total volume,
is the identified apoptotic/necrotic area of slice
is the total slice area,
is the thickness of the histological section (equal to 5 μm) and
is the total number of the slices. In this approach, the pathologist analyzed three random slides, resulting in three estimated necrotic fractions for the same tumor volume, obtained after performing the computational procedure. This allows us to estimate the error and determine the fraction of irreversible lesions of each tumor.
Definition of the thermal damage ( ) and degree of tissue injury () parameters
Since the in vivo MNH experiments revealed ablative temperatures, the thermometric parameter chosen to calculate the thermal dose was the thermal damage parameter () [Citation50], that is defined as:
(2)
(2)
Here, represents the concentration of viable cells (or undamaged tissues) after heating time
while
is the correspondent initial concentration. The temperature dependence of the conversion rate
(s−1) of
in cells/tissues irreversibly damaged, assuming a binary reaction, is described as
The energy barrier value is assumed to be
2.596 × 10⁵ (J.mol−1) (enthalpy of activation) and the frequency factor
2.94 × 1039 (s−1), obtained from muscle thermal damage, while
=8.3143 (J.mol−1.K−1) is the universal constant of ideal gases [Citation51,Citation52].
Further, in this report, it is useful to define another parameter, called degree of tissue injury (), obtained from the equation:
(3)
(3)
This parameter defines the fraction of tissue damaged after MNH according to the time–temperature profile of the target tissue. To extract this value for each tumor voxel position, we performed numerical simulations.
Computer simulations for in vivo MNH
MNH computer simulations were performed by numerically solving Pennes’ bioheat transfer equation, that is given by [Citation53,Citation54]:
(4)
(4)
where
is the density of the medium (kg.m−3) and
refers to the medium under consideration (e.g., an underwrite (
) to designate tumor tissue or (
) for healthy tissue),
is the blood density (kg.m−3),
is the specific heat of the medium (tissue) (J.kg−1.K−1),
thermal conductivity of the tissue (W.m−1.K−1),
is the specific heat of the blood (J.kg−1.K−1),
is the blood perfusion rate (s−1),
is the blood temperature (K),
is the amount of heat generated metabolically per volume unit (W.m−3),
is the amount of magnetic nanoparticle heat generated by hysteretic loss per volume unit during MNH (W.m−3).
The first term on the right side of Equation (4) is related to the diffusion of heat in the medium (tissue); the second is a convective term due to blood perfusion; the third is a metabolic term due to the high biochemical reactivity of the tumor cells and, finally, the heat generated due to the interaction of the nanoparticles magnetic moments with the external AMF (magnetic hysteresis). It is assumed that in this model the rate of blood perfusion is homogeneous and isotropic, but temperature-dependent and follows the one introduced by Erdmann et al., for both the tumor () and healthy animal’s tissue (
), that is given by [Citation55,Citation56]:
(5)
(5)
and
(6)
(6)
This model was used based on several reports from the literature [Citation27,Citation55–57], but its effect is also investigated numerically (see next section). Heat flux and temperature continuity at the interface of the tissue layers are described by the following boundary conditions: and
while the skin surface convective boundary condition is
where
3.7 W.m−2.K−1,
303 K and
is a direction perpendicular to the tissue surface. The calculation of the convective heat coefficient (
) was performed using the equation described in Ref. [Citation58], at
Table S-II presents the parameter values used in the in vivo MNH simulations (unless otherwise stated).
Aiming to arrive at a realistic computer simulation, the new methodology proposed here uses: (i) the surface body of the animal extracted from PG technique, where the animal's body shape geometry is exported in STL format to the COMSOL Multiphysics simulation program; (ii) the 3D tumor is obtained from the US sensorless freehand method and is also exported in STL format to COMSOL; (iii) finally, the nano-heaters 3D intratumoral localization is obtained from FMT. However, to export the DICOM image sequence [Citation59] extracted from the ROITumor, one needs first to extract, using the TrueQuant® software from FMT equipment, a set of DICOM images that contain all of the information of the fluorescence voxel signals captured by the FMT during the scanning process. Using imageJ (Fiji) software, it is possible to select a three-dimensional ROITumor and export the coordinates of each voxel. We used an FMT cubic voxel with edge length of 0.25 mm. The FMT data analysis allows to export the nano-heaters intratumoral position, which is then used to create a three-dimensional heat-source function, by noticing that particle concentration correlates with the fluorescence intensity of each voxel inside this selected region.
In our approach, we created an interpolation function using the voxel coordinates (and its respective fluorescence intensity) obtained by the 3D-FMT mapping. Note that the calculated value is also directly proportional to the concentration of magnetic material. Then, we insert a voxel intensity function in COMSOL Multiphysics, which contains information about the concentration (fluorescence) intensity in a given position, as extracted from the FMT data. Fundamentally, we defined a function:
(7)
(7)
which normalizes all data in a specific position to the highest intensity value (
), i.e., highest particle concentration within a voxel. As a consequence, the heat source is written as a constant
times this normalized concentration function, such that
where only
is varied in a given simulation. It should be highlighted that this function is personalized to each animal and establishes a voxel dependent heat source for MNH.
The surface temperature measurements obtained from simulations are compared with IRT data. The alignment between the ROI’s is obtained first by indicating the tumor region in both, the infrared image and the PG 3D animal body (that is exported to COMSOL). In the infrared image, we change the color palette in the FLIR Research software from Rainbow to Glowbow, that allow more details of the surface of the animal to be identified, such as the location of the probe on the surface of the tumor (and the tumor itself) and more detailed outlines of the animal. Based on this ROI, we align with COMSOL data. After the computer simulation, the data extracted from the mesh in COMSOL are converted into a matrix (25 × 30) with exact dimensions 19.5 mm × 16.25 mm, which correspond to the dimensions of the experimental ROI.
Sensitivity and uncertainty analysis of MNH computer simulations
Note that some parameters of the simulation are not measured (in this report) but assumed to follow the literature, for example, Erdmann’s model for the perfusion temperature dependence [Citation27,Citation55–57]. To better evaluate the dependence of our results on some of the model parameters, we also performed a sensitivity analysis using as a model the data of animal #1. Here, we focus on the tumor perfusion temperature dependence () and on the surface convective parameter (
), where again
is varied for each simulation. The fraction of irreversible lesions inside the tumor (i.e., estimate for apoptotic/necrotic percentage) is considered for comparison between different computer simulation scenarios since this had been calibrated from histopathology analysis for animal #1. Distinct
functions were investigated (see supplementary material – Table S-III), spanning from high to low perfusion cases. Further, the range of validity for the convective heat coefficient (
) study (see supplementary material – Fig. S7) was obtained using an expression known from the literature [Citation58]. The characteristic body size of the specie is assumed to range from 0.06 to 0.10 m (mouse), which results in
values from 3.0 to 3.7 W.m−2.K−1. For theoretical purposes, in this analysis, we also show numerical results considering a higher value,
10 W.m−2.K−1. The study allowed us to perform an uncertainty analysis of the in vivo magnetic hyperthermia efficiency.
Statistical analysis
Kaplan–Meier’s survival curves were analyzed applying the log-rank test (also called the Mantel–Cox), using the GraphPad Prism licensed software (La Jolla, CA). Results are presented as *p < .05, **p < .01 and ***p < .001. Also, the statistical analysis followed the recommendations of the ISO guide platform for the cases when the number of animals (experiments) in each group is not high [Citation60]. In this context, some data are shown in the format (mean value)±(×standard deviation) in order to obtain an expanded uncertainty, where the
-factor comes from the application of Student’s t-test, following a table of standardized confidence intervals, determined according to the number (
) of degrees of freedom in the set of measures (calculated as
) and
is the size of the studied assemble (e.g., the number of animals).
Results and discussion
Theranostic nanocarrier characterization
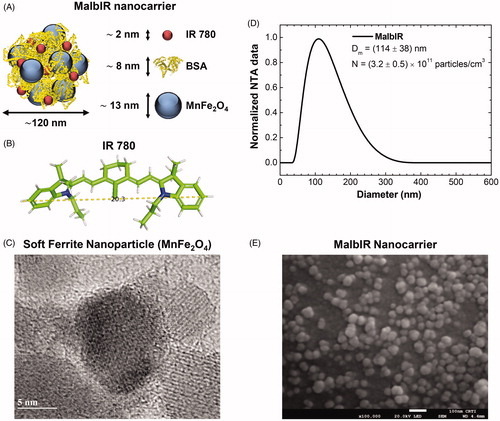
The pilot animal study starts with the development of a multifunctional magnetic nanocarrier named MalbIR. In the MalbIR nanocarriers, BSA forms a corona around the surface of the Mn-IONPs, as depicted in that shows an illustrative chart of the multicore nanostructure formed by aggregates of nanoparticles. The figure also represents a size estimation of each constituent, where the IR-780 dye couples to the BSA hydrophobic groups during the synthesis procedure [Citation46]. shows the molecular structure of IR-780. The magnetic nanoparticles consist of manganese ferrite, and a representative image of an isolated Mn-IONP (spherical-like soft ferrite with diameter 13 nm) obtained by high-resolution transmission electron microscopy (HR-TEM) is shown in . The MalbIR size distribution was obtained by NTA () revealing Dm=(114 ± 38) nm (mean diameter ± standard deviation) and a particle concentration of N=(3.2 ± 0.5)×1011 particles.cm−3. Further, a representative field emission scanning electron microscopy (FE-SEM) image of MalbIR is shown in . Altogether, the characterization indicates that MalbIR nanocarriers consist of a multi-core nanostructure system.
Figure 1. (A) Schematic representation of MalbIR nanocarrier. (B) Molecular structure of the IR-780 generated using the free-license software Pymol to estimate the size of the molecule, where the unit of measurement is in angstrom (1 Å=10−10 m). (C) Representative HR-TEM image of the Mn-ferrite nanoparticles (with diameter 13 nm). (D) MalbIR nanocarrier size distribution obtained from NTA analysis. (E) Representative FE-SEM image of the MalbIR nanocarrier.
MalbIR imaging with FMT
The coupling of IR-780 to BSA (see Ref. [Citation46] for details) allows the magnetic nanocarrier to become fluorescent in the NIR, and therefore detectable through FMT. To test its application, we intratumorally injected MalbIR and followed it with 3D-FMT. Fig. S2 shows different in vivo images for distinct times after intratumoral MalbIR injection. The results reveal that MalbIR remains within the tumor (at least for the first 24 h before the MNH), and that the nanocarrier showed a sufficiently strong fluorescent signal to allow its efficient in vivo detection inside the animals’ tumors. Then, we performed an MNH experiment and compare the 3D-FMT images before (t = 24 h) and after MNH (t = 25 h). The results indicate that heat can promote diffusion of the MalbIR within the tumor, which could be very useful in aiming toward a more suitable in situ drug thermo-delivery application.
However, despite the heat-induced diffusion of the particles that might also play a role in estimating the heat deposition within the tumor, such an effect will be neglected in the present computer simulations. Hence, in the proposed computational model, was assumed a static location of the nano-heaters inside the tumoral mass, which is determined within one hour after nanoparticle injection, i.e., a few minutes before MNH treatment. It was also assumed that the nano-heaters power generation will be constant in time, but voxel-dependent. Hence, the higher the fluorescence signal inside a given volume containing MalbIR nanocarriers (as obtained by 3D-FMT), the higher will be the amount of heat delivered to tissues surrounding that voxels.
MalbIR in vivo therapeutic heating performance
Differently from the previous section, in the pilot in vivo MNH study, MalbIR is intratumorally injected only around one hour before MNH. After completing the baseline 3D-FMT mapping of the nano-heaters inside the animal's tumor, each mouse underwent a single 30 min session of MNH treatment. MNH was performed at 17.5 kA.m−1 and
310 kHz (rms value), an experimental condition very close to the Dutz–Hergt safe limit criterion [Citation13,Citation14]. The surface temperature increase for each mouse was registered with the IR Cam and co-registered with the fiber optic probe (in one point) over the tumor region and in the rectum of the animal. The MNH heating curves (from animal #1 to #4) are shown in Fig. S3-A to S3-D.
The MalbIR nanocarriers show great heating performance in vivo, almost in the low-field condition, with average surface temperatures ranging from 46 to 50 °C for about 25 min in the target region. Table S-I summarizes the time–temperature exposure profiles of the four animals treated with MNH.
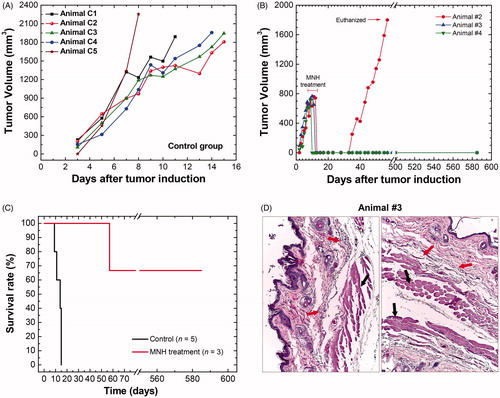
Even though this is not the focus of the present work, it is fair to mention that this time–temperature ablation regime was able to promote CR of tumors in two of these mice (animals #3 and #4) after a single session of 30 min of MNH (see ). This suggests that MalbIR has a potential as a therapeutic agent, within the safety clinical criteria. But a study with a higher number of animals would be necessary to claim any treatment efficacy outcome, and is planned for the future. Hence, the present report should be considered as an MNH pilot in vivo study.
Figure 2. (A) Tumoral time-evolution of the control group (n = 5), animals also bearing a solid and subcutaneous Ehrlich tumor, that did not undergo the MNH nor receive MalbIR injection. (B) Tumoral time-evolution of the treated animals #2, #3 and #4 by in vivo MNH with MalbIR nanocarriers intratumoral injection (single session of 30 min of exposure to an AMF of 17.5 kA.m−1 and 301 kHz). (B) Kaplan–Meier’s curves of the control group (in black, they were euthanized when their tumors reached 2000 mm3) and the treated animals #2, #3 and #4 (in red). (C) Histological sections of the skin of animal #3, extracted from the same region where the tumor had previously been induced, but 575 days after the MNH treatment. The red arrows indicate fibrotic regions and the black arrows indicate the dermis and muscle tissue.
Furthermore, to address realistic MNH numerical simulations, one needs first to perform 3D reconstructions of the body, tumor and MalbIR intratumoral distribution.
3D reconstructions for more realistic computational modeling
To obtain the exact shape of each animal’s body submitted to the in vivo MNH, since we deal with subcutaneous tumors and the skin surface thermometry is quite relevant, we applied the digital PG technique. shows a mouse sedated and positioned in the same way that it will be placed inside the coil for the MNH treatment. Subsequently, in , a diagram illustrates the process to take sequential pictures of this animal's body in distinct positions, while exhibits the body 3D-reconstruction obtained from the digital PG protocol. The animal's body shape geometry is then exported in STL format to the COMSOL Multiphysics software for further simulations.
Figure 3. Animal’s body reconstruction: (A) picture of animal #1 (before MNH) sedated and positioned in the same way that it will be placed inside the coil for treatment; (B) diagram illustrating the process to take sequential pictures of this animal's body collecting a close-range photographic data set with the digital camera; (C) animal’s body model reconstructed by photogrammetry technique. Animal’s tumor volume reconstruction: (D) ultrasonography showing the animal in the prone position, identifying its solid tumor along the vertebral column (dorsal region); (E) process for tumor slice extraction from the ultrasound video (about 100 frames) and filter applications to the images; (F) rendering of the tumor volume after stacking all the filtered slices. Nano-heaters intratumoral spatial distribution: (G) 3D animal scanning on the fluorescence molecular tomography (FMT); (H) 3D reconstruction of the volume occupied by the MalbIR nanocarriers within the tumoral mass (less than 1 h after intratumoral injection); (I) three-dimensional heat source distribution function (voxel-dependent) generated using the COMSOL Multiphysics software.
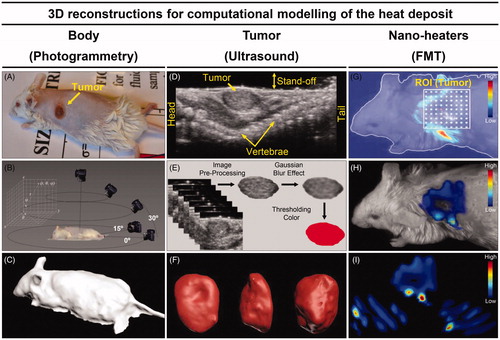
shows a US image of an animal in a prone position, with the tumor along the vertebral column. As discussed before, a US video of the tumor is analyzed, allowing the determination of a sequence of slices (frame) that pass through Image pre-processing and Gaussian Blur filter for 3D tumor reconstruction, as schematically represented in . Overlapping these treated images and rendering the created object, it is possible to obtain a final solid object as shown in . The animal's tumor geometry is then exported in STL format to the COMSOL Multiphysics software.
The nano-heaters localization, after intratumoral injection, is obtained by FMT. Delimiting a specific ROITumor and setting the step of the three-dimensional laser scanning (), the volume occupied by the MalbIR nanocarriers can be found inside the tumoral mass (). After data manipulation (see ‘Methods’ section), it is possible to select and export the coordinates of each voxel containing the nano-heaters, which is used later to create a three-dimensional heat-source function based on the fluorescence intensity of each voxel inside a selected region. shows some slices (in three different directions) of the volume generated by this heat-source function (voxel-dependent), as created with COMSOL Multiphysics software.
Computational modeling of the intratumoral heat delivery
After having obtained more realistic and personalized models (according to each animal’s anatomy) for the body surface, tumor volume and nano-heaters intratumoral location, we can use the COMSOL Multiphysics software to combine these three complex geometries in a single geometric model by segmenting the heat target regions and assigning thermophysical properties to each segment (see Table S-II), followed by implementing a non-linear temperature dependence for the tumor blood perfusion rate in order to solve the bioheat equation (Equation (4)) for each voxel [Citation27,Citation55–57]. Next, Equation (2) (also for each voxel) is used to convert this 3D-temperature mapping into the spatial distribution of thermal damage values. From this information, we also calculate the corresponding three-dimensional degree of tissue injury
(Equation (3)).
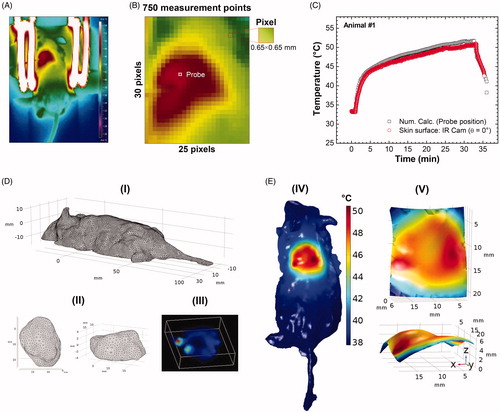
Before discussing the simulations, it is relevant to mention the experimental configuration. During the in vivo MNH procedure, the IRT () was performed using the procedure adopted by Rodrigues et al. [Citation27], positioning the IR Cam 50 cm above the mouse’s body at a fixed direction θ=(0.0°±0.5°), which results in an inaccurate temperature determination of 1 °C. is a pixelated IR image from the ROITumor enclosing a total amount of 750 pixels (where each one of them works like a punctual thermometer) acquiring dense bi-dimensional dataset of temperature, at the time point of 30 min of MNH. shows the probe temperature (reference point) at the skin surface over the tumor region, as well as the numerical simulation at the same position, during MNH. The agreement between these curves can be achieved by changing the value of
in the heat generation function of the simulation. However, this corresponds to just one point on the surface, while the method here evaluates several points on the surface (as well as intratumoral heat delivery).
Figure 4. (A) Thermographic image of animal #1 at time t = 31 min (i.e., after 30 min of MNH). (B) It is a pixelated IR image from the ROITumor enclosing a total amount of 750 pixels (where each one of them works like a punctual thermometer). (C) The numerically calculated temperature compared to the real value (IR measurement) at the same point of the mouse skin surface. (D) (I, II) Customized meshes generated using COMSOL Multiphysics commercial software for the application of the finite element method of calculation within the animal’s body and tumor reconstructed geometries (animal #1); (III) the volumetric distribution of the heat-sources, inside the animal’s tumor #1, based on the 3D-FMT mapping of the MalbIR nanocarriers. (E) (IV) shows the numerical calculation of the mouse skin surface temperature (all over the body), after 30 min of MNH; (V) ROITumor extracted from the simulation showing the temperature profile after 30 min of MNH.
Moreover, analyzing just one point on the surface, or even, for instance, comparing a set of points along the major and minor tumor axes [Citation19], is not enough to guarantee that the computational simulation works well to fit the experimental data with good accuracy. For this reason, the choice of an ROITumor with a large number of measures (e.g., 750 measurement points), becomes more reliable, improving the analysis of the computational model. In present report, a minimum of 50% agreement between the numerical calculation and the IR temperature data was established as a criterion inside the same ROITumor, considering an experimental uncertainty of ±1.0 °C in the IR measurements [Citation27], as better discussed later.
shows the meshes generated in the COMSOL Multiphysics software for the application of the finite element method (FEM) calculations in animal #1, where each region was customized: for the mouse body, (I), with more complex details, an extra-fine mesh was inserted (with a growth factor of 1.35) and the details of the curvature of the animal’s surface are noted, showing the refinement of this technique. For the tumor, a normal mesh was inserted, with a growth factor of 1.5 from the tumor boundary toward normal tissue ( (II)). On the other hand, (III) shows the volumetric distribution of the heat-sources inside the animal’s tumor and based on the 3D-FMT mapping of the MalbIR nanocarriers (using each voxel coordinate and its respective fluorescence intensity). It might be relevant to mention that for the nano-heaters spatial distribution reconstruction, it was established that the occupied volume inside the animal’s tumor must be equal to 90 mm3, in order to fit the amount of injected magnetic fluid before its MNH.
The results of the computational simulation for animal #1 are shown in , where the hottest regions are in red. (IV) shows the result of the numerical calculation of the skin surface temperature (all over the body), after 30 min of MNH. In (V), a virtual ROI is extracted from the reconstructed animal’s body shape, with the same dimensions as the experimental ROITumor (19.5 mm 16.25 mm), zooming the simulated surface temperature distribution over the subcutaneous tumor. As it will become clear in the next sections, the maximum agreement at the surface (>50%) alone does not establish the conditions to guarantee a good and realistic computer simulation. Indeed, a calibration procedure through histopathology analysis was necessary to achieve this goal that, combined with the approach previously discussed, allowed an adequate computer simulation.
Histopathology analysis of irreversible tumor lesions after MNH of animal #1
shows the graph of tumoral evolution of the animal #1, which was euthanized on the MNH treatment day (in the 11th day after his solid tumor induction procedure) with the excised tumoral tissue used in a histopathologic assay. One should remember that each of the animals (#1 to #4) went through the same imaging protocols for 3D-reconstructions of its body shape (by PG), tumor volume (by the US) and intratumoral nano-heaters spatial mapping (by FMT).
Figure 5. (A) Tumoral evolution of animal #1 until the MNH treatment day (about 738 mm3): the animal #1 was euthanized on the 11th day and the excised tumor tissue was used for a histopathologic assay (positive control). (B) Histopathological slide with three parts of the tumor excised from animal #1. The red arrows indicate the portions of skin and muscle that was not properly removed during the tumor excision (overestimating total tumoral tissue region). This skin and muscle layers have been computationally removed from this slice (the inset on image). (C) The threshold color method option is applied to delimit apoptotic/necrotic (red) and viable (black) areas. This process is done for all images in the stack (∼110 slices). (D) The animal’s #1 skin temperature data within the experimental (4 D-I) and simulated (D, II) ROITumor, at time instant t = 31 min, i.e., after 30 min of MNH. Each temperature map contains 750 pixels. (D, III) shows the temperature difference (TSim – TIR), pixel by pixel, between the simulated and the experimental ROITumor. When |TSim – TIR|≤1 °C both pixels are considered registering the same temperature value (due to the IR measurements experimental error ± 1 °C). From this, it is possible to estimate the percentage of area agreement between experimental (D, I) and simulated (D, II) data. (E) Pixel agreement curve as a function of SLPsim for animal #1, using the Erdmann model. (F) The upper part (red solid) shows the simulated fraction, within the total tumor #1, of the tissue volume irreversibly damaged (VIrrevDam=550 mm3) and, in the lower part (blue solid), the simulated fraction that has suffered reversible thermal damages and remains viable (VRevDam=188 mm3), when
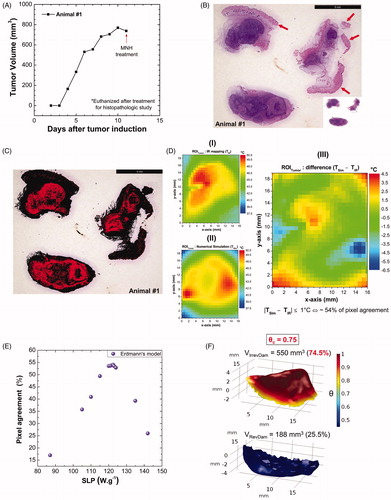
The histopathological analysis of the tumor of animal #1 was an essential part of our methodology since it supports the establishment of an irreversible thermal damage threshold (for Ehrlich solid tumor at least). From this, it was possible to find a quantitative relationship between the histologic outcomes and the computational prediction of the tumoral apoptotic/necrotic region after in vivo MNH.
shows a representative histopathological slide with three parts of the tumor excised from animal #1. The red arrows indicate the portions of skin and muscle that were not properly removed during the tumor excision (overestimating total tumoral tissue region). The skin and muscle layers have been computationally removed from this slice (the inset on image). The same histopathologic study was carried out with the other control mouse with a solid and subcutaneous Ehrlich tumor, but without undergoing the MNH treatment or received the MalbIR injection. All the slices referring to both tumors (control and #1) are shown in Fig. S5. shows the same slice of after the image color binarization process using the Thresholding Color filter from ImageJ/Fiji Software. The red color delimits the apoptotic/necrotic regions and the black one the regions of viable cells in the tumor slice.
The computation procedure, using Student’s t-test with 95% confidence interval, revealed an estimated apoptotic/necrotic fraction for the tumor of animal #1 of (74.5 ± 10.9)%, about 2.5 times larger than the apoptotic/necrotic region of the tumor control. It might be fair to mention that, without computationally removing the excess of skin and muscle, the tumor necrotic fraction calculated for animal #1 (54%) was not much higher than the control animal (
30%) whose tumor had not not received MalbIR injection, nor undergone AMF exposure. Hence, this procedure has to be carefully performed to avoid errors in the determination of the fraction of irreversible lesions in the tumor. The histopathology findings are then later used to validate the numerical simulations.
Thermal damage of tumoral tissue using computational modeling
The above discussions about the MNH simulation of animal #1 had considered only one unknown parameter, i.e., varied only the magnetic heat source term, (the role of blood perfusion is analyzed in the next section). Changing this parameter means a distinct SLP value. According to the proposed method the best scenario, when comparing the experimental IRT data ((D, I)) and simulation ((D, II)) for a time window of 30 min of MNH, happens when a maximum correspondence between both surface temperature data are achieved. (D, III) shows the difference within an ROITumor at the surface between the simulation (TSim) and the experiment (TIR) for each corresponding pixel. Considering an experimental uncertainty of ±1.0 °C in the IR measurements, we found a pixel agreement area of around 54% for this simulation, which assumed
7.23 × 10⁶ W.m−3, i.e.,
122.5 W.g−1, for the case of animal #1. Varying
(SLP) results in a lower agreement value, as shown in , which suggests that the best simulation is the one just reported.
However, is very important to keep in mind that this procedure alone does not guarantee that the simulation represents the real scenario. One still needs to check what is happening inside the tumor, i.e., if the intratumoral thermal dose can result in similar irreversible tissue injury, as found in the histopathology analysis.
For the excised tumor #1, the correct histopathologic outcome demonstrated a apoptotic/necrotic tissue fraction of (74.5 ± 10.9)% of the total tumor volume (after a single session of 30 min of MNH treatment). Hence, we adopted as an experimental critical value for the degree of tissue injury 0.75. Since
this critical value corresponds to
1.4 (see Fig. S6). Note that in the computational modeling, we can calculate three-dimensionally the temporal evolution of the intratumoral temperature
by solving numerically Equation (4) (when
) for each voxel of the reconstructed tumor volume. Therefore, applying Equation (2) (also for each voxel) to convert this 3D-temperature mapping into an equivalent volume of thermal damage
values, finally, we can also calculate (through Equation (3)) the correspondent three-dimensional degree of tissue injury (
).
To obtain a numerical estimation of the volume of viable and apoptotic/necrotic tissues within the tumor of animal #1 in good agreement with the experimental critical ratio of 0.75, we proceed with the following algorithm: if the simulated value (
) on each voxel reaches (or even exceeds) a certain critical value (
) estimated by histopathologic assay, i.e.,
then the voxels inside this apoptotic/necrotic region (
3D-mapping) are counted as a tissue volume irreversibly damaged (VIrrevDam); on the other hand, if
then the region has suffered reversible thermal damages and remains viable (VRevDam).
Realistic numerical simulations of animal #1 are performed to confirm and validate this finding, as shown in Fig. S6, that shows the influence of the critical degree of tissue injury in determining the fraction of irreversible lesions in the tumor. Indeed, shows a 3D-mapping of the numerically calculated degree of tissue injury inside the tumor of the animal #1, where the simulated values of VIrrevDam=550 mm3 and VRevDam=188 mm3 reproduce the experimental proportion between necrotic and viable tissue obtained by histopathology, when
0.75 meaning that 75% of the total tumor volume was lethally heated.
So, from histopathology analysis we establish 0.75 as a threshold for irreversible thermal damages within Ehrlich solid tumors that have undergone MNH treatment. Also, we use this value for any other simulation for determining the fraction of irreversible lesions in the tumor. But, before performing the analysis of other animals, it might be relevant to perform a sensitivity analysis of some relevant parameters of the simulation to justify values assumed for some of the simulated parameters.
Sensitivity and uncertainty analysis for in vivo MNH
Certainly, one of the most important parameters for the success of any cancer thermal therapy is the tumor blood perfusion, which has been found to be temperature-dependent [Citation61,Citation62]. Indeed, the temperature dependence of blood flow in healthy organs and tumors of animals and humans has been investigated using several methods, such as PET [Citation63], US [Citation64] and MRI [Citation65], among others. It was found (in mice) that blood flow decreases with increasing tumor volume/mass [Citation62]. This is in accordance with our pilot in vivo study that investigates MNH in large solid tumor sizes. Indeed, we had assumed Erdmann’s tumor perfusion model (Equation (5)) in the numerical simulations, which might be defined as a low perfusion model.
Since perfusion can significantly influence the intratumoral heat delivery, we checked and evaluated the influence of In this analysis, distinct numerical simulations of animal #1 were performed using another 10 expressions for tumor blood perfusion, which spans from low to high perfusion cases (see Table S-III). The investigation is consistent with measurements of tumor blood flow in mice with mammary adenocarcinoma, as extracted from the work of Jain and Ward-Hartley [Citation62], who found values between 0.05 and 0.4 (ml.g−1.min−1) that give tumor blood perfusion rate (
) in the range of 0.000883–0.007 s−1. We will focus on two main analyses, namely the surface pixel agreement (at 30 min of MNH) and the fraction of irreversible tumor lesion (using
0.75).
shows the calculated fraction of irreversible tumor lesion (%) (after 30 min of MNH) as a function of distinct SLP for the different tumor blood perfusion expressions. And the inset shows some representative perfusion expressions as a function of the temperature used in the simulations. Different scenarios are investigated, for instance, high and low-temperature dependence behaviors. In all cases we found that upon increasing the heating efficiency, irreversible tissue injury also increases, as expected. Indeed, 100% injury is found at low SLP in cases with low perfusion, for example for Equation (S.1) (see Table S-IV) this is accomplished for a SLP of 165 W.g−1, while for Equation (S.10) (high perfusion case) this occurs at a higher value, i.e., 395 W.g−1. Obviously, the results indicate that it is more difficult to heat tumors with higher perfusion. However, beware that this investigation alone does not validate any perfusion temperature dependence for our animal tumor model, as discussed below.
Figure 6. (A) Calculated fraction of irreversible tumor lesion (%) (after 30 min of MNH) as a function of SLP for the different tumor blood perfusion expressions (see Table S-III). (B) Surface area pixel agreement (inside ROITumor), between the IR data and the numerically calculated values for animal's skin temperature after 30 min of MNH, for several perfusion cases. (C) The calculated fraction of irreversible tumor lesion (%) (after 30 min of MNH) as a function of SLP, for different values assuming Erdmann’s model (Equation (5)) for the perfusion (shown in the inset). (D) Surface area pixel agreement as a function of SLP, at 30 min of MNH, for the same
values tested in (C) and also assuming Erdmann’s model.
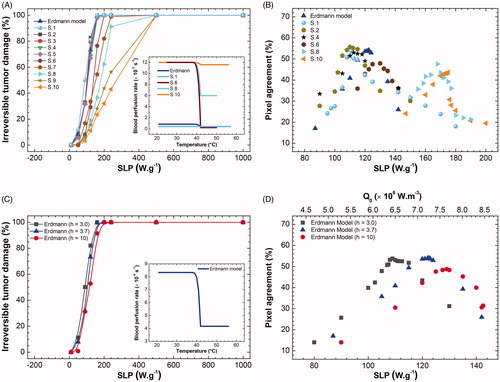
shows the surface area pixel agreement (inside ROITumor) comparing the IR data and the numerically calculated values for the animal's skin temperature after 30 min of MNH, for several perfusion cases. Note that independent of the perfusion, an optimum agreement is always found. However, pixel agreement higher than 50% is achieved only for the low perfusion cases. Again, beware that this optimum SLP value for surface temperature distribution does not guarantee a good simulation, i.e., some of the perfusion values do not represent the tumor model investigated. For example, for the highest perfusion case (Equation (S.10)), one finds a better surface agreement for an SLP value of 175 W.g−1 (see ). But this SLP corresponds to only 34% of irreversible tumor lesion (see ), which is completely different from the experimental value found by histopathology of (74.5 ± 10.9)%. On the other hand, 75% of the lesion, in this case, reveals a 0% of pixel agreement for the SLP = 285 W.g−1. In conclusion, the sensitivity analysis indicates that our tumor model is better represented by the low perfusion case, which again supports our previous choice of using Erdmann’s model (EquationEquation (5)(5)
(5) ). Nevertheless, since we had not measured the blood perfusion for our tumor model, the uncertainty on SLP determination for animal #1 has to be taken into account. Considering only cases where pixel agreement is higher than the 50%, we found that the SLP value ranges from 109 to 122.5 W.g−1, a variation of 11% concerning Erdmann’s model.
Another parameter that was evaluated was the convective heat coefficient (). According to the literature, the parameter value depends on the body dimension of the specie [Citation58]. Considering a mouse with a body size ranging from 0.06 to 0.10 m, the
values are calculated to be between 3.0 and 3.7 W.m−2.K−1. For theoretical purposes, in this analysis, we also show numerical results considering a higher value,
10 W.m−2.K−1. It might be also relevant to mention that if the convective boundary was established not at the skin surface, but the tumor surface, then the convection coefficient
for quiescent air surrounding the tumor would be determined by LeBrun et al. [Citation57]
where
is the average Nusselt number,
is the tumor thermal conductivity and
the tumor diameter. For animal #1, at room temperature (303 K) we estimate this value to be 2.95, i.e., within the range already analyzed by the sensitivity analysis. However, this is not the boundary condition considered in the simulation, so the convective heat coefficient
as explained above, is calculated assuming the boundary condition at the skin surface, considering the specie characteristic size and might vary from 3 to 3.7 W.m−2.K−1.
shows the calculated fraction of irreversible tumor lesion (%) (after 30 min of MNH) as a function of SLP for different values, assuming Erdmann’s model (Equation (5)) for the perfusion (shown in the inset), while shows the surface pixel agreement as a function of SLP. Again, considering only cases where pixel agreement is higher than 50%, we found SLP values of 109 (122.5) W.g−1 for
3.0 (3.7) W.m−2.K−1. The result suggests uncertainty in the SLP determination of 11% (in respect to the
3.7 cases). On the other hand, the irreversible tumor lesion of
3.0 (3.7) W.m−2.K−1 was found to be 65.7% (74.5%), which is in good agreement with the histopathology analysis. For those interested in evaluating the effect of
in a larger range, please check the supplementary material, where one can find for example that higher
values result in lower irreversible tumor lesion for a constant SLP value (Fig. S7).
Indeed, the analysis of animal #1, inspired by the results of , i.e., taking into account the fraction of the irreversible tumor damage from the histopathology data analysis, indicates that the best surface temperature agreement is obtained using perfusion values that range from Erdmann’s model (Equation (5)) to Equation (S.2) perfusion cases (see Table S-III), and varying within 3–3.7. In this situation, we obtain from the uncertainty analysis for animal #1 the mean in vivo MNH efficiency
112 ± 7 W.g−1, while the mean irreversible tumor lesion was found to be 68.5 ± 4.4%, i.e., within the value found from histopathology analysis. The error corresponds to the uncertainty values of those parameters. For individual SLP values in different simulation scenarios, see Table S-IV.
Finally, more sophisticated sensitivity analysis procedures have been suggested in the literature [Citation40] but, although very interesting, they are beyond the scope of the present report. This strategy could be useful in the future to evaluate MNH surface temperature measurements, not only at the stationary regime, but also in the transient region.
Overall, the sensitivity analysis suggests that our tumor model is well represented by a low perfusion case. Hence, we are tempted to assume the well know Erdmann’s perfusion model to show the computer simulations of the other animals, but keeping in mind the uncertainty on the in vivo SLP evaluation due to both parameters, and
Further, we apply this analysis in a pilot in vivo study, establishing
0.75 as the threshold for irreversible thermal damages within Ehrlich solid tumors that undergo MNH treatment, and have at least 50% surface pixel agreement, considering a temperature error of ±1 °C due to curved tumor shape and emissivity directional effects.
Long-term pilot in vivo MNH study
The control group of animals (n = 5), also bearing a solid and subcutaneous Ehrlich tumor, that did not undergo MNH nor receive MalbIR injection, was followed until their tumoral volumes reached the limit of 2.0 cm3 (). In order not to prolong their suffering and according to the recommendations of CEUA/UFG, when these mice reached the size limit, they were anesthetized and sacrificed according to the earlier described protocol.
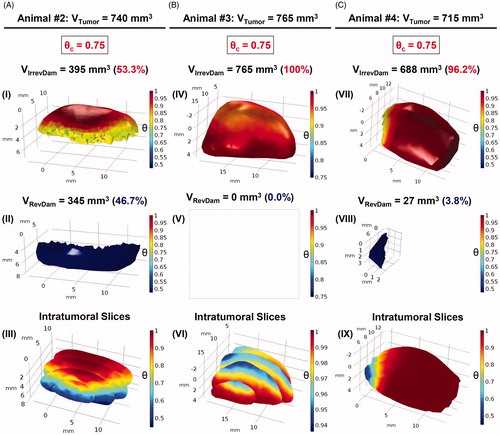
Figure 7. Volumetric fractions of irreversibly damaged (in red) and viable tissues (in blue) were numerically calculated for the tumoral volumes of animals #2, #3 and #4, columns A, B and C, respectively, assuming Erdmann’s perfusion model (Equation (5)). (A) In (I) the irreversible thermal damage value was calculated, corresponding to a volume of 395 mm3 of the total volume of animal #2 (740 mm3). The reversible thermal damage (II) is obtained by putting the volume to which is blue. (III) The intratumoral slices allow an internal visualization of the distribution of the degree of tissue injury of the tumor. The same analysis was done for animal #3 (B) and #4 (C). In (IV),
was adopted and the value of 765 mm3 was obtained for the volume of irreversible thermal damage, that is, 100% of the degree of tissue injury. This means that there is no viable tumor volume in (V), so it is blank. Intratumoral slices show the intratumoral tissue lesion in (VI), the scale shows that there are no
consistent with the results of (V). It is easy to notice the difference between the necrotic volumes between animals #2 and #4. By analyzing the number of data from COMSOL, animal #2 had irreversible thermal damage in only 53.3%. For animal #4, the irreversible volume was 688 mm3, equivalent to 96.2%.
shows the evolution of the tumor volumes of animals #2 to #4. The red arrow indicates the moment when animal #2 was euthanized, it being the only animal that presented tumor recurrence. For this animal, the in vivo MNH procedure occurred 11 days after the inoculation of the tumor cells and a recurrence was identified from the 35th day. Due to tumor regrowth, this animal was euthanized after 55 days. The others, animals #3 and #4, showed tumor CR. To assure that response, these two animals were followed for 585 days (most studies in the literature do not pass 60 days [Citation15]). Some studies consider CR with up to 26 days of monitoring the tumor of the animal [Citation66], however, in our opinion, this short time span is not enough to determine the preclinical outcome.
But despite the long-term monitoring, due to the small set of animals, it is impossible to preconize tumoral response that was observed in animals #3 and #4 as a reproducible preclinical outcome. Since such a conclusion demands a statistically significant number of treated animals by MNH with MalbIR nanocarriers, the reported findings in this section only play the role of providing a pilot in vivo dataset that is adequate for testing the proposed computational modeling, aiming for its proof-of-concept demonstration (several published in vivo MNH studies do not show a significantly higher number of studied animals [Citation15]).
It also might be interesting to mention that, for animals #3 and #4, five days after the MNH a thickened crusted skin lesion (epidermal necrosis) was formed over the subcutaneous tumor region, indicating that there was an ongoing tumoral necrotic process [Citation67]. The tissue regeneration process occurred similarly to that reported in Ref. [Citation68], in which a thick, dark crust was formed 72 h after tumoral heating. As we followed animals #3 and #4, we noticed that around the 19th day, this thick crust came off. It should be highlighted that other research groups already reported that an inflammatory reaction, resulting from prolonged in vivo thermal exposures (20–30 min of heating, ranging from 42 to 50 °C), can strongly enhance the death of neoplastic cells in murine solid tumor models [Citation69–71].
shows the Kaplan–Meier survival curve for the treated animals (#2, #3 and #4) and the control group (n = 5). Although the group of treated mice (n = 3) was small, the observed survival rate was large (67% of CR). This result is similar to that reported by Dennis et al., who observed a 75% of CR in MTG-B breast carcinoma (n = 4 mice, followed for 60 days after treatment), but in a quite different and clinically prohibitive experimental combination of frequency (150 kHz) and extremely high AMF amplitude of 43.8 kA.m−1 (
550.4 Oe) [Citation72]. Or even the 100% of CR results published by Lee et al., with the xenograft model U87MG for a human brain tumor (n = 3 mice, followed for 26 days after treatment), treated via MNH applying an AMF of 37.3 kA.m−1 (
468 Oe) and frequency of 500 kHz [Citation66]. Even though the number of animals used is not high, the statistical analysis of the Kaplan–Meier survival curves, applying the log-rank test, revealed that the groups are statistically different, with p=.0134.
In our long-term pilot in vivo study, the proof that there was no tumor recurrence for animals #3 and #4 was obtained by the histopathological analysis of samples harvested from the region of the animal's dorsum where the tumor had previously been induced, and none of the histological sections showed evidence of tumor tissues. It should be highlighted that for animal #3, in particular, this analysis was made 575 days after the MNH treatment (and 585 days after his tumoral inoculation). Over the treated region, the local skin area showed a reduction in its thickness, a local reduction in the number of hair follicles in addition to an extensive area of fibrosis just below the dermis ().
Validation of the methodology for predicting complete tumor remission after MNH
We decided to apply the same algorithm as described above for animal #1 (positive control) to analyze the heated tumors of animals #2, #3 and #4. This was performed in order to check and validate the potential of our numerical simulations to predict the fraction of irreversible thermal damage for each tumor. Here, we show simulations assuming Erdmann’s perfusion model (Equation (5) with 3.7), but later we also include an uncertainty analysis.
In ), volumetric fractions of irreversibly damaged (red solids) and viable (blue solids) tissues were numerically calculated for the tumoral volumes of animals #2, #3 and #4, respectively. For the construction of this 3D-mapping of the degree of tissue injury () we used a scale range of 0
1, where 0 means viable tissues and 1 means 100% of lethal injury (for each voxel). The adopted threshold for the simulations of all three animals was
0.75 (based on animal #1 histopathological outcome and simulated results).
(I) refers to animal #2, where the numerical simulation predicted that only 53.3% of its total tumoral volume suffered irreversible thermal damage, i.e., only 53.3% of the voxels inside the reconstructed tumor model reached (or even exceeded) the value of 0.75. It should be highlighted that only animal #2 (among the other animals) had a tumoral recurrence from the 35th day after his MNH treatment (see ). Continuing with animal #2, (II) shows that 46.7% of the total volume has suffered reversible thermal damages and remains viable, i.e., this entire volume in blue represents the tumoral region where
(III) shows, for animal #2, intratumoral serial slices of the complete tumor volume for three-dimensional visualization of the simulated degree of tissue injury.
Now, performing the same examination as before, according to (IV)–(VI) and (C) (VII)–(IX): for animals #3 and #4, the volumetric fractions (in red) of irreversibly damaged tissues of their total tumoral volume consisted of 100% and 96.2%, respectively. These were far higher than the value found for animal #2 (53.3%), the only one that does not satisfy the requirement of more than 80% of tumor tissues irreversibly damaged by heat [Citation73], which should result in a complete tumoral mass regression. Hence, the theoretical analysis applied to animals #2, #3 and #4 until here, is consistent with our long-term pilot findings of partial or complete tumoral remission upon following these animals after their MNH treatment (see ).
Also, taking into account the uncertainty analysis discussed before, the mean irreversible tumor lesion of animal #2 was found to be 56 ± 7%; that is still consistent with tumor recurrence analysis. While for animals #3 and #4 we found, respectively, 100% and 91 ± 5% (see Table S-IV). The results support our long-term preclinical outcomes.
In vivo SLP estimation
Interestingly, the proposed approach can be used to extract the simulated in vivo SLP, i.e., magnetic hyperthermia efficiency. To do that one defines the average simulated in vivo SLP as
(8)
(8)
where
is the mean normalized concentration parameter inside the tumor, while
is the average mass concentration of magnetic nanoparticles obtained experimentally from the relation
where
is the amount of magnetic material injected in the tumor (obtained from magnetization analysis to be 4.5 mg in this study), while
corresponds to the total intratumoral volume occupied by the magneto-fluorescent nanocarrier as estimated by using FMT.
For the multifunctional nanocarrier investigated, the in vitro MNH resulted in the experimental value of 112 ± 17 W.g−1, its magneto-thermal efficiency was evaluated at the same feasible combination of 17.5 kA.m−1 and 301 kHz for the AMF that was used for in vivo MNH, this value being obtained by the calorimetric method (see Supplementary Material). However, this SLP value should only be interpreted as a guide about the hyperthermia efficiency of the nanocarrier, since in the in vitro case the nanoparticles are suspended in water, while after injection they are in the tumor matrix environment.
On the other hand, it is curious to notice that, taking into account the uncertainty analysis (see Table S-IV), in our numerical simulations we found similar magneto-thermal efficiency values. For animal #1 112 ± 7 W.g−1, while for animal #2
83 ± 11 W.g−1, animal #3
114 ± 9 W.g−1 and animal #4
130 ± 10 W.g−1. The SLP value, derived from the results of the four animals, leads to a mean simulated in vivo MNH efficiency equal to
110 ± 20 W.g−1. Due to the low number of animals in the study, one might be tempted to apply Student’s t-test, where 70% confidence interval (
3 and
1.25) results in an error of 25 W.g−1, while for 90% confidence interval (
2.35) the error increases to 47 W.g−1. Anyway, the agreement with the experimental result is very impressive and corroborates the conclusion that we are doing a realistic-like computer simulation. Further, the nice agreement might arise from the fact that hyperthermia is performed within a short period after intratumoral nanoparticle injection (less than 1 h), so effects due to nanoparticle cellular endocytosis (decrease/increase of heating efficiency due to particle-particle interaction [Citation42,Citation43]) might not play a role. Also, while the nano-heaters correspond to soft nanoferrites that are expected to heat due to Néel relaxation mechanism at the MNH frequency, these nanoparticles are not expected to have any significant contribution to heat generation from Brownian relaxation.
Limitations of the methodology and final considerations
Besides the results reported above, there is still an important challenge to be overcome. Returning to Fig. S2, the FMT images of the multifunctional nanocarriers 1 h before (at t = 24 h) and 1 h after (t = 25 h) MNH treatment, indicates that the nano-heaters distribution probably changed during the treatment. Similar MNH experimental results in a PC3 tumor model using microCT images were recently reported [Citation74]. The result suggests that the nano-heaters might diffuse during MNH. In the present report, the thermally induced mass diffusion phenomena were not included in this simulation, and as far as we know, there is no technology yet available to monitor in vivo particle diffusion in real-time (although MPI might solve this problem in the future). This might explain why the surface temperature pixel agreement was not even higher. So far, it is not clear how important such a contribution might be in predicting the preclinical outcome and thermal dose, but one can envision that such investigations might be necessary, depending on the tumor type and experimental protocol, which could improve even further the methodology presented in this work.
Tumor heterogeneity might also explain why we are not able to obtain an even higher surface temperature pixel agreement, since the simulations assume an average tumor perfusion, while one expects perfusion to be position dependent.
Further, the surface temperature pixel agreement was only performed at the time point of 30 min of MNH. Ideally, the transient regime could also be dynamically analyzed. Indeed, this type of strategy has been performed in other types of studies [Citation40], not related to MNH, and could be considered to extend the methodology, although the approach presented in this report is quite simple and might be more easily implemented than more sophisticated methods. Nevertheless, more complex models might allow the determination of the perfusion temperature dependence through simulation analysis, which was not determined experimentally, and could lead to an uncertainty in the SLP determination. Luckily, in this report, because our tumor model is well represented by a low perfusion situation, such inaccuracy was not that high. But of course, it would be interesting to also previously determine the perfusion temperature dependence to decrease the number of variables in the simulation.
In addition, in most labs, the MNH intratumoral thermal dose is obtained using data from a single fiber optic thermometer inserted into the tumor (e.g., the center of the tumor). This approach, although better than just evaluating the surface temperature, for example using IRT, is limited to a single position in space. Fig. S8 shows a pilot study measuring the intratumoral temperature during MNH at three distinct positions, inside the tumor, using Mn-ferrite nanoparticles of similar hyperthermia efficiency as MalbIR. It is curious to notice that although the magnetic nanoparticles were injected in the same amount in the three positions, the intratumoral temperature measurements of the probes are in general very distinct. Higher values are not always clearly found at a specific position inside the tumor, at least for the three animals investigated. In particular, the temperature profiles at the tumor center (probe #2) are also very distinct, which might suggest that one should be careful in using this data to establish an intratumoral thermal dose. Table S-V shows the calculations of the thermal damage () and the degree of tissue injury (
) in all the probes for the distinct animals, which again indicates very different thermal dose results.
We believe that the method presented in this report might be better for determining the intratumoral thermal dose, which was found to be position dependent. Anyway, other studies might be interesting too, for example including intratumoral measurements at specific tumor positions, which are planned for the future. However, this was not performed in this study for two reasons: (i) we wish to evaluate a higher number of pixels (thermometers) at the tumor surface, while the fiber optic might affect the surface temperature determination in some positions; and more important (ii) we focus on the long-term pilot in vivo MNH study, and avoided effects related to invasively introducing the fiber optic thermometers.
Finally, we would like to emphasize that the in vivo pilot study reported here might not be able to make claims for therapeutic outcomes, due to the limited number of investigated animals. But, the analysis suggests reasonable explanations for the tumor responses after MNH, and provides the necessary support for the proposed experimental and theoretical methods, at least as a proof-of-concept demonstration. We believe that this could set the fundamentals for developing a new approach to reliable treatment planning for solid and subcutaneous tumor therapy via MNH. But shortly, we aim to make a spatial distribution comparison between histopathology and simulation. However, this is beyond the scope of the present report and will be left for future investigations by the group.
Conclusion
The assessment of thermal dose during the MNH procedure is generally performed using a single thermometer (often intratumoral, therefore invasive). In this report, we developed a noninvasive thermometry methodology, which uses the IR temperature measurements on the animal's skin surface, more specifically, an ROI, with dimensions of 30 25 pixels (19.5
16.25 mm) consisting of 750 ‘thermometers’ that, when compared with realistic-like computer simulations, allowed us to determine the intratumoral three-dimensional degree of tissue thermal injury (
).
The numerical simulations used the three-dimensional reconstruction of the animal's body (by PG), the tumor (by US) and the nano-heaters spatial distribution (by FMT). The pilot in vivo MNH study was performed at 301 kHz and 17.5 kA.m−1 (close to Dutz–Hergt clinical safe criterion) using a multicore magneto-fluorescent nanocarrier, which consists of soft Mn-ferrite nanomagnets, surface coated with BSA containing IR-780 NIR dyes. The FMT method allowed the creation of an interpolation function in three-dimensional space, which is based on the fluorescence (particle concentration) intensity of the voxel at a given point, i.e., establishing a voxel-dependent heat source for MNH simulations.
Realistic computer simulations were validated after sensitivity analysis by comparing numerical results with two experimental data, namely surface temperature measurements from the IRT and the fraction of apoptosis/necrosis lesions in the tumor obtained from histopathology analysis. The sensitivity analysis revealed that low values of the tumor blood perfusion rate are more adequate to describe the studied murine tumor model, while the histopathology analysis established a threshold for irreversible thermal damages within Ehrlich solid tumors that underwent MNH treatment.
The methodology was based on combining histopathology intratumoral lesion information and the agreement of at least 50% between the temperature mapping, calculated and measured at the mice's skin surface, considering a temperature error of ±1 °C due to the curved shape of the tumor and emissivity directional effects. Hence, the approach consists of the matching of 375 pixels/thermometers within the ROITumor, and not just a single reference point, as is usually done in the literature. Numerical analysis of the convective heat constant and the tumor blood perfusion rate revealed the uncertainty in the magnetic hyperthermia efficiency and the fraction of the intratumoral irreversible lesion.
The validation of the computer simulation in this pilot in vivo MNH study, regarding the irreversible tissue thermal injury, happened when comparing the simulation data of animal #1 with the histopathology data. Comparison with simulations revealed a critical lesion for this tumor model of 1.4 (
0.75). Additionally, it was possible to conclude that the animals that had tumoral CR after MNH had an almost complete irreversible tissue lesion, animal #4 with 91 ± 5% and animal #3 with 100%, while the one with tumor recurrence had a much lower value, 56 ± 7%. This result is consistent with reports in the literature, that claim irreversible thermal damages in greater than 80% of the tumor volume, in order to promote the tumoral CR. Hence, from the methodology presented, it might be possible to determine whether an MNH therapeutic procedure will be successful in treating the tumor by selective heat delivery.
Also, the method allowed us to estimate the in vivo MNH heat efficiently from the computer simulations. It is curious to notice that, taking into account the uncertainty analysis, the numerical simulations were found to be in very good agreement with the in vitro experimental result obtained at the same in vivo AMF condition, 112 ± 17 W.g−1. For animal #1
112 ± 7 W.g−1, while for animal #2
83 ± 11 W.g−1, animal #3
114 ± 9 W.g−1 and animal #4
130 ± 10 W.g−1. This results in a mean simulated value of
110 ± 20 W.g−1. The results corroborate our conclusion that the methodology presented has clinical significance.
In conclusion, a new methodology for determining noninvasively the three-dimension intratumoral thermal dose during MNH was developed. The approach is expected to be useful for several in vivo MNH applications, spanning from traditional ablation/hyperthermia studies to heat-induced immunological investigations.
Supplemental Material
Download PDF (29.9 MB)Acknowledgements
The authors thank the LabMic-UFG staff for access to the Transmission Electron Microscopy facilities, the Laboratório de Estrutura e Funcionamento de Comunidades do Departamento de Ecologia/ICB/UFG and Dr. Fausto Nomura for help in the use of the stereomicroscope and Dr. Eliana Martins Lima for access to NTA.
Disclosure statement
The authors declare no conflict of interest.
Additional information
Funding
References
- Maier-Hauff K, Ulrich F, Nestler D, et al. Efficacy and safety of intratumoral thermotherapy using magnetic iron-oxide nanoparticles combined with external beam radiotherapy on patients with recurrent glioblastoma multiforme. J Neurooncol. 2011;103(2):317–324.
- Maier-Hauff K, Rothe R, Scholz R, et al. Intracranial thermotherapy using magnetic nanoparticles combined with external beam radiotherapy: results of a feasibility study on patients with glioblastoma multiforme. J Neurooncol. 2007;81(1):53–60.
- MagForce AG, Inc. Since 2011. MagForce AG holds the European CE certificate and thus official approval of NanoTherm® therapy for the treatment of brain tumors in Germany and all member states of the European Union; 2020; [cited 2020 Apr 10]. Available from: https://magforce.com
- Jordan A, Wust P, Fähling H, et al. Inductive heating of ferrimagnetic particles and magnetic fluids: physical evaluation of their potential for hyperthermia. Int J Hyperthermia. 1993;9(1):51–68.
- Mehdaoui B, Carrey J, Stadler M, et al. Influence of a transverse static magnetic field on the magnetic hyperthermia properties and high-frequency hysteresis loops of ferromagnetic FeCo nanoparticles. Appl Phys Lett. 2012;100(5):052403.
- Weissleder R, Nahrendorf M, Pittet MJ. Imaging macrophages with nanoparticles. Nat Mater. 2014;13(2):125–138.
- Neto LMM, Zufelato N, de Sousa-Júnior AA, et al. Specific T cell induction using iron oxide based nanoparticles as subunit vaccine adjuvant. Hum Vac Immunother. 2018;14(11):1–16.
- Korangath P, Barnett JD, Sharma A, et al. Nanoparticle interactions with immune cells dominate tumor retention and induce T cell-mediated tumor suppression in models of breast cancer. Sci Adv. 2020;6(13):eaay1601.
- Toraya-Brown S, Sheen MR, Zhang P, et al. Local hyperthermia treatment of tumors induces CD8(+) T cell-mediated resistance against distal and secondary tumors. Nanomedicine. 2014;10(6):1273–1285.
- Ito A, Honda H, Kobayashi T. Cancer immunotherapy based on intracellular hyperthermia using magnetite nanoparticles: a novel concept of “heat-controlled necrosis” with heat shock protein expression. Cancer Immunol Immunother. 2006;55(3):320–328.
- Toraya-Brown S, Fiering S. Local tumour hyperthermia as immunotherapy for metastatic cancer. Int J Hyperthermia. 2014;30(8):531–539.
- Atkinson WJ, Brezovich IA, Chakraborty DP. Usable frequencies in hyperthermia with thermal seeds. IEEE Trans Biomed Eng. 1984;31(1):70–75.
- Dutz S, Hergt R. Magnetic nanoparticle heating and heat transfer on a microscale: basic principles, realities and physical limitations of hyperthermia for tumour therapy. Int J Hyperthermia. 2013;29(8):790–800.
- Dutz S, Hergt R. Magnetic particle hyperthermia—a promising tumour therapy? Nanotechnology. 2014;25(45):452001.
- Rodrigues HF, Capistrano G, Bakuzis AF. In vivo magnetic nanoparticle hyperthermia: a review on preclinical studies, low-field nano-heaters, noninvasive thermometry and computer simulations for treatment planning. Int J Hyperthermia. 2020.
- Weaver JB, Rauwerdink AM, Hansen EW. Magnetic nanoparticle temperature estimation. Med Phys. 2009;36(5):1822–1829.
- Hadadian Y, Uliana JH, Oliveira Carneiro AA, et al. A novel theranostic platform: integration of magnetomotive and thermal ultrasound imaging with magnetic hyperthermia. IEEE Trans Biomed Eng. 2020;1.
- Rocha U, Upendra Kumar K, Jacinto C, et al. Nd3+ doped LaF3 nanoparticles as self-monitored photo-thermal agents. Appl Phys Lett. 2014;104(5):053703.
- Rodrigues HF, Mello FM, Branquinho LC, et al. Real-time infrared thermography detection of magnetic nanoparticle hyperthermia in a murine model under a non-uniform field configuration. Int J Hyperthermia. 2013;29(8):752–767.
- Hilger I, Kaiser WA. Iron oxide-based nanostructures for MRI and magnetic hyperthermia. Nanomedicine (Lond). 2012;7(9):1443–1459.
- Di Corato R, Béalle G, Kolosnjaj-Tabi J, et al. Combining magnetic hyperthermia and photodynamic therapy for tumor ablation with photoresponsive magnetic liposomes. ACS Nano. 2015;9(3):2904–2916.
- Espinosa A, Di Corato R, Kolosnjaj-Tabi J, et al. Duality of iron oxide nanoparticles in cancer therapy: amplification of heating efficiency by magnetic hyperthermia and photothermal bimodal treatment. ACS Nano. 2016;10(2):2436–2446.
- Kateb B, Yamamoto V, Yu C, et al. Infrared thermal imaging: a review of the literature and case report. NeuroImage. 2009;47:T154–T162.
- Nishikawa K, Matsudaira H, Suzuki H, et al. Intraoperative thermal imaging in esophageal replacement: its use in the assessment of gastric tube viability. Surg Today. 2006;36(9):802–806.
- Watmough DJ, Fowler PW, Oliver R. The thermal scanning of a curved isothermal surface: implications for clinical thermography. Phys Med Biol. 1970;15(1):1–8.
- Clark JA. Effects of surface emissivity and viewing angle erros in thermography. Acta Thermogr. 1976;1:138–141.
- Rodrigues HF, Capistrano G, Mello F, et al. Precise determination of the heat delivery during in vivo magnetic nanoparticle hyperthermia with infrared thermography. Phys Med Biol. 2017;62(10):4062–4082.
- Housden RJ, Gee AH, Treece GM, et al. Sensorless reconstruction of freehand 3D ultrasound data. In: Larsen R, Nielsen M, Sporring J, editors. Medical image computing and computer-assisted intervention – MICCAI 2006. Vol. 4191. Berlin, Heidelberg: Springer; 2006. p. 356–363.
- Özışık MN, Orlande HRB. Inverse heat transfer: fundamentals and applications. New York: Taylor & Francis; 2000.
- Mital M, Pidaparti RM. Breast tumor simulation and parameters estimation using evolutionary algorithms. Modell Simul Eng. 2008;2008:1–6.
- Mitra S, Balaji C. A neural network based estimation of tumour parameters from a breast thermogram. Int J Heat Mass Transf. 2010;53(21–22):4714–4727.
- Bezerra LA, Oliveira MM, Rolim TL, et al. Estimation of breast tumor thermal properties using infrared images. Signal Process. 2013;93(10):2851–2863.
- Tepper M, Shoval A, Hoffer O, et al. Thermographic investigation of tumor size, and its correlation to tumor relative temperature, in mice with transplantable solid breast carcinoma. J Biomed Opt. 2013;18(11):111410.
- Das K, Mishra SC. Estimation of tumor characteristics in a breast tissue with known skin surface temperature. J Therm Biol. 2013;38(6):311–317.
- Das K, Mishra SC. Non-invasive estimation of size and location of a tumor in a human breast using a curve fitting technique. Int Commun Heat Mass Transfer. 2014;56:63–70.
- Das K, Mishra SC. Simultaneous estimation of size, radial and angular locations of a malignant tumor in a 3-D human breast – a numerical study. J Therm Biol. 2015;52:147–156.
- Herman C. The role of dynamic infrared imaging in melanoma diagnosis. Expert Rev Dermatol. 2013;8(2):177–184.
- Cheng T-Y, Herman C. Involuntary motion tracking for medical dynamic infrared thermography using a template-based algorithm. Proc. SPIE 8669, Medical Imaging 2013: image processing. Vol. 8669; Lake Buena Vista (Orlando Area) (FL); 2013. p. 86692Q-1–11.
- Chanmugam A, Hatwar R, Herman C. Thermal analysis of cancerous breast model. Proceedings of the ASME 2012 International Mechanical Engineering Congress and Exposition. Int Mech Eng Congress Expo. 2012;2012:134–143.
- Hatwar R, Herman C. Inverse method for quantitative characterisation of breast tumours from surface temperature data. Int J Hyperthermia. 2017;33(7):1–17.
- Zhou Y, Herman C. Optimization of skin cooling by computational modeling for early thermographic detection of breast cancer. Int J Heat Mass Transf. 2018;126:864–876.
- Branquinho LC, Carriao MS, Costa AS, et al. Effect of magnetic dipolar interactions on nanoparticle heating efficiency: implications for cancer hyperthermia. Sci Rep. 2013;3:2887.
- Di Corato R, Espinosa A, Lartigue L, et al. Magnetic hyperthermia efficiency in the cellular environment for different nanoparticle designs. Biomaterials. 2014;35(24):6400–6411.
- Vonwil D, Christensen J, Fischer S, et al. Validation of fluorescence molecular tomography/micro-CT multimodal imaging in vivo in rats. Mol Imaging Biol. 2014;16(3):350–361.
- Nunes ADC, Gomes-Silva LA, Zufelato N, et al. Albumin coating prevents cardiac effect of the magnetic nanoparticles. IEEE Trans Nanobiosci. 2019;18(4):640–650.
- Capistrano G, Sousa-Junior AA, Silva RA, et al. IR-780-albumin-based nanocarriers promote tumor regression not only from phototherapy but also by a nonirradiation mechanism. ACS Biomater Sci Eng. 2020;6(8):4523–4538.
- Blüthgen C, Sanabria S, Frauenfelder T, et al. Economical sponge phantom for teaching, understanding, and researching A- and B-line reverberation artifacts in lung ultrasound. J Ultrasound Med. 2017;36(10):2133–2142.
- Schindelin J, Arganda-Carreras I, Frise E, et al. Fiji: an open-source platform for biological-image analysis. Nat Methods. 2012;9(7):676–682.
- Hartig SM. Basic image analysis and manipulation in ImageJ. Curr Protoc Mol Biol. 2013;102(1):14–15.
- Moritz AR, Henriques FC. Studies of thermal injury: II. The relative importance of time and surface temperature in the causation of cutaneous burns. Am J Pathol. 1947;23(5):695–720.
- Pearce JA. Comparative analysis of mathematical models of cell death and thermal damage processes. Int J Hyperthermia. 2013;29(4):262–280.
- Pearce JA. Relationship between Arrhenius models of thermal damage and the CEM 43 thermal dose. Proc. SPIE 7181, Energy-based Treatment of Tissue and Assessment V. Vol. 718104; San Jose, CA; 2009. p. 718104-1–15.
- Pennes HH. Analysis of tissue and arterial blood temperatures in the resting human forearm. J Appl Physiol. 1948;1(2):93–122.
- Wissler EH. Pennes' 1948 paper revisited. J Appl Physiol. 1998;85(1):35–41.
- Erdmann B, Lang J, Seebass M. Optimization of temperature distributions for regional hyperthermia based on a nonlinear heat transfer model. Ann N Y Acad Sci. 1998;858:36–46.
- Lang J, Erdmann B, Seebass M. Impact of nonlinear heat transfer on temperature control in regional hyperthermia. IEEE Trans Biomed Eng. 1999;46(9):1129–1138.
- LeBrun A, Ma R, Zhu L. MicroCT image based simulation to design heating protocols in magnetic nanoparticle hyperthermia for cancer treatment. J Therm Biol. 2016;62(Pt B):129–137.
- Trakic A, Liu F, Crozier S. Transient temperature rise in a mouse due to low-frequency regional hyperthermia. Phys Med Biol. 2006;51(7):1673–1691.
- Varma DR. Free DICOM browsers. Indian J Radiol Imaging. 2008;18(1):12–16.
- INMETRO, CICMA, SEPIN. Avaliação de dados de medição: Guia para a expressão de incerteza de medição – GUM 2008. 1a Edição Brasileira da 1a Edição do BIPM de 2008. Duque de Caxias, RJ; 2012.
- Song CW, Lokshina A, Rhee JG, et al. Implication of blood flow in hyperthermic treatment of tumors. IEEE Trans Biomed Eng. 1984;31(1):9–16.
- Jain RK, Ward-Hartley K. Tumor blood flow-characterization, modifications, and role in hyperthermia. IEEE Trans Son Ultrason. 1984;31(5):504–525.
- Lüdemann L, Sreenivasa G, Amthauer H, et al. Use of H(2) (15)O-PET for investigating perfusion changes in pelvic tumors due to regional hyperthermia. Int J Hyperthermia. 2009;25(4):299–308.
- Delorme S, Krix M. Contrast-enhanced ultrasound for examining tumor biology. Cancer Imaging. 2006;6:148–152.
- Viglianti BL, Lora-Michiels M, Poulson JM, et al. Dynamic contrast-enhanced magnetic resonance imaging as a predictor of clinical outcome in canine spontaneous soft tissue sarcomas treated with thermoradiotherapy. Clin Cancer Res. 2009;15(15):4993–5001.
- Lee J-H, Jang J, Choi J, et al. Exchange-coupled magnetic nanoparticles for efficient heat induction. Nat Nanotechnol. 2011;6(7):418–422.
- Abdullahi A, Amini-Nik S, Jeschke MG. Animal models in burn research. Cell Mol Life Sci. 2014;71(17):3241–3255.
- Gomaa I, Saraya HO, Zekri M, et al. In vivo suppression of solid Ehrlich cancer via chlorophyllin derivative mediated PDT: an albino mouse tumour model. Optical methods for tumor treatment and detection: mechanisms and techniques in photodynamic therapy XXIV. Int Soc Opt Photon. 2015;9308:930813.
- Crile G. Selective destruction of cancers after exposure to heat. Ann Surg. 1962;156:404–407.
- Crile G. The effects of heat and radiation on cancers implanted on the feet of mice. Cancer Res. 1963;23:372–380.
- Suit HD. Hyperthermic effects on animal tissues. Radiology. 1977;123(2):483–487.
- Dennis CL, Jackson AJ, Borchers JA, et al. Nearly complete regression of tumors via collective behavior of magnetic nanoparticles in hyperthermia. Nanotechnology. 2009;20(39):395103.
- Oleson JR, Samulski TV, Leopold KA, et al. Sensitivity of hyperthermia trial outcomes to temperature and time: implications for thermal goals of treatment. Int J Radiat Oncol Biol Phys. 1993;25(2):289–297.
- Gu Q, Joglekar T, Bieberich C, et al. Nanoparticle redistribution in PC3 tumors induced by local heating in magnetic nanoparticle hyperthermia: in vivo experimental study. J Heat Transfer. 2019;141(3):032402.