
Abstract
Purpose
To explore the differences in ablation zone between liver cirrhosis and normal liver background and investigate the effect of hepatic blood flow on ablation zone of RFA.
Methods
Between 2017 and 2019, 203 patients who had liver malignancies and underwent percutaneous RFA with Celon bipolar electrodes enrolled into this study. There were 90 patients had liver cirrhosis and 113 patients had normal liver background. They were 63 females and 140 males with average age of 59.0 ± 10.9 years old. Contrast-enhanced CT/MRI was used to evaluate the ablation zone in one month after RFA. The hepatic flow measurements on CDFI and CEUS were performed before RFA. Correlations between ablation zone versus hepatic flow were assessed using multiple linear regression analysis.
Results
The average ablation zone in cirrhotic liver was significantly larger than those in normal liver background with 3 cm tip of RF electrodes (length 3.5 ± 0.5 vs 3.1 ± 0.4 cm, p = 0.001; width 2.6 ± 0.3 vs 2.2 ± 0.3 cm, p < 0.001; thickness 2.5 ± 0.3 vs 2.0 ± 0.2 cm, p < 0.001). The similar result was found with three 4 cm tip of RF electrodes (width 3.6 ± 0.5 vs 3.1 ± 0.5 cm, p = 0.019; thickness 3.3 ± 0.5 vs 2.7 ± 0.5 cm, p = 0.002). The multiple linear regression analysis showed arrive time of hepatic vein and portal vein was statistically associated with ablation zone with 3 cm electrodes (p < 0.001, p = 0.001), but explained part of the variance (Adjusted R2=0.294, adjusted R2=0.212).
Conclusion
The ablation zones of RFA with multi-bipolar electrodes in liver cirrhosis were significantly larger than those in normal liver background, being up to 6 mm in thickness. The hepatic flow parameters partly contributed to the ablation zone.
Introduction
Radiofrequency ablation (RFA) has gained considerable attention as an image-guided, minimally invasive alternative to surgical resection for the treatment of focal primary and secondary liver malignancies [Citation1–3]. In a relatively recent study of RFA as a first-line therapy of early hepatocellular carcinoma (HCC), the cumulative local tumor progression rate was reported as 2.4–27% [Citation4]. In the other hand, for the percutaneous RFA of metastatic liver cancer (MLC) originating from colorectal tumors, local tumor progression rate was up to 60% [Citation5]. As we known, the tumor biology is the main factor for long-term outcome. But the local tumor control is likely related to ablation technique and treatment protocol. The substantial variation in the reported local tumor progression rate between HCC and MLC suggests that there is tissue-to-tissue variability in RFA efficacy. It was reported that more than 80% HCC were developed in the basis of liver cirrhosis while liver metastases were usually found in normal liver [Citation6,Citation7]. Besides the biology features of HCC and MLC, knowing the differences in ablation range between the two kinds of liver backgrounds would play an important role in planning treatment protocol before RFA.
The tumor size, equipment selection, characteristics of tissue that surrounds tumor, including vascularity and electric conductivity, could affect local ablation outcome [Citation8–10]. Of these, hepatic blood flow is a perplexing variable that has been shown to influence the success rate of complete tumor eradication [Citation11–14]. Several studies have shown that the overall size of RFA lesions is inversely related to hepatic blood flow owing to perfusion-mediated vascular cooling effect [Citation13,Citation15–19]. However, previous studies were performed with ex vivo models or animals such as live porcine liver, thus, it may be difficult to extrapolate the findings to those in patients with cirrhosis and/or tumors. The accurate variation in RF induced ablation zone between different liver background need to be confirmed in real clinical practice but not in models. Based upon this, we performed a prospective clinical study to compare the difference in multi-bipolar ablation zone between liver cirrhosis and normal liver background and to investigate the association between hepatic flow parameters and ablation zone.
Materials and methods
This was a prospective study in an academic institution. This clinical study was approved by the local ethics committee of our institution and the need for informed consent was waved.
Patients
The inclusion criteria of liver tumors (HCC and MLC) for ultrasound guided percutaneous RFA (local curative purpose) were as follows: (1) a tumor size ≤ 5 cm and tumor number ≤ 3; (2) an absence of significant direct tumor invasion of adjacent organs or tumor thrombi in the main or lobar portal system; (3) a tumor not invading a main bile duct or being obviously exophytic; (4) a tumor accessible via a percutaneous approach; (5) international standard ratio < 1.6 and platelet count > 50,000/μl; (6) No extrahepatic metastasis or local extrahepatic metastasis had good control before RFA.
The exclusion criteria for this study included: (1) the patients received previous treatment such as TACE, hepatectomy, chemotherapy before RFA; (2) difficult tumor locations (the tumor was close to large vessels or nearby capsule and organs with distance <1cm); (3) the patients had severe fatty liver or other diffused liver disease; (4) the ablation protocol was changed during the treatment.
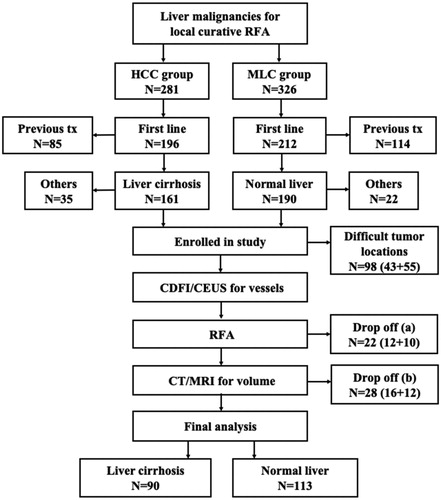
From 2017 to 2019, 607 consecutive patients with 1204 liver malignancies who underwent ultrasound guided percutaneous RFA with bipolar electrodes in our center, including 281 HCC patients and 326 MLC patients. In HCC patients, 191 were excluded because of previous treatment (n = 85), no liver cirrhosis (n = 35), difficult tumor locations (n = 43), changes in RFA protocol during treatment (n = 12) and miss of follow up with CT/MRI in one month (n = 16). The rest 90 HCC patients had a definite diagnosis of liver cirrhosis background according to the specific imaging features by at least two imaging modalities (liver cirrhosis group) [Citation20–22]. In MLC patients, 213 were excluded because of previous treatment (n = 114), sever fatty liver or liver diffused disease (n = 22), difficult tumor locations (n = 55), changes in RFA electrode placement (n = 10) and missed follow up of CT/MRI in one month (n = 12) (). The rest 113 MLC patients had a normal liver background without severe fatty liver or diffused liver disease (normal liver group).
Figure 1. The flow chart for patient enrollment. RFA: radiofrequency ablation; HCC: hepatocellular carcinoma; MLC: metastatic liver cancer; Tx: treatment. Drop off: (a) The electrodes were moved during the RFA treatment. (b) The patients missed follow up of CT/MRI in one month.
Color Doppler flow imaging (CDFI) and contrast-enhanced ultrasound (CEUS)
All enrolled patients received CDFI and CEUS for evaluation of the hepatic flow parameters before RFA and the data was compared between liver cirrhosis and normal liver. All sonographic examinations were carried out by one of two radiologists (YW, WS.) with more than 10, 5 years of experience in liver CEUS procedures. All examinations of CDFI and CEUS were performed with the same ultrasound machine using a 1- to 5-MHz convex-array transducer (Logiq E9, GE Healthcare, Milwaukee, WI, USA).
Firstly, the maximum velocity of hepatic artery, portal vein and hepatic vein was measured on CDFI three times and take the mean value. The sampling width was set according to the diameter of the vessel, and the sampling frame steer between the ultrasound beam and the vessel was equal to or <60° in all measurement procedures. The places to measure were as follows: the right hepatic artery at the first hilar, the right branch of portal vein, the right hepatic vein (at least 3 cm from the confluence).
After that, CEUS was performed with harmonic imaging. To minimize variation, the settings of the scanner such as mechanical index (MI) (the MI used in the present study was 0.11–0.13), dynamic range and gain and frequency were kept constant, and the time gain compensation was off. Before the contrast examination, every patient was instructed on breath holding and shallow breathing to minimize the variation caused by motion. The probe was placed over the right hepatic vein and right branch of portal vein. If an acceptable signal could not be obtained from this vein due to abdominal gas, the scan was made over the left or middle hepatic vein. Then, we observed the cine images with frame-by-frame playback to measure the arrive time (AT), which defined as the first frame showing that the arrival of the contrast agent in the right hepatic artery, right portal vein or hepatic vein on CEUS. The ultrasound contrast agent used in our study was SonoVue® (Bracco Spa, Milan, Italy), which consists of lipid-stabilized microbubbles of an innocuous sulfur hexafluoride gas with low solubility. SonoVue was injected intravenously as a 1.5- to 2.0-ml bolus via a 20-gauge cannula at a rate of 1-ml/s, followed by a 5-ml saline flush at the same rate.
RFA methods and instruments
RF ablation was conducted with 3 cm or 4 cm bipolar electrodes (Celon, Progsurg, Telow, Germany). All RFA procedures were performed by two of four radiologists (YK, WW, WS and YW) who each had more than 10 years of experience in ultrasound-guided interventional procedures. Treatments were planned based on a combination of CT/MRI and ultrasound before the procedure. A circumferential ablative margin covering at least 0.5 cm (ideally 1 cm) beyond the target tumor was planned in the preoperative protocol. Targeting, monitoring, and intraprocedural modification were all performed during the procedure with real-time ultrasound and enhanced ultrasound if necessary.
During RFA, moderate intravenous sedation was administered to all patients using 2.5–5mg of midazolam (Roche; Basel, Switzerland) and 50–100 mg of fentanyl (Fentaini; Renfu, Yichang, China). The puncture points were determined by ultrasound guidance before the procedure, and local infiltration of anesthesia for the puncture points was achieved with 5–15 ml of 1% lidocaine (Liduokayin; Yimin, Beijing, China). The patients were conscious when the RFA electrode was placed and the anesthesiologist continuously monitored the heart rate, blood pressure and oxygen saturation during the procedure. Track ablation was performed in all patients when withdrawing the RFA electrodes. After RFA, the patient remained in the hospital overnight for observation. Ultrasonography examination was performed 24 h after RFA to monitor complications. Patients were then discharged if no evidence of active bleeding was found.
The Celon RFA system used in this study provides a maximum power output of 250 W and can connect two to three 15- to 20-cm long electrodes with an exposed tip of 3–4 cm. The output power was set at 30–40 W for 3 cm long electrodes, 40–50 W for 4 cm tip electrodes according to the manufacturer’s recommendations. The multiple electrodes were placed at the edge of tumor with fixed distance (≤2.0 cm for 3 cm tip electrode and ≤2.5 cm for 4 cm tip electrode according to our previous animal experiments and operation manual). The electrodes were placed being parallel to each other during RFA treatment. We monitored and measured the distance between the hyperechoic tips of RF electrodes on multiple-planes ultrasound scanning. The distance of the electrodes was measured and recorded between every two electrode tips. The minimum distance was adopted in this study when using three electrodes. The electrodes placement mode, distance of electrodes, RF application time and impendence were recorded and compared.
Contrast-enhanced CT/MRI for ablation zone evaluation
Contrast-enhanced CT/MRI was performed in one month post RFA treatment to evaluate the technical success. In this study, the imagine data was also used to assess the ablation zone by a radiologist (CK) with more than 15 years of experience in liver imaging. All of the ablation zones were measured on portal phase images on a PACS workstation including length, width, thickness without knowing the information of patients. The length was defined as the maximum diameter of the ablation zone on axial section, width as the maximum diameter vertical to the length on the same plane and thickness as the maximum diameter vertical to the needle shaft on the coronary section. The volume (V) of the ablation zone was calculated by using the formula for an ellipsoid: V = 4/3π(length/2)(width/2)(thickness/2). In local recurrence cases, we only delineated the non-enhancement area on portal phase images with referring to the arterial phase features. The wash out area for viable tissues would be excluded in the measurement.
Statistical analysis
All data were expressed as mean ± standard deviation. The significance of differences in the baseline characteristics, hepatic flow parameters and ablation zone results were compared by the Chi-squared test and independent-sample t-test. A backward stepwise multiple linear regression models were applied to examine the correlation between ablation zones (including length, width, thickness and volume) and hepatic flow parameters (including arrival time of hepatic artery, portal vein and hepatic vein), distance of the electrodes and maximum diameter of tumors. Residual analysis was used to assess the normality assumption. The model fit the following criterion as previous reported [Citation23]. Statistical significance was defined as p < 0.05. All data analysis was performed by using SPSS version 24.0 (SPSS, Chicago, IL, USA).
Results
Comparison of baseline characteristics of patients and treatment parameters
Finally, 109 HCCs (90 patients) with liver cirrhosis background (liver cirrhosis group) and 174 MLCs (113 patients) with normal liver background (normal liver group) were analyzed in this study. They were 63 females and 140 males with average age of 59.0 ± 10.9 years old (range 32–88 years old). There was no significant difference in age, tumor size, tumor location, electrode placement mode, electrode distance, RF impedance, application time between the two groups ().
Table 1. Comparison of baseline profiles of patients with liver malignancies between liver cirrhosis and normal liver groups.
In liver cirrhosis group, all patients had HCC tumors which was histologically proven (n = 52) or based on the clinical diagnostic criteria used by the European Association for the Study of the Liver [Citation24] (n = 38). The liver cirrhosis was caused by hepatitis B in 86 patients, hepatitis C in 4 patients. There were 85 patients had liver function of Child-Pugh class A and the other 5 had class B. The maximum diameter of the HCCs was 2.3 ± 0.8 cm (range: 1.3–4.8 cm). Regarding to liver fibrosis degree, 3% (3/90) of the patients had FIB-4 < 1.3, 29% (26/90) of the patients had FIB-4 of 1.3 ∼ 3.25, and 68% (61/90) of the patients had FIB-4 > 3.25. In normal liver group, there were 83 MLC patients had original cancer from gastrointestinal cancer, 19 from breast cancer, and 11 from lung cancer. The mean maximum diameter of the MLCs was 2.2 ± 0.8 cm (range: 1.1–4.8 cm).
Comparison of ablation zone after RFA
According to enhanced CT/MRI, the means and standard deviations of the length, width, thickness and volume of ablation zone were summarized in . With two 3 cm tip RF electrodes, the average ablation zone in liver cirrhosis group was significantly larger than those in normal liver group (length 3.5 ± 0.5 vs 3.1 ± 0.4 cm, p = 0.001; width 2.6 ± 0.3 vs 2.2 ± 0.3 cm, p < 0.001; thickness 2.5 ± 0.3 vs 2.0 ± 0.2 cm, p < 0.001; volume 11.2 ± 3.6 vs 7.3 ± 2.2 cm3, p < 0.001), and the difference in thickness between the two groups was the largest, being up to 0.5 cm. Similarly, the average ablation zone in cirrhotic liver was significantly larger than those in normal liver with three 3 cm tip RF electrodes (length 4.0 ± 0.4 vs 3.5 ± 0.5 cm, p = 0.001; width 3.0 ± 0.4 vs 2.5 ± 0.4 cm, p = 0.006; thickness 2.7 ± 0.4 vs 2.3 ± 0.3 cm, p = 0.004; volume 15.8 ± 4.8 vs 10.6 ± 3.9 cm3, p = 0.001), and the largest difference was found in length and width measurement between the two groups, being up to 0.5 cm ( and ).
Figure 2. A 54-year-old male had hepatocellular carcinoma with liver cirrhosis. α-AFP was 1848 ng/ml, CEA was 0.97 ng/ml, and CA-199 was 15.02 U/ml. (a) Contrast-enhanced ultrasound (CEUS) before radiofrequency ablation (RFA) showed the tumor size was 2.4 × 1.8 cm. (b) RFA was performed under ultrasound guidance with three 3 cm tip RF electrodes and the distance of electrodes was 1.3 cm. One month follow up contrast enhanced computed tomography on axial section (c) and sagittal section (d) showed the ablation zone (△) had no enhancement and the ablation zone was approximately sphere. The length, width and thickness of ablation zone was 4.0 cm, 3.5 cm, 3.2 cm, respectively.
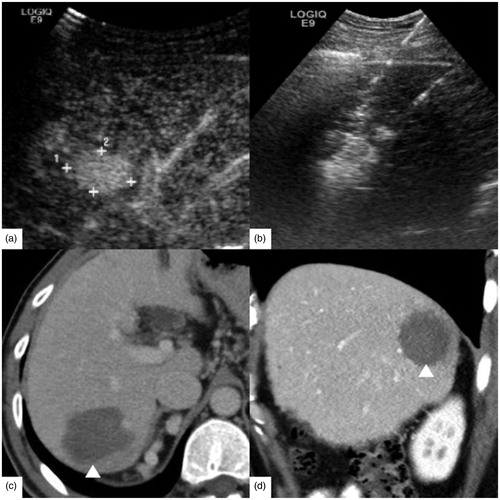
Figure 3. A 63-year-old female had rectal carcinoma with liver metastasis. CEA was 5.27 ng/ml, CA-199 was 143.8 U/ml and α-AFP was 2.10 ng/ml. (a) Contrast-enhanced ultrasound (CEUS) before RFA showed the tumor size was 2.4 × 1.6 cm. (b) RFA was performed with three 3 cm tip RF electrodes and the distance of electrodes was 1.3 cm. Contrast enhanced computed tomography in one month on axial section (c) and sagittal section (d) showed the ablation zone (△) had no enhancement and the ablation zone was approximately ellipsoid. The length, width and thickness of ablation zone was 2.8 cm, 2.0 cm, 1.9 cm, respectively.
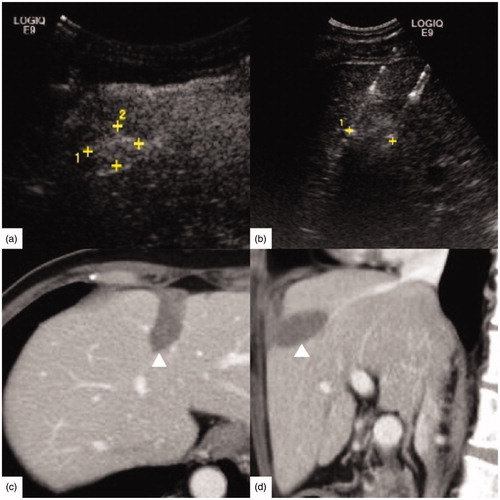
Table 2. Comparison of ablation zone with 3 cm and 4 cm tip RF electrodes between liver cirrhosis and normal liver groups.
For three 4 cm tip RF electrodes, the ablation zones of the liver cirrhosis group were larger than those of the normal liver group in the width (3.6 ± 0.5 cm vs 3.1 ± 0.5 cm, p = 0.019), thickness (3.3 ± 0.5 vs 2.7 ± 0.5 cm, p = 0.002) and volume (30.8 ± 10.5 vs 19.8 ± 8.9 cm3, p = 0.004), but not in the length (4.8 ± 0.8 vs 4.2 ± 0.7 cm, p = 0.060). And the largest difference was seen in thickness measurement between the two groups, up to 0.6 cm ( and ). There was no significant difference in the size of ablation zones between the liver cirrhosis group and the normal liver group with two 4 cm tip RF electrodes (length 4.4 ± 0.4 vs 4.3 ± 0.7 cm, p = 0.876; width 2.7 ± 0.2 vs 2.4 ± 0.2 cm, p = 0.262; thickness 2.4 ± 0.1 vs 2.3 ± 0.1 cm, p = 0.374; volume 14.6 ± 3.2 vs 12.5 ± 2.9 cm3, p = 0.447). Based on one month enhanced CT/MRI, technique effectiveness (complete ablation) was achieved in 99% (201/203) of patients after RFA treatment. The peripheral nodular recurrence was found in two patients of normal liver group.
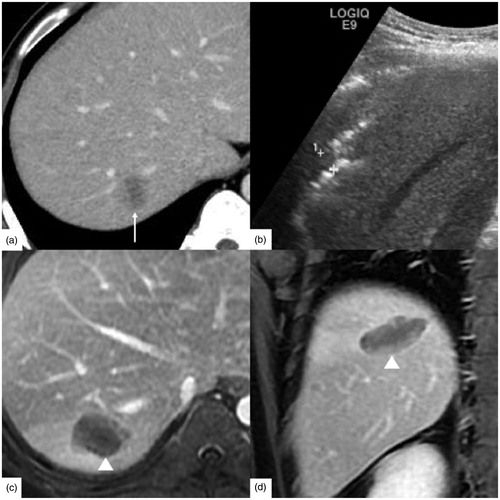
Figure 4. A 65-year-old male had hepatocellular carcinoma with liver cirrhosis. CEA was 1.61 ng/ml, α-AFP was 2.14 ng/ml and CA-199 was 10.20 U/ml. (a) Enhanced magnetic resonance imaging (MRI) before radiofrequency ablation (RFA) showed the tumor size was 2.6 × 2.3 cm (↑). (b) RFA was performed under ultrasound guidance with three 4 cm tip RF electrodes and the distance of electrodes was 1.6 cm. One month follow up contrast enhanced computed tomography on axial section (c) and coronary section (d) showed the ablation zone (△) had no enhancement. The length, width and thickness of ablation zone was 5.5 cm, 4.0 cm, 3.7 cm, respectively.
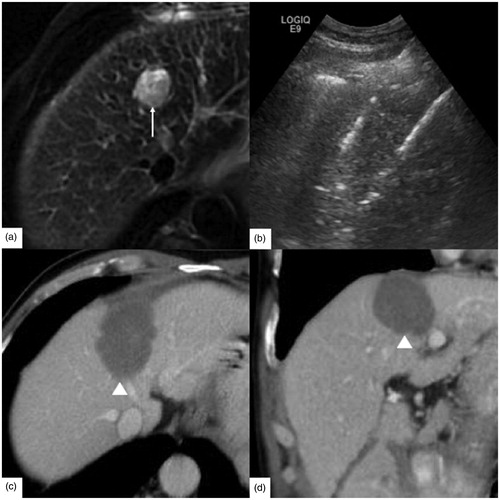
Figure 5. A 39-year-old male had rectal carcinoma with liver metastasis. CEA was 30.06 ng/ml, α-AFP was 10.36 ng/ml, CA-125 was 14.70 U/ml and CA-199 was 23.01 U/ml. (a) The tumor was hypodense at the portal venous phase of contrast enhanced computed tomography before radiofrequency ablation (RFA). And the tumor size was 2.5 × 2.0 cm (↑). (b) RFA was initiated under ultrasound guidance with three 4 cm tip RF electrodes and the distance of electrodes was 1.5 cm. One month follow up enhanced magnetic resonance imaging (MRI) on axial section (c) and coronary section (d) showed the ablation zone (△) had no enhancement and the length, width and thickness of ablation zone was 4.2 cm, 2.8 cm, 2.5 cm, respectively.
Comparison of hepatic flow parameters
According to CDFI, the differences in the mean maximum velocity of hepatic vessels between liver cirrhosis group and normal liver group were shown in . There was no significant difference in hepatic blood flow velocity between the two groups in hepatic artery (66.1 ± 24.8 vs 49.6 ± 15.1 cm/s, p = 0.105), in portal vein (18.6 ± 2.9 vs 19.3 ± 3.9 cm/s, p = 0.463), and in hepatic vein (20.2 ± 14.5 vs 24.9 ± 8.9 cm/s, p = 0.207).
Table 3. Comparison of the maximum flow velocity and arrival time of hepatic vessels between liver cirrhosis and normal liver background with color Doppler flow imaging and contrast-enhanced ultrasound.
Based on CEUS finding, the AT of hepatic artery, portal vein and hepatic vein in cirrhosis group was significantly longer than those in normal liver group () (hepatic artery, 15.6 ± 4.6 vs 14.4 ± 3.2 s, p = 0.029; portal vein, 21.5 ± 5.6 vs 18.9 ± 4.0 s, p < 0.001; hepatic vein, 28.6 ± 6.7 vs 24.4 ± 4.5 s, p < 0.001).
Linear regression analysis between the hepatic flow parameters and the ablation zone
The multiple linear correlation model estimates with the backward stepwise models were shown in . For two 3 cm electrodes, the width, thickness and volume were significantly associated with the arrival time of hepatic vein (adjusted R2=0.217, adjusted R2=0.289, adjusted R2=0.294) (). Meanwhile the length of ablation zone was statistically associated with the arrival time of hepatic vein and the maximum diameter of the tumor (adjusted R2=0.196). For three 3 cm electrodes, the length of ablation zone was significantly associated with the arrival time of portal vein (adjusted R2=0.212). There was no linear correlation between width/thickness/volume of ablation zone and enrolled independent variables with three 3 cm electrodes.
Figure 6. The simple linear regression analysis between ablation zone of two 3 cm electrodes and the arrival time (AT) of hepatic vein. The width (a), thickness (b) and volume (c) were statistically associated with the AT of hepatic vein (Adjusted R2 = 0.271, adjusted R2 = 0.289, adjusted R2 = 0.294; p < 0.001, p < 0.001, p < 0.001).
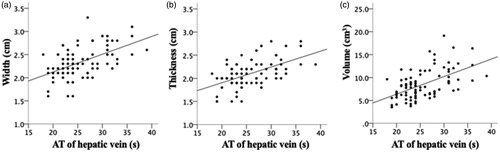
Table 4. Multiple linear regression analysis between ablation zone and the hepatic flow parameters.
For three 4 cm electrodes, there were statistically association between width, volume and the maximum diameter of tumor (adjusted R2=0.359, adjusted R2=0.210). No significant association was found between length or thickness of ablation zone and enrolled independent variables. There was no linear correlation with two 4 cm electrodes.
Discussion
As RFA is increasingly applied in a wide range of tumor and tissue types, further characterization and understanding of the role of intrinsic tumor and tissue characteristics will be required to optimize RF energy delivery paradigms and tumor coagulation. A precise delineation of this relationship would be useful for predicting the ablative size of RFA and improving RF ablation treatment planning. Regarding to the effect of liver tissue background on the ablation sizes, Liu et al. [Citation25] firstly observed the ‘oven effect’ in RFA treatment. In essence, the cirrhotic tissue around the tumor might behave like a thermal insulator, increasing heat retention within the tumor and preventing heating outside the tumor. In the following years, many researchers further explored the underline mechanism and influence of oven effect in liver tumors. Many researches using in vivo and in vitro liver models have demonstrated the inverse linear correlations with blood flow rate in the size of ablation lesions [Citation13,Citation16,Citation17]. Our study was the first clinical study to confirm the average size of ablation zone in cirrhosis liver was significantly larger than those in normal liver background with bipolar RF ablation, and provided the difference quantitatively (0.5–0.6 cm difference in maximum diameter). These clinical findings proved the experimental results of many previous studies and provided the helpful information to estimate the safe margin before RFA in different cases.
Previously, Cassinotto et al. [Citation26] have performed a retrospective study in 111 patients and reported that there was no difference in the ablation zone volume between cirrhotic and healthy liver at three time points after RFA. However, their study was performed with cluster electrode which was different with the bipolar RF ablation device in our study. Also, due to the limit of retrospective study in Cassinotto’s report, 30 of 83 lesions in the cirrhosis group and 21 of 57 lesions in the healthy liver group were treated using additional overlapping applications. The additional overlapping application possibly changed the size of final ablation zone. In our prospective study, only the lesions ablated with designed RFA protocol and the lesions had proper locations were enrolled, which would help to control the confounding factors. We only measured the ablation zone once at one month after RFA, which might not completely reflect the process that ablation zone decreased in size and volume gradually.
Some researches with computer modeling have shown that variation in hepatic blood flow is the primary variable controlling the ablation zone produced by RFA in the liver [Citation15,Citation18]. And further verifications in clinical settings are required. Analyzing the above data, we concluded that for liver cirrhosis tissue, heat deposited intra-tumor more easily due to lack of blood supply, while the normal liver background of metastatic cancer was usually with high blood flow perfusion along with the perfusion-mediated vascular cooling effect. To assess the hepatic perfusion, CDFI as the safe, repeatable and noninvasive investigations, are widely used for the measurement of hepatic blood flow. Previous studies have reported that maximum hepatic vein velocity was higher whereas maximum portal vein velocity was lower in cirrhotic liver compared to normal liver [Citation27,Citation28]. But our study showed that there was no significant difference in maximum hepatic blood flow velocity between the liver cirrhosis and normal liver group. Other studies have reported that the sensitivity and specificity of CDFI for liver cirrhosis are unacceptably low and that there is no correlation between ultrasound findings and the histological stage of fibrosis on liver biopsy [Citation29]. Thus, CDFI may not be the proper tool to assess the hepatic flow parameters according to our study.
In recent years, CEUS has been widely used to improve the detection and specificity of liver tumors [Citation30,Citation31]. Microbubble contrast agents increase the signal intensity from the blood after their injection, which improves Doppler US examinations. In addition, the recently developed methodology of CEUS has expanded the potential of ultrasound in liver hemodynamic studies [Citation32,Citation33]. In our study, the AT of hepatic artery, portal vein and hepatic vein in liver cirrhosis group was statistically later than those of normal liver background. Several researches have noted that ATs of hepatic artery and hepatic vein were shorter in MLCs than that in healthy liver due to the arterialization of livers occurred with metastases [Citation30,Citation31]. The arterial portion of blood supply increases to more than one third of the total liver supply and these changes occurred at an early microscopic stage of metastasis formation [Citation34]. Meanwhile, both experimental and clinical studies have demonstrated that AT of the hepatic vein was also earlier in cirrhotic liver than it does in healthy liver due to the intrahepatic shunts and hyperdynamic circulations [Citation32,Citation33]. To our knowledge, the AT of hepatic vessels between HCCs and MLCs in different backgrounds has not been adequately investigated. In cirrhotic liver, capillarization of the sinusoids with loss of endothelial fenestration and increased tone of activated hepatic stellate cells (HSCs) increase the mechanical resistance to portal blood flow and augment hepatic vascular tone. And with the progression of chronic liver disease, intrahepatic fibrous septation formed, the increase in intrahepatic vascular resistance decreases the portal fraction of liver perfusion [Citation35,Citation36]. Thus, the contrast agent entered the hepatic vessels slowly and the time of the microbubbles remaining in hepatic sinusoids was prolonged. Thus the prolonged AT of CEUS in liver cirrhosis may be related to the above reasons.
In our study, we next investigated the correlation between ablation zone and potential affecting factors, including ATs of hepatic artery, portal vein and hepatic vein, maximum diameter of the tumor, distance of the electrodes, and established multiple linear regression models. We found the significant correction between AT of hepatic vein and ablation width, thickness and volume. However, the maximum value of adjusted R2 for hepatic flow parameters was 0.294, suggesting that this model could only explain part of the variance of the data. As we mentioned, Dodd et al. [Citation13] reported that long-axis diameter, short-axis diameter and volume of RF ablation demonstrated a significant inverse relationship with flow rate in an ex vivo blood-perfused bovine liver model. In the experimental study, the liver was perfused with autologous blood via the portal vein at 60, 70, 80, 90, and 100 ml/min per 100 g of liver tissue. However, in real patients, the difference in PV flow rate was little (18.6 ± 2.9 vs 19.3 ± 3.9 cm/s). We considered the variety of flow rate was too small to calculate a perfect R2 value. Ahmed M et al. [Citation18,Citation37] have identified that the characteristics of tissue that surrounds tumor affected the ablation outcome, including vascularity, thermal and electrical conductivity, and optimal combinations of thermal and electrical conductivity can partially negate the effect of vascular perfusion. These results suggested there should be other important factors caused the difference in ablation zone between liver cirrhosis and normal liver beyond the hepatic hemodynamics.
Whatever the reason under difference in ablation zone of RFA between liver cirrhosis and normal liver, knowing the difference would help us achieve safe ablation margin in tumor ablation. It has been recognized that margin size is an independent predictor of local tumor progression after ablation of colon cancer liver metastases by recently studies [Citation38,Citation39]. Our clinical data provided important information in RFA of liver tumors. With the same equipment and protocol, the ablation zone showed significant difference in different backgrounds. For example, in a patient with a 2 cm hepatic tumor, 3 cm tip RF electrodes might be adequate to eradicate the HCC under liver cirrhosis background. Due to the oven effect from cirrhotic liver, the ablation zone of 3 cm tip RF electrode would be enough for 2 cm HCC (0.5 cm safe margin). However, due to the cooling effect from normal liver, the ablation zone would be smaller. The ablation zone of 3 cm tip RF electrode would be not enough for 2 cm MLC (<0.5 cm safe margin). Then 4 cm tip RF electrode was required to ablate the 2 cm MLC tumor. Thus the RFA protocol would be adjusted for the same size of liver tumors in different backgrounds. This result may provide precise treatment planning and help to minimize both over- and under-treatment of tumors.
Our study had several limitations. First, the patients in liver cirrhosis group were not further classified by mild, moderate or severe degree of liver cirrhosis. Generally, the degree of liver cirrhosis was assessed by invasive pathological examination, which was not regularly performed for local ablation patients. It is more feasible to diagnose liver cirrhosis with imaging modalities with specific features in clinical work. Secondly, we conducted this clinical study with only one RF ablation advice- bipolar RF electrode. Unlike monopolar RF ablation, the liver background might have different effect on the size or shape of ablations created by the bipolar RF ablation device. Our results need to be further confirmed with more kinds of RF ablation advice and more centers of patients in the future. Thirdly, our results indicated that the hepatic vessels parameters gained by CDFI or CEUS could not be used independently to predict ablation size in RFA application. And AT could be affected by many factors such as cardiac function, heart rate, position of the patient. We chose these two methods to assess hepatic flow because these tools were currently feasible and safe in clinical work. The better way to reflect liver perfusion or measurement of liver tissue heat conductivity was required in the further study.
In conclusion, the difference in ablation zone of RF ablation between cirrhotic liver and normal liver was 0.5–0.6 cm. This data was clinical application related and could permit better design of ablation algorithms and thereby improve patient outcomes. Although the ablation zones have statistically linear correlations with AT of hepatic vein and portal vein when using two 3 cm tip or three 4 cm tip RFA electrode. The adjusted R2 value was not good enough to sufficiently explain their variability. Thermal and electrical conductivity in liver tissues can partially negate the effect of vascular perfusion and the further study was needed in the future.
Acknowledgements
The authors thank all the medical staff for their concerted efforts to fight against the 2019 novel coronavirus (COVID-19).
Disclosure statement
The authors declare that there are no conflicts of interest regarding the publication of this paper.
Additional information
Funding
References
- Ahmed M, Solbiati L, Brace CL, et al.; Standard of Practice Committee of the Cardiovascular and Interventional Radiological Society of Europe. Image-guided tumor ablation: standardization of terminology and reporting criteria-a 10-year update. Radiology. 2014;273:241–260.
- Omata M, Cheng AL, Kokudo N, et al. Asia-Pacific clinical practice guidelines on the management of hepatocellular carcinoma: a 2017 update. Hepatol Int. 2017;11:317–370.
- Solbiati L, Ahmed M, Cova L, et al. Small liver colorectal metastases treated with percutaneous radiofrequency ablation: local response rate and long-term survival with up to 10-year follow-up. Radiology. 2012;265:958–968.
- Kim YS, Lim HK, Rhim H, et al. Ten-year outcomes of percutaneous radiofrequency ablation as first-line therapy of early hepatocellular carcinoma: analysis of prognostic factors. J Hepatol. 2013;58:89–97.
- Wong SL, Mangu PB, Choti MA, et al. American Society of Clinical Oncology 2009 clinical evidence review on radiofrequency ablation of hepatic metastases from colorectal cancer. J Clin Oncol. 2010;28:493–508.
- Sherman M. Hepatocellular carcinoma: epidemiology, surveillance, and diagnosis. Semin Liver Dis. 2010;30:3–16.
- McGlynn KA, London WT. Epidemiology and natural history of hepatocellular carcinoma. Best Pract Res Clin Gastroenterol. 2005;19:3–23.
- Choi D, Lim HK, Rhim H, et al. Percutaneous radiofrequency ablation for early-stage hepatocellular carcinoma as a first-line treatment: long-term results and prognostic factors in a large single-institution series. Eur Radiol. 2007;17:684–692.
- Lu DS, Yu NC, Raman SS, et al. Radiofrequency ablation of hepatocellular carcinoma: treatment success as defined by histologic examination of the explanted liver. Radiology. 2005;234:954–960.
- Hori T, Nagata K, Hasuike S, et al. Risk factors for the local recurrence of hepatocellular carcinoma after a single session of percutaneous radiofrequency ablation. J Gastroenterol. 2003;38:977–981.
- Washburn WK, Dodd GD, 3rd, Kohlmeier RE, et al. Radiofrequency tissue ablation: effect of hepatic blood flow occlusion on thermal injuries produced in cirrhotic livers. Ann Surg Oncol. 2003;10:773–777.
- Bitsch RG, Dux M, Helmberger T, et al. Effects of vascular perfusion on coagulation size in radiofrequency ablation of ex vivo perfused bovine livers. Invest Radiol. 2006;41:422–427.
- Dodd GD, 3rd, Dodd NA, Lanctot AC, et al. Effect of variation of portal venous blood flow on radiofrequency and microwave ablations in a blood-perfused bovine liver model. Radiology. 2013;267:129–136.
- Pillai K, Akhter J, Chua TC, et al. Heat sink effect on tumor ablation characteristics as observed in monopolar radiofrequency, bipolar radiofrequency, and microwave, using ex vivo calf liver model. Medicine (Baltimore). 2015;94:e580.
- Liu Z, Ahmed M, Sabir A, et al. Computer modeling of the effect of perfusion on heating patterns in radiofrequency tumor ablation. Int J Hyperthermia. 2007;23:49–58.
- Huang L, Dodd GD, 3rd, Lanctot AC. Radiofrequency ablation of the liver: effect of variation of portal venous blood flow on lesion size in an in-vitro perfused bovine liver. Acad Radiol. 2012;19:1018–1022.
- Dodd GD, 3rd, Lanctot AC, Lind KE. Effect of change in portal vein flow rates on hepatic ablations created with a bipolar radiofrequency ablation device. Radiology. 2017;283:399–407.
- Ahmed M, Liu Z, Humphries S, et al. Computer modeling of the combined effects of perfusion, electrical conductivity, and thermal conductivity on tissue heating patterns in radiofrequency tumor ablation. Int J Hyperthermia. 2008;24:577–588.
- Iwamoto T, Kawai N, Sato M, et al. Effectiveness of hepatic arterial embolization on radiofrequency ablation volume in a swine model: relationship to portal venous flow and liver parenchymal pressure. J Vasc Interv Radiol. 2008;19:1646–1651.
- Huber A, Ebner L, Heverhagen JT, et al. State-of-the-art imaging of liver fibrosis and cirrhosis: a comprehensive review of current applications and future perspectives. Eur J Radiol Open. 2015;2:90–100.
- Papadatos D, Fowler KJ, Kielar AZ, et al. Cirrhosis and LI-RADS. Abdom Radiol (NY). 2018;43:26–40.
- Shiha G, Ibrahim A, Helmy A, et al. Asian-Pacific Association for the Study of the Liver (APASL) consensus guidelines on invasive and non-invasive assessment of hepatic fibrosis: a 2016 update. Hepatol Int. 2017;11:1–30.
- Chang S, Lanctot AC, McCarter MD, et al. The prediction of radiofrequency ablation zone volume using vascular indices of 3-dimensional volumetric colour Doppler ultrasound in an in vitro blood-perfused bovine liver model. Br J Radiol. 2017;90:20160661.
- European Association for the Study of the Liver. EASL Clinical Practice Guidelines: management of hepatocellular carcinoma. J Hepatol. 2018;69:182–236.
- Liu Z, Ahmed M, Weinstein Y, et al. Characterization of the RF ablation-induced ‘oven effect’: the importance of background tissue thermal conductivity on tissue heating. Int J Hyperthermia. 2006;22:327–342.
- Cassinotto C, Denys A, Gay F, et al. Radiofrequency ablation of liver tumors: no difference in the ablation zone volume between cirrhotic and healthy liver. Cardiovasc Intervent Radiol. 2018;41:905–911.
- Afif AM, Chang JP-E, Wang YY, et al. A sonographic Doppler study of the hepatic vein, portal vein and hepatic artery in liver cirrhosis: Correlation of hepatic hemodynamics with clinical Child Pugh score in Singapore. Ultrasound. 2017;25:213–221.
- Sudhamshu KC, Matsutani S, Maruyama H, et al. Doppler study of hepatic vein in cirrhotic patients: correlation with liver dysfunction and hepatic hemodynamics. WJG. 2006;12:5853–5858.
- Chen CH, Lin ST, Yang CC, et al. The accuracy of sonography in predicting steatosis and fibrosis in chronic hepatitis C. Dig Dis Sci. 2008;53:1699–1706.
- Hohmann J, Muller C, Oldenburg A, et al. Hepatic transit time analysis using contrast-enhanced ultrasound with BR1: a prospective study comparing patients with liver metastases from colorectal cancer with healthy volunteers. Ultrasound Med Biol. 2009;35:1427–1435.
- Zhou JH, Li AH, Cao LH, et al. Haemodynamic parameters of the hepatic artery and vein can detect liver metastases: assessment using contrast-enhanced ultrasound. BJR. 2008;81:113–119.
- Abbattista T, Ridolfi F, Consalvo GT, et al. Hepatic vein arrival time for diagnosis of liver cirrhosis: a 10-year single-center experience with contrast-enhanced sonography. J Ultrasound Med. 2016;35:2121–2128.
- Shi Y, Wang XH, Xia GC, et al. Quantitative diagnosis of early-stage liver cirrhosis with contrast-enhanced ultrasound–a clinical study. Adv Clin Exp Med. 2012;21:385–390.
- Kruskal JB, Thomas P, Kane RA, et al. Hepatic perfusion changes in mice livers with developing colorectal cancer metastases. Radiology. 2004;231:482–490.
- Friedman SL. Mechanisms of hepatic fibrogenesis. Gastroenterology. 2008;134:1655–1669.
- Thabut D, Shah V. Intrahepatic angiogenesis and sinusoidal remodeling in chronic liver disease: new targets for the treatment of portal hypertension? J Hepatol. 2010;53:976–980.
- Ahmed M, Liu Z, Afzal KS, et al. Radiofrequency ablation: effect of surrounding tissue composition on coagulation necrosis in a canine tumor model. Radiology. 2004;230:761–767.
- Wang X, Sofocleous CT, Erinjeri JP, et al. Margin size is an independent predictor of local tumor progression after ablation of colon cancer liver metastases. Cardiovasc Intervent Radiol. 2013;36:166–175.
- Kaye EA, Cornelis FH, Petre EN, et al. Volumetric 3D assessment of ablation zones after thermal ablation of colorectal liver metastases to improve prediction of local tumor progression. Eur Radiol. 2019;29:2698–2705.