
 ?Mathematical formulae have been encoded as MathML and are displayed in this HTML version using MathJax in order to improve their display. Uncheck the box to turn MathJax off. This feature requires Javascript. Click on a formula to zoom.
Abstract
Purpose
To study the differences between continuous and short-pulse mode microwave ablation (MWA).
Methods
We built a computational model for MWA including a 200 mm long and 14 G antenna from Amica-Gen and solved an electromagnetic-thermal coupled problem using COMSOL Multiphysics. We compared the coagulation zone (CZ) sizes created with pulsed and continuous modes under ex vivo and in vivo conditions. The model was used to compare long vs. short pulses, and 1000 W high-powered short pulses. Ex vivo experiments were conducted to validate the model.
Results
The computational models predicted the axial diameter of the CZ with an error of 2–3% and overestimated the transverse diameter by 9–11%. For short pulses, the ex vivo computer modeling results showed a trend toward larger CZ when duty cycles decreases. In general, short pulsed mode yielded higher CZ diameters and volumes than continuous mode, but the differences were not significant (<5%), as in terms of CZ sphericity. The same trends were observed in the simulations mimicking in vivo conditions. Both CZ diameter and sphericity were similar with short and long pulses. Short 1000 W pulses produced smaller sphericity and similar CZ sizes under in vivo and ex vivo conditions.
Conclusions
The characteristics of the CZ created by continuous and pulsed MWA show no significant differences from ex vivo experiments and computer simulations. The proposed idea of enlarging coagulation zones and improving their sphericity in pulsed mode was not evident in this study.
1. Introduction
Microwave ablation (MWA) is a minimally invasive technique which delivers microwave (MW) power through an antenna to selectively heat tumors, causing their destruction by thermal coagulative necrosis [Citation1]. MW has increasingly been used for hepatic ablation as it offers the potential to address some of the shortcomings of radiofrequency ablation (RFA) [Citation2]. Some studies have been carried out with the aim of verifying the efficacy and theoretical advantages of MWA versus RFA [Citation3–14], and improving its effectiveness [Citation15–17]. Computer modeling has also been used to study different issues related to MWA [Citation18–20]. Some of these studies have focused on characterizing the temperature dependence of thermophysical and dielectric properties [Citation21–26], optimizing MWA applicator designs [Citation27–32], and exploring how to model some important phenomena involved in MWA such as tissue shrinkage or vaporization [Citation23,Citation33–35]. Other computer modeling studies focused on other specific questions related to hepatic MWA such as the impact of working frequency (915 MHz vs. 2.45 GHz) [Citation15], effect of tumor size on the shape of the coagulation zone created by MWA [Citation36], effect of applicator placement relative to the tumor location [Citation26], influence of different characteristics of tumor and healthy tissue [Citation26], and the effect of blood perfusion [Citation26,Citation37].
It has recently been suggested that pulsed MWA could create more spherical coagulation zones than MW power delivered in a continuous mode [Citation38] and that it would produce larger coagulation zones perpendicular to the antenna insertion for the same amount of applied energy, i.e. pulsed MWA can enlarge the transverse diameter of the coagulation zone. A detailed analysis of pulsed vs. continuous mode MWA by Bedoya et al. [Citation38] did not report coagulation zone size differences between pulsed and continuous mode in an ex vivo model, but in the in vivo case they observed larger coagulation zones in the pulsed mode. Hui et al. [Citation39] introduced the idea of spreading out the pulses intermittently and also made an in vivo comparison between continuous and continuously pulsed MWA. They also did not report significant differences in coagulation zone size and sphericity between pulsed and continuous modes. However, these last two studies considered excessively long on-off intervals (50–50 s, 30–90 s, 75–75 s in Bedoya et al., and 31-32 s of cooling pauses in Hui et al.) compared to the intervals currently proposed by manufacturers (4–6 s). In this regard, Tosoratti et al. [Citation40] assessed pulsed MWA using short on-intervals (2–8 s) and a broad range of duty cycles (20–60%). However, this study was conducted under ex vivo conditions without perfusion, which limits the scope of its conclusions. The use of short (seconds-long) MWA pulses has also been proposed for other procedures, such as cardiac arrhythmia ablation [Citation41], but seeking a more uniform myocardial temperature gradient inside the cardiac tissue rather than spherical coagulation zones. Since the currently available microwave generators for hepatic MWA (e.g. Amica generator by HS Amica-Gen, HS Hospital Service, Rome, Italy) use short pulses of only a few seconds we focused on these values. We thus planned a computer modeling study in five simulation phases. In Phase 1, the computational model was validated by our own ex vivo experiments; in Phase 2 we compared the results obtained with those obtained by Tosoratti et al. [Citation40]; in Phase 3 we adapted the computational model to in vivo conditions by including the heat sink term associated with blood perfusion, and compared the coagulation zone sizes of short and continuous mode. Phase 4 was planned to study whether long pulses could produce greater diameters or sphericity than short pulses. In Phase 5 we tested very high-powered short pulses (1000 W), as has been done in the past with radiofrequency [Citation42].
2. Materials and methods
2.1. Ex vivo experiments
Ablations were conducted at room temperature (24 °C) on sections of fresh bovine liver (within less than 24 h of the death of the animal and refrigerated until the experiments). The tissue temperature ranged from 18 to 22 °C. Ablations were conducted with a 200 mm long 14 G antenna (HS Amica-Gen, HS Hospital Service, Rome, Italy) which is a coaxial-dipole equipped with a mini-choke to avoid back heating effects and an internal water cooling circuit (at 24 °C) to avoid shaft overheating. As shown in , the antenna ended in an arrow-shaped head to facilitate insertion into tissue. Two different dielectric materials were used in the antenna design: polytetrafluoroethylene (PTFE) to cover the tip and alumina for filling the choke and covering the active antenna length () [Citation43]. A coaxial cable UT-031-LL connected antenna and Amica generator (HS Amica-Gen, HS Hospital Service, Rome, Italy) working at 2.45 GHz, which can deliver power in both continuous and pulsed mode. The pulse mode was in 10 s cycles with power-on for 4 s followed by 6 s of power-off. During the ablations the MW generator indicated the value of the reflection coefficient (%), energy supplied (kJ), antenna temperature (°C) and power (W).
Figure 1 (A) Geometry and dimensions of 14 G MW antenna. (B) Materials making up the antenna. C: Geometry of the computer model and a scheme of the CZ measures: A represents the axial diameter and B the middle of the transverse diameter. Dimensions in mm and schemes out of scale.
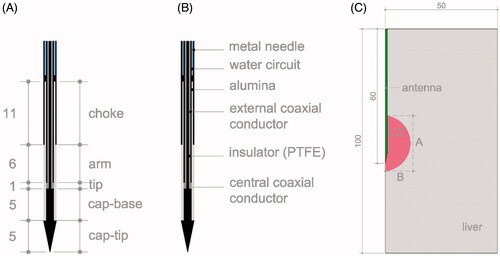
Pulsed and continuous MW ablations were conducted at different settings: twelve with pulsed powers of 60, 80, 100 and 125 W applied for 180, 300 and 600 s. Eighteen ablations with continuous powers of 60 and 80 W were applied for 120, 180, 240, 300, 360 and 600 s (180, 300 and 600 s ablations were repeated twice). Six additional ablations were made with continuous power of 60 W and different times (120, 151, 200, 254, 373 and 505 s). shows the number of experiments made with each power and time for the pulsed and continuous protocols. In this last set the times were set to obtain the same level of energy as the 100 W and 125 W pulsed ablations for 180, 300 and 600 s. Power losses in the UT-31-LL cable were 11%. The placement of the antenna in the tissue was guided by an ultrasound system model (Siemens Sonoline Antares, Erlangen, Germany) equipped with a Convex probe working at frequencies of 1.54–2.22 MHz to avoid overlapping lesions. After the ablation the coagulation zones were transversally sectioned to measure the axial and transversal diameters using a caliper with an accuracy of ±1 mm. All these measurements were based on the central ‘white zone’ induced by thermal therapies, excluding the red area of hyperemia. The axial diameter was measured following the longitudinal symmetry axis of the antenna and the transverse diameter just perpendicular to the axis.
Table 1. Number and characteristics (power and time) of the ex vivo experiments.
2.2. Description of the computer model
The computer modeling was in five phases: 1) simulations mimicking the conditions of our own ex vivo experiments (described in subsection 2.1) to validate the computer model; 2) simulations mimicking the conditions of the ex vivo experiments conducted by Tosoratti et al. [Citation40]; 3) mimicking in vivo conditions; 4) using a pulsed protocol with long pulses; and 5) using very high power (1000 W) with short pulses. The computational model consisted of an antenna (see ) completely surrounded by a 50 mm radius and 100 mm high cylinder of hepatic tissue (see ), which was identical in all three phases. A convergence test guaranteed that these outer dimensions were sufficiently large (see Subsection 3.1. Model verification). The problem presented axial symmetry and hence a two-dimensional analysis was possible. The length and thickness of each part of the antenna were extracted from [Citation16,Citation43–45].
We solved a coupled electromagnetic-thermal problem using COMSOL Multiphysics software (COMSOL, Burlington, MA, USA). The governing equation for the thermal problem was the Bioheat equation modified by the enthalpy method to take vaporization phenomenon into account the [Citation46]:
(1)
(1)
where ρ (kg/m3) is tissue density, h (J/kg·K) enthalpy, k (W/m·K) thermal conductivity, T (°C) temperature and t (s) time. For biological tissues enthalpy is related to tissue temperature by the following expression [Citation46]:
(2)
(2)
where ρi and ci are density and specific heat of tissue respectively at temperatures below 100 °C (i = l) and at temperatures above 100 °C (i = g), hfg is the product of water latent heat of vaporization and water density at 100 °C, and C is tissue water content inside the liver (68%) [Citation47]. Qp is the blood perfusion heat, which was set to zero in Phases 1 and 2 (which mimics ex vivo conditions) in order to compare with an ex vivo experiment. In Phase 3, Qp was set to
(3)
(3)
where
is the blood perfusion coefficient (0.019 s−1),
and
are the blood density and specific heat, respectively,
is the temperature of the arterial blood (37 °C) and
is a coefficient that modifies blood perfusion with tissue damage: β = 0 for Ω ≥ 4.6, and β = 1 for Ω < 4.6. The parameter Ω was assessed by the Arrhenius damage model [Citation48], which associates temperature with exposure time using a first-order kinetics relationship:
(4)
(4)
where R is the universal gas constant, A (7.39 × 1039s−1) is a frequency factor and ΔE (2.577 × 10⁵ J/mol) is the activation energy for the irreversible damage reaction. We employed the D99 thermal damage contour to compute the coagulation zone dimension, which corresponds to Ω = 4.6 (99% probability of cell death). These same values of the parameters A and ΔE were demonstrated to be valid to predict the coagulation zone boundary including the red area of hyperemia when Ω = 1 was used [Citation49]. We also demonstrated here that they are also able to predict the coagulation zone boundary excluding the red area when Ω = 4.6 is used (see Subsection Citation3.Citation2).
The term Qmet refers to the metabolic heat which is negligible in MWA, and was thus not included in our models. The term q refers to the heat source from MW power. The absorbed electromagnetic energy, q, was computed from the electromagnetic field distribution in tissue E (V/m), and is given by
(5)
(5)
where σ(S/m) was the (effective) conductivity. The time-harmonic Helmholtz electromagnetic equation was solved to determine E
(6)
(6)
being the relative permeability ratio, which is unity for all the materials in this model, k0 is the propagation constant in free-space,
is relative permittivity,
(F/m) is the permittivity of free-space, and
(rad/s) is angular frequency.
In both the electromagnetic and thermal problems an axial symmetry condition was set in the symmetry axis and null flux at the outer boundaries. The initial tissue temperature was set to 20 °C in the simulations mimicking ex vivo experiments (Phases 1 and 2), and 37 °C in those mimicking in vivo conditions (Phase 3). Newton’s law of cooling was used to model the effect of the antenna cooling circuit, with a thermal convection coefficient h and a coolant temperature. In Phase 1, h was 1000 W/K·m2 [Citation50] and coolant temperature was 24 °C. In Phase 2 and 3, as done by Tosoratti et al. [Citation40], we considered two combinations of flow rate and coolant temperature levels: intensive (110 ml/min, 5 °C) and low (25 ml/min, 20 °C), which corresponded to h = 5943 W/K·m2 and h = 2838 W/K·m2, respectively, according to the method described in [Citation51].
In the electromagnetic problem, a first-order electromagnetic scattering boundary condition was applied at the outer boundaries
(7)
(7)
This boundary condition is applied at the outer edges of the simulation domains to approximate a nonreflecting boundary and provides an approach for implementing a nonreflecting boundary with considerably reduced computational requirements (i.e. memory) than a more intensive absorbing boundary condition, such as perfectly matched layers. Given the relatively large distance between the radiating antenna element and the edges of the simulation domain, and the lossy nature of the intervening tissue, the electromagnetic waves incident on the boundaries of the simulation extents are expected to be of very low intensity. The initial value of the electric field was set at 0 V/m. The input power of both continuous and pulsed cases was specified as a coaxial port boundary condition at the top of the antenna. For each power level, the value of the input power used in the computer model took into account the attenuation in the coaxial cable, using the reflection value provided by the generator to modify the power value applied in the model and adapt it to the actual power value. The applied energy quotient and time provided by the generator also gave information about the actual power applied for use in the model.
shows the characteristics of materials used in the model [Citation25,Citation27,Citation47,Citation52]. The inner and outer antenna conductors were assumed to be copper, while the remaining metal parts (tip and needle) were assumed to be stainless steel. Tissue conductivity (σ, in S/m) and relative permittivity (εr, dimensionless) were temperature-dependent (T), as in previous studies [Citation17,Citation21–23,Citation25,Citation53]. We adopted the functions used in [Citation25]:
(8)
(8)
(9)
(9)
Table 2. Characteristics of materials used in the computer model [Citation25,Citation27,Citation46,Citation51].
The model was verified by convergence tests in terms of domain outer dimensions, mesh size, and time-step. The reference parameter for the convergence tests was the maximum temperature (Tmax) reached after 3, 5 and 10 min at three points 10, 20 and 30 mm from the antenna surface. The domain outer dimensions were those of the reference [Citation16]. These dimensions were changed +1 mm and we assessed the changes in Tmax. The former dimensions were used in the model for Tmax differences of less than 0.5% between two subsequent simulations. The model mesh was heterogeneous with a finer size at the antenna-tissue interface, where the highest electrical and thermal gradients were expected. All the mesh elements were triangular. The mesh was verified by repeating the convergence test based on the analysis of Tmax. Starting from the initial mesh, we refined it using the automatic COMSOL ‘refine mesh’. For the time-step, a convergence test verified the use of an adaptive scheme, since we let the time-stepping method choose time steps freely.
2.3. Phases of the computer modeling study
Phase 1 considered the same conditions as in our ex vivo experiments at applied power levels of 60, 80, 100 and 125 Wand Phase 2 considered some of the settings used by Tosoratti et al. [Citation40] but keeping total energy constant at 16.8 kJ for a 10 min duration. The coagulation zone was always assessed 10 min after MWA switch-off to include the effect of thermal latency during the cool-down period. We compared continuous mode (at 28 W) vs. pulsed mode with duty cycles of 20, 40 and 60% and powers of 140, 70 and 46.75 W, respectively. Each duty cycle considered three different combinations of ON time/OFF time (tON/tOFF): 2/8, 3/12 and 4/16 s for 20%; 2/3, 4/6, 8/12 for 40%; and 3/2, 6/4 and 12/8 for 60%. Duty cycle was defined as 100 × tON/(tON+tOFF). All these combinations were simulated under intensive and low conditions of antenna internal cooling (see Section 2.2). For each simulation we computed the axial (A) and transverse (B) diameters, sphericity ratio (B/A) and coagulation zone CZ volume (tissue zone with Ω > 4.6). We follow the same pattern in the computer modeling to measure the diameters: following the longitudinal antenna symmetry axis (axial) and perpendicular to this axis (transverse), which are the measurements A and 2B given in . Phase 3 simulated the same settings as Phase 2 but under in vivo conditions.
In Phase 4 we planned a set of additional simulations using long pulses as in [Citation38]. Although we had already addressed our objective of comparing continuous and pulsed MWA with short pulses during the previous phases, we wanted to reinforce our conclusions by determining whether long pulses would produce the same results. For the two ex vivo simulations we used a different duty cycle of 25% and 50% at a power of 100 W, and followed the combinations of ON time/OFF time (tON/tOFF) with values 30/90 and 50/50 according to [Citation38]. Durations of 11.2 min and 5.6 min were used for each duty cycle to reach the same level of energy (kJ) as in Phases 2 and 3. We also repeated these simulations for in vivo conditions, changing the tON/tOFF values to 75/75 in the 25% duty cycle (as in [Citation38]). All the cases were run with low internal antenna cooling.
In phase 5 we conducted additional simulations with very high-powered short pulses (1000 W). In [Citation42] the authors obtained a larger CZ using a pulsed protocol in radiofrequency ablation at this level of power. We simulated 60% DC (6 s on and 4 s off) and 40% DC (4 s on and 6 s off) for both ex vivo and in vivo with durations of 28 and 42 s to obtain an energy of 16.8 kJ (equal to that used in Phases 2 and 3) with high internal antenna cooling.
3. Results
3.1. Model verification
Although the outer dimensions of the model were taken from [Citation16], we conducted convergence tests as described in Subsection Citation2.Citation2 and found that a cylinder radius of 50 mm and height of 100 cm and mesh size of 0.03 mm at the tissue-antenna interface (0.15 mm at the outer boundary) were suitable, also that the optimal time-step to start the adaptive scheme was 1 s for the continuous mode and 0.1 s for the pulsed mode. We also checked the numerical error associated with the FEM solver by running 8 identical simulations at 60 W at continuous mode for 10 min. The results, in terms of coagulation zone size, showed a difference of ± 0.01 cm in the axial diameter and ± 0.005 cm in the transverse diameter.
3.2. Ex vivo experiments and model validation
shows the relation between the axial and transverse diameters computed and those measured in the ex vivo experiments. Each point represents a pair of values (experimental-computational) obtained with a specific applied power setting and duration. The pairs of values generally coincided closely, with coefficients of determination (R2) >92% for continuous and >96% for pulsed mode. The regression line fitted a linear trend with the coefficient of the linear equations close to 1 in all the cases. The regression line was computed considering zero crossing. When the experiments were repeated twice, both values were compared with the FEM results. The maximum variability between repeated experiments was 3 mm (for the case of 60 W and 180 s), which corresponded to an 8% of difference. The remaining differences were between 0 and 5%.
Figure 2. Relation between the computed (FEM) and experimental (ex vivo) values obtained for the transverse (A) and axial (B) diameters of the coagulation zone for continuous and pulsed MWA. The regression line considered zero crossing.
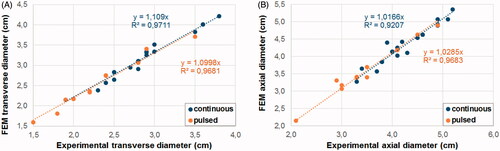
In order to quantify the error associated with the prediction of the computational model, we calculated the relative error % as 100×(FEM−Exp)/Exp, where Exp is the experimental value and FEM is the computational value for the pairs of values shown in . To predict the transverse diameter, the relative error ranged from +3% to +17% (+11 ± 4%, mean ± standard deviation) for the continuous mode, and from +1% to +18% (+9 ± 5%) for the pulsed mode. For the axial diameter prediction, the relative error ranged from −5% to +13% (+2 ± 4%) for the continuous mode and from −3% to +14% (+3 ± 4%) for the pulsed mode. Although we stated that the cases with the lowest energy levels had the highest percentage differences, in terms of mm the differences were similar in all the cases. The axial diameter had a mean of differences of 0.9 mm in with two cases with differences of 4 and 5 mm, but differences <2 mm were found in the rest of the cases, regardless of energy level, power or whether continuous or pulsed protocol was used. The relative error was highest in cases with the lowest energy level, which produced smaller axial diameter values. As in some cases the computer results had higher values than the experimental, but not in others, the relative error ranged from negative to positive values. For the transverse diameter the computer model results were always higher those of the experimental. Similarly, in the axial diameter the values differences varied from 0.5–5 mm but with a higher mean of 2.8 mm. Again, as the variability was not related to energy level, power or protocol, the percentage differences were higher in the cases with the lowest diameter values.
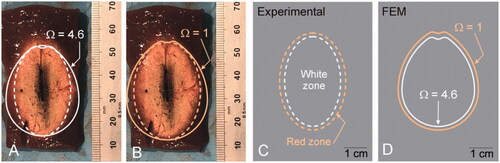
shows the coagulation zone created with pulsed MWA at 125 W for 5 min. From the center to the periphery we observed the following: 1) strong carbonization zone (central black zone) around the antenna position, 2) whitish area characteristic of white coagulation necrosis (dashed white line), and 3) red area of hyperemia in a ∼2 mm margin (dashed orange line) (see ). While the computational model predicted the axial diameter reasonably well (mean values of 2% and 3% for continuous and pulsed modes, respectively), it overestimated the transverse diameter (mean values of 11% and 9% for continuous and pulsed modes, respectively). Although only the central white zone was used to estimate coagulation zone size, we also assessed the position of the boundary including the red zone and found that the red zone contour could be well represented by the zone between the isolines Ω = 1 and Ω = 4.6, regardless of the overestimation of the transverse diameter (compare ).
Figure 3. (A and B) Coagulations zones created in an ex vivo model with pulsed MWA at 125 W for 5 min. The dashed lines represent the contours measured on the images: white line for the zone with only white coagulation, and orange for the zone with red hyperemia also. The solid lines represent the Ω = 4.6 isolines (white solid line) and Ω = 1 (orange solid line) computed by the Arrhenius function to represent the CZ boundary. C and D: Comparison of experimental and computational (FEM) results.
The power reflection coefficient slightly increased during each ablation. In continuous mode it remained approximately constant during all the process with slight variations. In pulsed mode when energy was applied the reflection coefficient increased abruptly between 0 and the highest value (11% at 80 W or 13% at 125 W).
3.3. Pulsed vs. continuous mode under ex vivo and in vivo conditions
shows the results of Phase 2, i.e. simulations mimicking the ex vivo experiments reported by Tosoratti et al. [Citation40]. shows the axial and transverse diameters and the volumes of the coagulation zones for different duty cycles and for intensive and low cooling. The results showed a trend toward larger coagulation zones as the duty cycle decreased, regardless of cooling type. Pulsed mode cases in general had larger diameters and CZ volumes than the continuous mode. With intensive cooling there seems to be no difference between pulsed and continuous mode sphericity (values ranging from 91–94%), at low cooling it tended to be lower in continuous than pulsed mode with a low duty cycle (86 vs. 94%). The greater sphericity obtained with intensive cooling in pulsed mode was not really produced by the greater transversal diameter, as would be desirable, but by the smaller the axial diameter due to antenna cooling. The differences between the pulsed and continuous modes at both intensive and low cooling reached 7% in terms of CZ volumes.
Figure 4. Axial and transverse diameters (A and B) and volumes of the coagulation zones (C and D) computed under ex vivo conditions for different duty cycle values with intensive and low cooling. Duty cycles of 100% are those of the continuous mode while values <100% are in the pulsed mode.
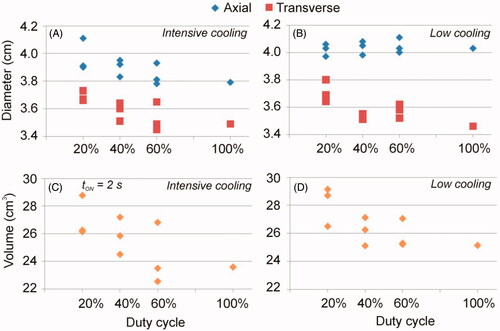
Table 3. Computer result of the simulations mimicking the ex vivo experiments reported by Tosoratti et al [Citation40] (Phase 2).
shows the results of Phase 3 with the same cases as in Phase 2 under in vivo conditions. As in ex vivo, they showed a trend toward larger coagulation zones at lower duty cycles and practically all the pulsed cases produced higher diameters and volumes than the continuous mode, whatever the cooling. However, only in the volume of the CZ we observe significant differences of 14%. Similar sphericity was found in both modes with no apparent trend in pulsed cases. The axial and transverse CZ diameters computed for the in vivo case were 14 and 16% smaller than the ex vivo, respectively, which implied a reduction of ∼50% in CZ volume. This behavior was similar both for low and intensive cooling.
Table 4. Computer result of the simulations mimicking in vivo conditions (Phase 3).
3.4. Use of long pulses under ex vivo and in vivo conditions
summarizes the results obtained using long pulses. The most relevant finding was that long pulses presented smaller diameters and volumes for the 25% duty cycle (tON/tOFF=30/90) than all the short pulse cases. The results obtained with duty cycles of 50% (tON/tOFF = 50/50 or 75/75) were similar to those obtained with short pulses. These findings were identical for both ex vivo and in vivo conditions.
Table 5. Computer result of the simulations using long pulses.
3.5. Use of very high-power with short pulses under ex vivo and in vivo conditions
shows the cases considered using very high-powered pulses (Phase 5) outlined in orange. The rest of the cases in were extracted from and in order to compare them to the high and lower power results. From the ex vivo results we observed that the CZ was less spherical at 1000 W, as the axial diameter increased significantly while the transverse diameter decreased slightly, compared to the cases at lower powers. Despite these changes, the CZ volume remained similar, regardless of power. Under ex vivo conditions, a high power of 1000 W implied similar CZ volume but less sphericity. We also found that the axial diameter increased significantly in vivo, although the transversal diameter also increased, which meant larger CZ volumes at 1000 W. In fact, the in vivo cases gave similar results to those obtained from ex vivo cases, and again with a less spherical CZ than at lower powers. shows the CZ contour at the end of the application of the first pulse (gray line) and at the end of power application (black line) for 1000 W (A-B) and 46.75 W (C-D) under ex vivo (A-C) and in vivo (B-D) conditions. All these were cases with a 60% protocol (6 s on and 4 s off). No CZ was produced at the end of the first pulse at 46.75 W, so no gray line is shown. The less spherical CZ can be clearly seen in in the 1000 W cases, with the CZ mostly extended in the axial direction.
Figure 5. CZ contour at the end of the application of the first pulse (gray line) and at the end of power application (black line) for 1000 W (A-B) and 46.75 W (C-D) under ex vivo (A-C) and in vivo (B-D) conditions. All cases were with a 60% protocol (6 s on - 4 s off).
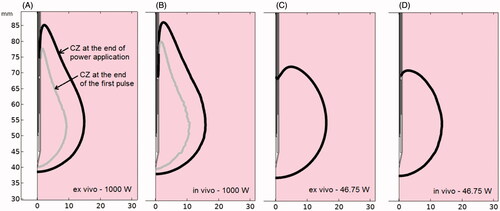
Table 6. Computer result of the simulations using short pulses with very high power utlined in orange.
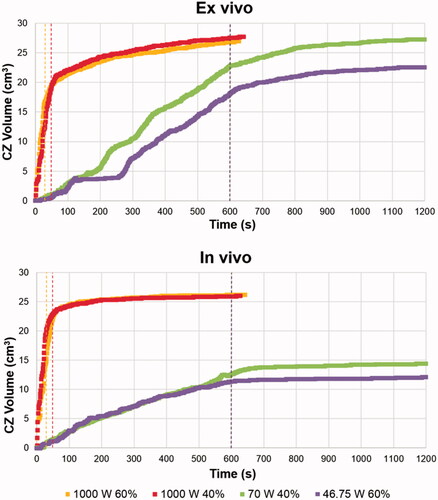
At very high power, the temperature rose faster and so did CZ volume. shows the CZ volume evolution during MW power application including the 10 min of thermal latency. The dashed colored lines show the end of the power application in the different cases. The CZ growth rate is much higher in the 1000 W protocols, while all the ex vivo cases have similar volumes. The main differences between the final CZ volumes and the growth rate were between high-powered in vivo cases and lower power values. In all the cases the CZ volume increased similarly during latency and was higher under ex vivo conditions. Also, higher temperatures were reached around the antenna at very high power. Similar temperatures were achieved around the antenna in both ex and in vivo cases at very high power: 180 °C and 170 °C at the end of power application and at the end of the first pulse, respectively. However, maximum temperatures were lower using the same DC but short pulses at 46.75 W: 120 °C and 38 °C at the end of the power application and first pulse for ex vivo, and 105 °C and 55 °C for in vivo.
Figure 6. Evolution of CZ volume during the MWA, including the 10 min cooling phase in which CZ can increase due to thermal latency. Dashed colored lines show the end of the power application in the different cases.
4. Discussion
4.1. Experimental validation
While the computational model predicted the axial diameter reasonably well (mean error 2–3%), it overestimated the transverse diameter by 9–11%. We think that this can be due to tissue shrinkage during MWA, which can be up to 15–50% along one diameter in ex vivo liver [Citation54] and was not taken into account in our model. In fact, it has been reported that shrinkage is non-uniform and is greater in the radial direction (transverse diameter) than longitudinal (axial diameter) [Citation55], as we found. Liu and Brace reported ∼20% in the radial and ∼10% in the longitudinal direction [Citation56]. An accurate value cannot be given for shrinkage since there is a great variation in the literature, e.g. 21.7% [Citation57], 23–43% [Citation55], and 31 ± 6% [Citation58].
Our prediction errors (2–3% for axial and 9–11% for transverse diameter) are partially in agreement with those reported in other studies which included an experimental validation. For instance, Cavagnaro et al. [Citation23] reported errors between −18.5% and 15.5% for the axial diameter and −9.09% and 10.2% for the transverse diameter (continuous MWA at 40 W); Chiang et al. [Citation34] reported transverse diameters with differences between experiments and computational results of ∼5% (calculated by us); and Singh et al. [Citation59] estimated a difference of 5.4% for the transverse and 13% for the axial diameter between experiments and simulations. As the differences in mm remain remarkably constant in all the cases, we found higher percentage differences in the cases with the smallest coagulation zone diameters.
4.2. Pulsed vs. continuous mode under ex vivo conditions
Overall, our results show that under ex vivo conditions the pulsed mode does not guarantee larger coagulation zones than the continuous mode, since both ranges of CZ volumes (computed for pulsed and continuous modes) overlap. This is in agreement with Tosoratti et al. [Citation40], who found that pulsed and continuous mode created similar coagulation volumes at the same power levels. According to Tosoratti et al. [Citation40] the pulsed mode presents greater sphericity (at intensive cooling and settings of tON = 2 s and DC = 20% and tON = 4 s and DC = 40%). Although we did not find different sphericity between pulsed and continuous modes, we did obtain slightly higher sphericity values with intensive cooling and high DC values. In this regard, it is important to remember that aiming for more spherical coagulation zones is due to the interest in obtaining a larger transverse diameter. In the simulated cases with pulsed mode and intensive cooling, the greater sphericity did not mean a greater transverse diameter, which was due to the shorter axial diameter, i.e. cooling type influences sphericity since it increases axial diameter at low cooling but does not produce a larger transverse diameter with intensive cooling.
4.3. Pulsed vs. continuous mode under in vivo conditions
The in and ex vivo simulations showed similar tendencies, suggesting that the pulsed mode does not guarantee larger coagulation zones than the continuous mode. The only appreciable difference was the differences in CZ diameters and volumes with both types of cooling were smaller in vivo, suggesting that the heat sink effect of blood perfusion and initial tissue temperature moderates the effect of antenna cooling.
When ex vivo and in vivo results were compared (regardless of application mode) the in vivo results showed axial and transverse coagulation zone diameters 14 and 16% smaller than ex vivo, respectively, which means 50% smaller CZ volumes, which agrees with previous experimental studies. Amabile et al. [Citation60] found ∼50% less CZ volume at 60 W continuous MWA for 5 and 10 min, with differences of ∼25% and ∼12% in axial and transverse diameters, respectively. Wang et al. [Citation61] also reported differences of ∼12% between ex and in vivo for both axial and transverse diameters for 10 min 50 W continuous MWA. The only data available to compare the outcomes of pulsed ex and in vivo MWA is that of Bedoya et al. [Citation38], who obtained widely dispersed results for 25 and 50 W MWA for 10 and 5 min, with differences of 18–37% in the axial and 0–28% in the transverse diameter.
4.4. Use of long pulses
Some manufacturers, such as Amica (HS Amica-Gen, HS Hospital Service, Rome, Italy), offer short-pulse MWA devices. We found that using long pulses with the same Amica antenna did not produce better results and they could have been even worse, as with a duty cycle of 25%, when worse results were obtained than those with 50% cycles, in agreement with the findings reported in [Citation38]. A qualitative comparison with the results of [Citation38] was not possible because of the different experimental conditions, especially the uncooled antenna used by these authors, which must have been the reason for the less spherical coagulation zones. Neither were the CZ volumes comparable with ours since they used diameters instead of radii to calculate the volume of the ellipsoid and thus considerably overestimated the CZ volume.
4.5. Use of very high-power with short pulses
The aim in MWA is to create a large CZ volume with a long transverse diameter, i.e. a CZ as spherical as possible. However, as 1000 W was associated with less sphericity than lower powers it does not seem to be an optimal protocol. Interestingly, a power of 1000 W created larger CZ volumes than lower powers under in vivo conditions. From the temperature values and the CZ shape obtained, our hypothesis is that the effect of the internal cooled antenna and blood perfusion is less important than the higher temperature gradients produced at 1000 W. The axial CZ growth found in the 1000 W cases suggests the minimal effect of the internally cooled antenna circuit. However, despite the larger CZ volume obtained in vivo in the very high-powered cases, the increase in the transverse diameter is not as large as desired, while the use of this power level could involve increased risks to the patient.
4.6. Limitations of the study
Some limitations have to be pointed out. First, relatively low energy values were used (16.8 kJ) in both ex and in vivo conditions (Phases 2 and 3) in comparison with some continuous mode clinical studies, which ranged from 33.6 to 183.9 kJ [Citation6,Citation62–66]. However, low energy values from 6 to 19.2 kJ [Citation64,Citation65,Citation67] have also been used. As the output power of the microwave generator used in the experiments is limited to 140 W in the pulse mode, the energy is therefore limited to 16.8 kJ to simulate a 20% 10 min duty cycle. Neither was tissue shrinkage considered in the theoretical modeling, which could cause differences in the transverse diameter values of the experimental and computational results.
Current references [Citation22,Citation68] suggest thermal conductivity or specific heat temperature- dependent functions should be used in the computer modeling. Previous studies have shown that considering a thermal conductivity temperature-dependent function has a negligible effect on the results [Citation69,Citation70] and so we did not consider it in the study. The variation of the specific heat was included in vaporization modeling through the enthalpy method. As the comparisons with other vaporization methods [Citation71] provided differences in axial and transverse diameters <1% we considered using the enthalpy method to model water vaporization, which includes the variation of the specific heat value.
5. Conclusions
The characteristics of coagulation zones created by continuous and pulsed MWA show no significant differences from ex vivo experiments and computer simulations. These conclusions were confirmed in the simulations under in vivo conditions. As such, the proposed idea of enlarging coagulation zones and improving sphericity by using the pulsed mode was not confirmed in this study. Since the pulsed mode requires higher power levels or longer ablations than the continuous mode in clinical practice, the findings do not suggest an appreciable advantage associated with the pulsed mode.
Disclosure statement
The authors have no conflicts of interest or financial disclosures to make relevant to this submission.
Additional information
Funding
References
- Brace CL. Microwave ablation technology: what every user should know. Curr Probl Diagn Radiol. 2009;38(2):61–67.
- Wright AS, Mahvi DM, Haemmerich DG, et al. Minimally invasive approaches in management of hepatic tumors. Surg Technol Int. 2003;II:144–153.
- Baust JM, Rabin Y, Polascik TJ, et al. Defeating cancer’s adaptive defensive strategies using thermal therapies: Examining cancer’s therapeutic resistance, ablative, and computational modeling strategies as a means for improving therapeutic outcome. Technol Cancer Res Treat. 2018;17:1533033818762207–1533033818762216.
- Chinnaratha MA, Chuang MA, Fraser RJL, et al. Percutaneous thermal ablation for primary hepatocellular carcinoma: a systematic review and meta-analysys. J Gastroenterol Hepatol. 2016;31(2):294–301.
- Facciorusso A, Di Maso M, Muscatiello N. Microwave ablation versus radiofrequency ablation for the treatment of hepatocellular carcinoma: a systematic review and meta-analysis. Int J Hyperther Early Online. 2016;32(3):336–339.
- Heerink WJ, Solouki AM, Vliegenthart R, et al. The relationship between applied energy and ablation zone volume in patients with hepatocellular carcinoma and colorectal liver metastasis. Eur Radiol. 2018;28(8):3228–3236.
- Huo YR, Eslick GD. Microwave ablation compared to radiofrequency ablation for hepatic lesions: a meta-analysis. J Vasc Interv Radiol. 2015;26(8):1139–1146.
- Lee KF, Wong J, Hui JW, et al. Long-term outcomes of microwave versus radiofrequency ablation for hepatocellular carcinoma by surgical approach: a retrospective comparative study. Asian J Surg. 2017;40(4):301–308.
- Loriaud A, Denys A, Seror O, et al. Hepatocellular carcinoma abutting large vessels: Comparison of four percutaneous ablation systems. Int J Hyperther, On-Line. 2018;34(8):1171–1178.
- Nault JC, Sutter O, Nahon P, et al. Percutaneous treatment of hepatocellular carcinoma: state of the art and innovations. J Hepatol. 2018;68(4):783–797.
- Poulou LS, Botsa E, Thanou I, et al. Percutaneous microwave ablation vs radiofrequency ablation in the treatment of hepatocellular carcinoma. World J Hepatol. 2015;7(8):1054–1063.
- Primavesi F, Swierczynski S, Klieser E, et al. Thermogarphic real-time-monitoring of surgical radiofrequency and microwave ablation in a perfused porcine liver model. Oncol Lett. 2017;15:2913–2920.
- Salati U, Barry A, Chou FY, et al. State of the ablation nation: a review of ablative therapies for cure in the treatment of hepatocellular carcinoma. Future Oncol. 2017;13(16):1437–1448.
- Xu Y, Shen Q, Wang N, et al. Microwave ablation is as effective as radiofrequency ablation for very-early-stage hepatocellular carcinoma. Chin J Cancer. 2017;36(1):14.
- Curto S, Taj-Eldin M, Fairchild D, et al. Microwave ablation at 915 MHz vs 2.45 GHz: a theoretical and experimental investigation. Med Phys. 2015;42(11):6152–6161.
- Lopresto V, Pinto R, Farina L, et al. Treatment planning in microwave thermal ablation: clinical gaps and recent research advances. Int J Hyperthermia. 2017;33(1):83–100.
- Sebek J, Curto S, Bortel R, et al. Analysis of minimally invasive directional antennas for microwave tissue ablation. Int J Hyperthermia. 2017;33(1):51–60.
- Prakash P. Theoretical modeling for hepatic microwave ablation. Open Biomed Eng J. 2010;4:27–38.
- Chiang J, Wang P, Brace CL. Computational modelling of microwave tumour ablations. Int J Hyperthermia. 2013;29(4):308–317.
- Hall SK, Ooi EH, Payne SJ. A mathematical framework for minimally invasive tumor ablation therapies. Crit Rev Biomed Eng. 2014;42(5):383–417.
- Ji Z, Brace CL. Expanded modeling of temperature-dependent dielectric properties for microwave thermal ablation. Phys Med Biol. 2011;56(16):5249–5264.
- Rossmann C, Haemmerich D. Review of temperature dependence of thermal properties, dielectric properties, and perfusion of biological tissues at hyperthermic and ablation temperatures. Crit Rev Biomed Eng. 2014;42(6):467–492.
- Cavagnaro M, Pinto R, Lopresto V. Numerical models to evaluate the temperature increase induced by ex vivo microwave thermal ablation. Phys Med Biol. 2015;60(8):3287–3311.
- Sebek J, Albin N, Bortel R, et al. Sensitivity of microwave ablation models to tissue biophysical properties: a first step toward probabilistic modeling and treatment planning. Med Phys. 2016;43(5):2649–2661.
- Lopresto V, Pinto R, Farina L, et al. Microwave thermal ablation: effects of tissue properties variations on predictive models for treatment planning. Med Eng Phys. 2017b;46:63–70.
- Deshazer G, Merck D, Hagmann M, et al. Physical modeling of microwave ablation zone clinical margin variance. Med Phys. 2016;43(4):1765–1776.
- Brace CL, Laeseke PF, van der Weide DW, et al. Microwave ablation with a triaxial antenna: results in ex vivo bovine liver. IEEE Trans Microw Theory Tech. 2005;53(1):215–220.
- Bertram JM, Yang D, Converse MC, et al. Antenna design for microwave hepatic ablation using an axisymmetric electromagnetic model. Biomed Eng Online. 2006;5:15.
- Prakash P, Converse MC, Webster JG, et al. An optimal sliding choke antenna for hepatic microwave ablation. IEEE Trans Biomed Eng. 2009;56(10):2470–2476.
- Keangin P, Rattanadecho P, Wessapan T. An analysis of heat transfer in liver tissue during microwave ablation using single and double slot antenna. Int Commun Heat Mass Transfer. 2011;38(6):757–766.
- Maini S. FEM simulation of tapered cap floating sleeve antenna for hepatocellular carcinoma therapy. Electromagn Biol Med. 2015;35(2):1–8.
- Jiang Y, Zhao J, Li W, et al. A coaxial slot antenna with frequency of 433 MHz for microwave ablation therapies: design, simulation, and experimental research. Med Biol Eng Comput. 2017;55(11):2027–2036.
- Haiming A, Shuicai W, Hongjian G, et al. Temperature distribution analysis of tissue water vaporization during microwave ablation: experiments and simulations. Int J Hyperthermia. 2012;28(7):674–685.
- Chiang J, Birla S, Bedoya M, et al. Modeling and validation of microwave ablations with internal vaporization. IEEE Trans Biomed Eng. 2015;62(2):657–663.
- Liu D, Brace CL. Numerical simulation of microwave ablation incorporating tissue contraction based on thermal dose. Phys Med Biol. 2017;62(6):2070–2086.
- Cavagnaro M, Amabile C, Cassarino S, et al. Influence of the target tissue size on the shape of ex vivo microwave ablation zones. Int J Hyperthermia. 2015b;31(1):1–10.
- Nie X, Nan Q, Guo X, et al. Numerical study of the effect of blood vessel on the microwave ablation shape. BME. 2015;26(s1):S265–S270.
- Bedoya M, del Rio AM, Chiang J, et al. Microwave ablation energy delivery: influence of power pulsing on ablation results in an ex vivo and in vivo liver model. Med Phys. 2014;41(12):123301.
- Hui TCH, Brace CL, Hinshaw JL, et al. Microwave ablation of the liver in a live porcine model: the impact of power, time and total energy on ablation zone size and shape. Int J Hyperthermia. 2020;37(1):668–676.
- Tosoratti N, Cassarino S, Amabile C. Pulsed microwave ablation: a multi-parametric study in ex-vivo bovine liver. J Vasc Interv Radiol. 2016;27(6):e108.
- Haugh C, Davidson ES, Estes NA, 3rd, et al. Pulsing microwave energy: a method to create more uniform myocardial temperature gradients. J Interv Card Electrophysiol. 1997;1(1):57–65.
- Solazzo SA, Ahmed M, Liu Z, et al. High-power generator for radiofrequency ablation: larger electrodes and pulsing algorithms in bovine ex vivo and porcine in vivo settings. Radiology. 2007;242(3):743–750.
- Cavagnaro M, Amabile C, Bernardi P, et al. A minimally invasive antenna for microwave ablation therapies: Design, performances, and experimental assessment. IEEE Trans Biomed Eng. 2011;58(4):949–959.
- Cavagnaro M, Amabile C, Bernardi P, et al. Design and realization of a new type of interstitial antenna for ablation therapies. Proceedings of the 39th European Microwave Conference; 2009 Sept 29–Oct 1; Rome, Italy; 2009.
- Longo I. CNR Industrial Patent N. PI/2001/A/000006. 2004 Mar 11.
- Abraham JP, Sparrow EM. A thermal-ablation bioheat model including liquid-to-vapor phase change, pressure- and necrosis-dependent perfusion, and moisture-dependent properties. Int J Heat Mass Transfer. 2007;50(13-14):2537–2544.
- Pätz T, Kröger T, Preusser T. Simulation of radiofrequency ablation including water evaporation. IFMBE Proceedings. 2009;25(IV):1287–1290.
- Chang IA. Considerations for thermal injury analysis for RF ablation devices. Open Biomed Eng J. 2010;4(1):3–12.
- Pérez JJ, Pérez-Cajaraville JJ, Muñoz V, et al. Computer modeling of electrical and thermal performance during bipolar pulsed radiofrequency for pain relief. Med Phys. 2014;41(7):071708.
- Cavagnaro M, Franco S, Lopresto V, et al. Characterization of a microwave thermal ablation process. Proceedings of 19th Riunione Nazionale di Elettromagnetismo; 10–14 September 2012; Rome, Italy. p. 661–664.
- González-Suárez A, Trujillo M, Burdío F, et al. Feasibility study of an internally cooled bipolar applicator for RF coagulation of hepatic tissue: experimental and computational study. Int J Hyperthermia. 2012;28(7):663–673.
- Duck F. Physical properties of tissue - a comprehensive reference book. New York: Academic Press; 1990.
- Deshazer G, Hagmann M, Merck D, et al. Computational modeling of 915 MHz microwave ablation: Comparative assessment of temperature-dependent tissue dielectric models. Med Phys. 2017;44(9):4859–4868.
- Brace CL, Diaz TA, Hinshaw JL, et al. Tissue contraction caused by radiofrequency and microwave ablation: a laboratory study in liver and lung. J Vasc Interv Radiol. 2010;21(8):1280–1286.
- Farina L, Weiss N, Nissenbaum Y, et al. Characterisation of tissue shrinkage during microwave thermal ablation. Int J Hyperthermia. 2014;30(7):419–428.
- Liu D, Brace CL. CT imaging during microwave ablation: analysis of spatial and temporal tissue contraction. Med Phys. 2014;41(11):113303.
- Rossmann C, Garrett-Mayer E, Rattay F, et al. Dynamics of tissue shrinkage during ablative temperature exposures. Physiol Meas. 2014;35(1):55–67.
- Amabile C, Farina L, Lopresto V, et al. Tissue shrinkage in microwave ablation of liver: an ex vivo predictive model. Int J Hyperthermia. 2017;33(1):101–109.
- Singh S, Melnik R. Coupled thermo-electro-mechanical models for thermal ablation of biological tissues and heat relaxation time effects. Phys Med Biol. 2019;64(24):245008.
- Amabile C, Ahmed M, Solbiati L, et al. Microwave ablation of primary and secondary liver tumours: ex vivo, in vivo, and clinical characterization. Int J Hyperthermia. 2017;33(1):34–42.
- Wang Y, Sun Y, Feng L, et al. Internally cooled antenna for microwave ablation: results in ex vivo and in vivo porcine livers. Eur J Radiol. 2008;67(2):357–361.
- Kuang M, Lu MD, Xie XY, et al. Liver cancer: increased microwave delivery to ablation zone with cooled-shaft antenna–experimental and clinical studies. Radiology. 2007;242(3):914–924.
- Di Vece F, Tombesi P, Ermili F, et al. Coagulation areas produced by cool-tip radiofrequency ablation and microwave ablation using a device to decrease back-heating effects: a prospective pilot study. Cardiovasc Intervent Radiol. 2014;37(3):723–729.
- Berber E. Laparoscopic microwave thermosphere ablation of malignant liver tumors: an initial clinical evaluation. Surg Endosc. 2016;30(2):692–698.
- Zaidi N, Okoh A, Yigitbas H, et al. Laparoscopic microwave thermosphere ablation of malignant liver tumors: an analysis of 53 cases. J Surg Oncol. 2016;113(2):130–134.
- Vietti Violi N, Duran R, Guiu B, et al. Efficacy of microwave ablation versus radiofrequency ablation for the treatment of hepatocellular carcinoma in patients with chronic liver disease: a randomised controlled phase 2 trial. Lancet Gastroenterol Hepatol. 2018;3(5):317–325.
- Ratanaprasatporn L, Charpentier KP, Resnick M, et al. Intra-operative microwave ablation of liver malignancies with tumour permittivity feedback control: a prospective ablate and resect study. HPB (Oxford). 2013;15(12):997–1001.
- Silva NP, Bottiglieri A, Conceição RC, et al. Characterisation of ex vivo liver thermal properties for electromagnetic-based hyperthermic therapies. Sensors (Basel). 2020;20(10):3004.
- Fatieieva Y, Almendárez P, Romero-Méndez R, et al. Comparison of enthalpy method and water fraction method to mathematically model water vaporization during RF ablation. J Adv Biomed Eng Technol. 2014;1(1):1–7.
- Trujillo M, Berjano E. Review of the mathematical functions used to model the temperature dependence of electrical and thermal conductivities of biological tissue in radiofrequency ablation. Int J Hyperthermia. 2013;29(6):590–597.
- Yang D, Converse MC, Mahvi DM, et al. Expanding the bioheat equation to include tissue internal water evaporation during heating. IEEE Trans Biomed Eng. 2007;54(8):1382–1388.