
 ?Mathematical formulae have been encoded as MathML and are displayed in this HTML version using MathJax in order to improve their display. Uncheck the box to turn MathJax off. This feature requires Javascript. Click on a formula to zoom.
Abstract
Objective
To create an improved planning method for pediatric regional hyperthermia (RHT) using the SIGMA-30 applicator (SIGMA-30).
Materials and Methods
An electromagnetic model of SIGMA-30 was generated for use with the finite-difference time-domain (FDTD) method. Applying special MATLAB-based algorithms, voxel models of a pediatric patient with pelvic rhabdomyosarcoma were created from Computed-Tomography (CT) contours for use with the FDTD method and the finite-difference (FD) method capable of using either temperature-independent or temperature-dependent perfusion models for solving the Bioheat Transfer Equation (BHTE). Patient models were parametrized regarding, first, the positioning in the applicator, second, the absorbed power range and, third, different perfusion models, resulting in the so-called Parametrized Treatment Models (PTMs). A novel dedicated optimization procedure was developed based on quantitative comparison of numerical calculations against temperature and power measurements from two RHT therapies.
Results
Using measured data, a realistic absorbed power range in the patient model was estimated. Within this range, several FDTD and BHTE runs were performed and, applying the aforementioned optimization scheme, the best PTMs and perfusion models were identified for each therapy via a retrospective comparison with measurements in 14 temperature sensor positions: 5 in the tumor, 8 in rectum and one in bladder.
Conclusion
A novel dedicated optimization procedure for identification of suitable patient-specific electromagnetic and thermal models, which can be used for improved patient planning, was developed and evaluated by comparison with treatment-derived measurements using SIGMA-30. The optimization procedure can be extended to other hyperthermia applicators and to other patient types, including adults.
Introduction
Along with increasing significance of regional hyperthermia (RHT) therapy for sarcomas and pediatric tumors [Citation1–4], there is a growing need for patient-specific therapy planning procedures including detailed models of pediatric RHT applicators like the SIGMA-30 applicator (SIGMA-30). SIGMA-30 (formerly referred to as the Mini Annular Phased Array Applicator – MAPA) is used as part of BSD-2000 Hyperthermia System (Pyrexar Medical Inc., www.pyrexar.com) [Citation5]. It was originally designed for hyperthermia of limbs and was tested with phantoms and amputee limbs [Citation5–7]. SIGMA-30 was also used in RHT treatments of pediatric patients [Citation3]. However, no systematic comparisons with measurements have been performed for pediatric patients until now.
During RHT therapies, temperatures must be monitored to control heat delivery to the target and to prevent overheating and damages to surrounding healthy tissues [Citation8–10]. For temperature monitoring using temperature sensors, the gold standard is the invasive intratumoral thermometry, but alternative methods such as endocavitary thermometry are also applicable to tumors in the pelvic area [Citation11,Citation12]. On the other hand, development of patient-specific therapy planning has also been the subject of research for many years [Citation13–20]. In the future, accurate temperature predictions could, first, make the need for intratumoral thermometry obsolete and, second, provide a solution for areas less accessible or even inaccessible by endocavitary thermometry like abdominal or extremity areas, which requires a high accuracy of planning methods and models. However, due to the high complexity of the human body and its thermoregulatory system under hyperthermia (e.g., temperature-dependent perfusion changes) special attention is required for creation of perfusion models.
The highly complex perfusion behavior in the human body under hyperthermia has been the subject of numerous investigations both experimental and numerical [Citation19,Citation21–26]. Unfortunately, there is still a lack of not only robust on-line measurement methods under hyperthermia but also of accurate perfusion models which could account for all influence factors, including non-thermal ones, e.g., stress. Therefore, the exact perfusion values in a pediatric patient under hyperthermia are unknown.
Taking these facts into account, our approach, presented in this paper, is to search for the optimal perfusion models via a comparison of numerical calculations with retrospective clinical data, particularly with thermometry and power measurements from two therapies of a pediatric pelvic rhabdomyosarcoma treated with SIGMA-30. To this end, we developed a dedicated procedure based on the optimization of the so-called ‘Parametrized Treatment Models’ (PTMs), i.e., patient-specific electromagnetic and thermal models with different parameter sets. This optimization procedure can be extended to other patient types, including adults, and to different hyperthermia applicators.
Materials and methods
Patient therapy setup
Partially resected pelvic rhabdomyosarcoma in a three-year-old pediatric patient (height 106 cm and weight 17 kg) was treated with hyperthermic chemotherapy under general anesthesia using SIGMA-30 (operating frequency: 123 MHz.) Temperature sensors (Bowman high-impedance thermistors; Pyrexar Medical Inc.) were placed into endocavitary catheters in rectum and bladder, and into an invasive tumor catheter. Temperatures were mapped along the tumor and rectum catheters. Measurements were taken every 1 cm along the catheter. With a tumor diameter of 5.5 cm, this provided a total of 5 measuring points in the tumor. The insertion depth of the rectal catheter was 7 cm, resulting in a total of 8 measuring points along the rectal catheter, including the position ‘0’ at the anus. In contrast, due to the cuff fixation, the temperature sensor in the bladder catheter was fixated at one measuring point, 1 cm above the bladder neck. Consequently, temperatures in a total of Ncath=14 measuring points in the pelvic region were recorded. We refer to these 14 catheter values as a (measured) Temperature Set. Moreover, several vital functions were monitored during anesthesia, including heart rate, blood pressure, oxygen saturation and sublingual temperature.
A total of eight RHT therapies were performed, but only the data of the 3rd and 4th therapy are discussed in this paper. During the 1st and the 2nd therapy, for preventing postoperative infections, a thick gauze bandage was used for the fixation of the tumor catheter, which locally heavily impeded the heat transfer through the skin into the cooling water bolus. For consideration of the heat accumulation underneath the gauze bandage a much more complicated thermal model is needed than that available for calculations performed in this paper. Therefore, the 1st and the 2nd RHT therapy are not discussed in this paper. The gauze bandage was removed before the 3rd therapy. Furthermore, due to therapy design, the tumor catheter was removed after the 4th therapy. For these reasons, the presentation of data is restricted only to the 3rd and the 4th therapy. As the 4th therapy exhibited higher power (and thus higher temperatures) than the 3rd therapy (see Results section), we refer in this paper to the 4th therapy as ‘Higher-Power’-Therapy (HP_THER), and to the 3rd therapy as ‘Lower-Power’-Therapy (LP_THER).
The patient is registered in the HT-Registry Study, which was approved by the Charité’s Ethics Committee (approval no.: EA2/114/14) with written informed consent obtained from the patient’s legal guardian.
Overview of the measurement-based optimization procedure
displays the general workflow of optimization procedure for improved patient-specific RHT planning. First, an electromagnetic model of SIGMA-30 was created for use with the finite-difference time-domain (FDTD) method [Citation27–34]. A Perfectly Matched Layer (PML) formulation for dealing with open boundaries was used [Citation30]. Second, applying our MATLAB-based (MATLAB R2016b) in-house segmentation algorithm [Citation35], Computed-Tomography (CT) -based voxel patient models were generated for use with our in-house FDTD method [Citation31–34] and with our in-house finite-difference (FD) method [Citation36], the latter being capable of using either temperature-independent or temperature-dependent (‘dynamic’) perfusion models for solving the Bioheat Transfer Equation (BHTE), introduced by Pennes in 1948 [Citation37]. Next, patient models were parametrized related to the positioning in the applicator (‘FDTD-related parametrization’) and several FDTD runs were performed, yielding relative SAR distributions. For each FDTD run, a certain ‘channel setting’ (i.e., sets of power amplitudes and phases in amplifier channels connected to the applicator antennas) was applied for simulating the real channel setting used for a therapy. Generally, the determination or choice of a particular channel setting is not part of our optimization procedure, but it acts as an ‘external’ input for both the therapy and the calculations (see the box ‘channel setting’ in ). As a next point, a realistic range of absorbed power in the patient model was derived from measurements, and due to these power values absolute SAR distributions were generated, necessary as inputs for BHTE calculations. On the other hand, BHTE-related parametrizations were performed, resulting in several perfusion models of a patient as other inputs for the BHTE. Combinations of all parametrizations (therapy, positioning, power, perfusion models) are referred to as PTMs. The total number of PTMs (which is identical to the total number of BHTE runs) is indicated in as ‘n’. For each PTM a BHTE run was performed with an absolute temperature distribution as output, containing as a part of the solution also Ncath=14 temperature values at the points along the catheters in locations which were defined by measurements (Temperature Set). In the next step, the best PTMs were found via a root-mean-square-deviation (RMSD)-based minimization using a comparison between the BHTE-calculated and the measured Temperature Sets (from therapies HP_THER and/or LP_THER). Finally, the best perfusion models were identified via dedicated evaluation approaches. The core parts of the optimization routine that are bounded by dashed lines in are described in more detail in in the paragraph Two-Step Optimization, further below. The computer requirements and time to perform the optimization procedure are discussed in the Supplementary material, in the paragraph ‘Supplement Part 5’.
Figure 1. General workflow of the novel optimization procedure for improved regional hyperthermia (RHT) planning using optimization of the so-called ‘Parametrized Treatment Models’ (PTMs) via a root-mean-square-deviation (RMSD)-based comparison between calculated and measured temperatures along tumor, rectal and bladder catheters. An oval form of boxes refers to measurement parts of the optimization scheme. The core parts of the optimization routine that are bounded by dashed lines are described in more detail in .
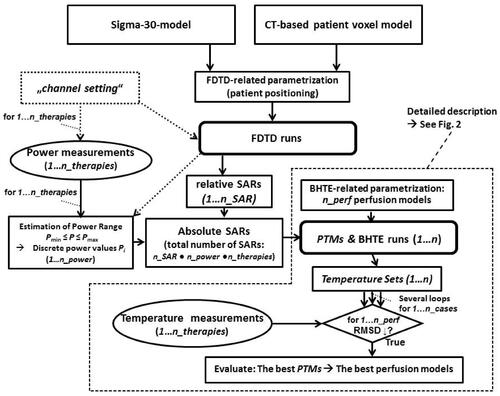
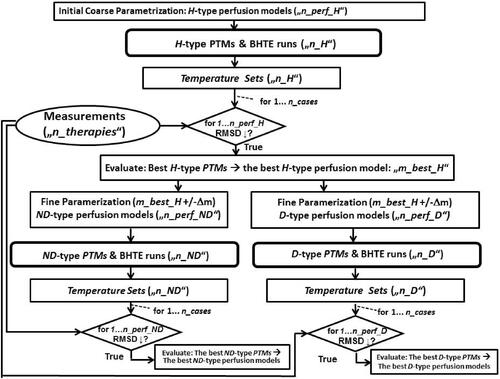
Figure 2. Details of the two-step optimization consisting of a ‘Coarse Step’ using the ‘homogeneous’ (H) ‘Perfusion Behavior Type’ (PBT), and a ‘Fine Step’ using either ‘non-dynamic’ (ND) or ‘dynamic’ (D) PBTs. The optimum whole-body perfusion level found by the Coarse Step (here m = m_best_H = 10 ml/100g/min) is used as a starting point for the Fine Parametrizations/Optimizations. For clarity, the particular numbers used for the case presented in the section Results are displayed in .
In the following, the main steps of the optimization procedure are presented in more detail.
Applicator and patient models
For performing FDTD calculations the two necessary initial steps are, first, creation of a SIGMA-30 model, and, second, of a CT-based patient model ().
SIGMA-30 is the smallest applicator of the SIGMA series of applicators (SIGMA-60, SIGMA-Eye, SIGMA-40, and SIGMA-30, Pyrexar Medical Inc.) used in the Department of Radiation Oncology at Charité Campus Virchow Klinikum. It consists of eight flat copper-strip dipole antennas, connected via tuning/matching networks in pairs to four power amplifier channels. Electromagnetic models of applicators SIGMA-60 and SIGMA-Eye, used in our department, were previously created based on the FDTD method. These applicator models were validated using different methods including lamp matrix comparisons and temperature rise measurements in various homogeneous and inhomogeneous phantoms, as well as Magnetic-Resonance (MR)-thermography measurements [Citation31,Citation38–42]. As a further development of these models, an FDTD model of SIGMA-30 was generated for comparisons including the pediatric case presented in this paper. Before these comparisons the SIGMA-30 model had been tested using a cylindrical agar phantom developed for this purpose (see ‘Supplement Part 1’).
For the creation of the patient model planning CT data of the patient, which included the postoperatively inserted tumor catheter, were acquired. Various structures in the CT data sets (tumor, organ-at-risk, etc.) were manually contoured using the Varian Treatment Planning System (Eclipse Version 11.0). A novel segmentation procedure was developed based on in-house created MATLAB algorithms [Citation35]. The segmentation output results in an optimal combination of clinically/manually contoured regions and HU-threshold-segmented portions. Further details concerning the model creation see ‘Supplement Part 2’ and ‘Supplement Part 5’.
FDTD-related parametrization
In the optimization scheme in , immediately before the step ‘FDTD runs’, a step called ‘FDTD-related parametrization’ is performed. In this step the user may define/change numerical parameters that have impact on the relative SAR-distribution in the patient model. The total number of relative SAR distributions resulting from this kind of parametrization is indicated in as ‘n_SAR’.
Numerous FDTD-relevant effects may be investigated like modifications in the model geometry and resolution, changes in material and electromagnetic properties, but also the use of different antenna or feeding models, or other effects like smoothing of SAR or fluctuations of channel settings (particular amplitude and phase values generated by amplifiers that are connected to the antenna feedpoints). In our paper, however, the focus is on the investigation of the effects of different perfusion models, resulting from the BHTE-related parametrization (see further below), and therefore we restrict the FDTD-related parametrization to the investigations of the influence of the adjustment of the patient model in the applicator model.
Concerning the longitudinal position the patient was positioned so that the central applicator transversal symmetry plane was situated in the central tumor plane, 7 cm caudally from the navel. Possible changes of longitudinal position are not investigated in this paper.
Regarding the transversal position, for avoiding any superficial or subcutaneous hotspots in the anesthetized patient, the default clinical patient positioning for both therapies was ‘central’ (as defined below) and a ‘central channel setting’ was set, too (equal power amplitudes and no phase delays in power channels). Apart from health hazard issues the use of the central channel setting was also reasonable because the tumor region was situated almost centrally. For investigating how the final solution may depend on patient positioning, we introduced the following parametrization related to transversal patient positioning:
‘Central Patient Positioning’ (CE_POS): the center of the patient model was aligned in the center of the applicator so that in the transversal symmetry plane the horizontal distances between patient surface and right/left applicator boundaries were equal (≈5 cm) and the vertical distances between patient surface and top/bottom applicator walls were also equal (
10 cm). The shape of the pediatric patient in the transversal applicator symmetry plane was nearly elliptical with a major axis of 19 cm and a minor axis of 9 cm.
‘Shifted Patient Positioning’ (SH_POS): the patient model was shifted by a distance ‘d’ in the dorsal direction. It is often observed in pediatric patients during therapy in SIGMA-30 that the weight of the patient sinks into the special pediatric-size hammock-like couch, which is made of pliant fabric. Possible effects of such a shift were studied by using this positioning. In accordance with the small size of the pediatric patient, we investigated a dorsal shift of d = 10 mm.
In conclusion, this particular FDTD-related parametrization results in only two different relative SAR distributions, i.e., n_SAR = 2.
FDTD runs
The purpose of this step was SAR calculation via solving Maxwell’s equations by using the FDTD method. For this, FDTD requires a CT-based voxel model of a patient and a model of SIGMA-30 as inputs (). Depending on patient positioning this resulted in two geometry models (CE_POS/SH_POS) which were downsampled to uniform 2.5 mm-grids representing electrical material properties. These grids were used for the staggered FDTD (Yee) lattice with 5 mm distance between E-field components thus providing a clear assignment of the electrical material properties to every E-field component. For each of so generated two FDTD models corresponding to patient positions CE_POS and SH_POS, respectively, a relative SAR distribution was calculated, simulating the central channel setting used for both therapies. For further details concerning FDTD runs see ‘Supplement Part 2’ and ‘Supplement Part 5’.
Power range
As indicated in , the input for every BHTE run was an absolute SAR distribution that can be obtained from the aforementioned relative SAR distribution via multiplication (‘scaling’) of its values in every point of the model grid with a (scalar) power scaling factor ζ = P/Prel. Prel is the absorbed power resulting from integration of the relative SAR in the patient model. P is a desired absolute power value. Note that a given relative SAR distribution can be scaled with different scaling factors, ζi =Pi/Prel, corresponding to different power values Pi, which can belong to a certain power range like that defined in EquationEquation (1)(1)
(1) , below. The volume of integration was given by the FDTD model and was equal for this particular pediatric patient to ∼6.85 liters and the corresponding model mass was ∼7.13 kg (remember that the total mass of the child was 17 kg).
A crucial question is how to choose a particular value of P and thus how to scale the relative SAR for obtaining a realistic absolute SAR as input for a BHTE run. The exact value of absorbed power in the patient is unknown, and also it may vary in time during therapy. However, a certain physically consistent, time-averaged Power Range, (P_range), P_min ≤ P ≤ P_max, can be assumed for every patient model in use. P_range can be derived from power measurements (see Results section, paragraph Clinical measurements and derivation of absorbed power in the patient model). This step of the optimization workflow is indicated on the left side of as an oval box ‘Power measurements’. P_range is a continuous interval, but we approximate it with a set of discrete power values Pi (the total number of power values: n_power), as follows:
(1)
(1)
with Pi= P_min+(i-1) • ΔP, where ΔP =(P_max-P_min)/(n_power − 1).
ΔP is an equidistant spacing between neighboring power values. The necessary condition is n_power >1. Thus, in the simplest case, n_power = 2: P1=P_min and P2=P_max. For our calculations we used five power values, n_power = 5, [see Results section, EquationEquations (11a)(11a)
(11a) and EquationEquation (11b)
(11b)
(11b) ]. Estimation and discretization of P_range according to EquationEquation (1)
(1)
(1) is indicated as a box below the oval box on the left side of (Estimation of Power Range…).
BHTE-related parametrization: perfusion models
As shown in , before BHTE calculations, a parametrization was applied related to thermal properties, especially different perfusion values. We refer to this as parametrization related to different perfusion models. Perfusion models were region-based, i.e., inside a region/organ the perfusion value did not vary from point to point.
All investigated perfusion models of a patient were grouped into three ‘Perfusion Behavior Types’ (PBTs):
‘homogeneous’ (H) Perfusion Behavior Type (H_PBT): all organs/regions had the same perfusion value. (This is the simplest, unrealistic perfusion behavior, used here for fast and coarse estimation of the perfusion in a simplified patient model, as described in the next paragraph Two-Step Optimization).
‘non-dynamic’ (ND) Perfusion Behavior Type (ND_PBT): for every organ/region a temperature-independent perfusion value was defined.
‘dynamic’ (D) Perfusion Behavior Type (D_PBT): for every region a temperature-dependent (‘dynamic’) perfusion model was defined.
Consequently, we refer to ‘H-type’, ‘ND-type’, ‘D-type’ perfusion models.
In the D-type perfusion models the perfusion was allowed to rise twofold or threefold (depending on region) from basal perfusion values, described by the so-called ‘ramp functions’ similar to Equation (3) in [Citation36] (there used only for muscle and fat), dependent on the calculated temperature, T, as follows:
(2)
(2)
where R = 0.8 and S = 3 for muscle and fat,and where R = 0.4 and S = 2 for the tumor, rectum, bladder and bones.
Note that in our paper the basal values used in Equation (2) are – in difference to Equation (3) in [Citation36] – not fixed, but are part of an optimization problem.
In the historical context, functions similar to Equation (2) were used, for instance, in [Citation43] and [Citation44]. Further details of the approaches in [Citation43] and [Citation44], as well as the rationale for using particular tissue properties (mainly based on [Citation44]), are discussed in detail in [Citation36], Section ‘B. Thermal Tissue Properties’.
The total number of perfusion models of a patient (indicated as ‘n_perf’ in ), arising from the BHTE-related parametrization, can be formulated as follows:
(3)
(3)
In EquationEquation (3)(3)
(3) the corresponding consecutive perfusion indices are i_perf = 1…n_perf_TYPE, where n_perf_TYPE, ‘TYPE’= ‘H’ or ‘ND’ or ‘D’ are the total numbers of H- or ND- or D-type perfusion models of a patient.
In general, for each of the three PBTs the total number of perfusion models of a patient can be formulated as a combination of region perfusion models in the following way:
(4)
(4)
where ‘TYPE’= ‘H’or ‘ND’ or ‘D’.
n_reg is the total number of regions in a perfusion model of a patient.
J_H(i_reg), J_ND(i_reg), J_D(i_reg) is the total number of perfusion models for a given region i_reg. Note that for H_PBT: n_reg = 1.
Two-step optimization
According to EquationEquation (4)(4)
(4) , J_TYPE(i_reg), i.e., the total number of perfusion values/models created per region can be extremely high or even theoretically infinite. Thus, the general aim is to limit the total number of perfusion models to a discrete number, but still yielding reasonable results within P_range. As demonstrated in , in our optimization procedure this discretization of perfusion values is performed in two steps: Coarse Step (Pre-optimization) and Fine Step (Optimization). The coarse pre-optimization uses H_PBT, the Fine Optimization uses ND_PBT or/and D_PBT, respectively. The aim is to coarsely estimate a whole-body perfusion level (indicated in as ‘m_best_H’) that optimally corresponds to the applied power levels that were defined in EquationEquation (1)
(1)
(1) . For evaluation, we use the so-called ‘Highest-Incidence-Index’ approach (see the last paragraph in the section Materials and Methods). In the Fine-Optimization step, region perfusion values are varied, which is indicated in as ‘m_best_H ±Δm’. For definition of the particular region perfusion values/models see the section Results.
PTMs
Due to the FDTD- and BHTE-related parametrizations and discretization of P_range several combinations of, 1, therapy, 2, positioning, 3, power level, and, 4, perfusion were created, referred to as PTMs. The total number of PTMs for each of the three PBTs can be determined as follows:
(5)
(5)
In EquationEquation (5)(5)
(5) ‘TYPE’= ‘H’ or ‘ND’ or ‘D’, n_therapies: total number of investigated therapies; n_SAR: total number of relative SAR distributions due to the FDTD-related parametrization; n_power: total number of power values representing P_range for one therapy (see EquationEquation (1)
(1)
(1) ); and, n_perf_TYPE as explained in EquationEquation (3)
(3)
(3) .
In our particular case in the section Results the values are: n_therapies = 2, n_SAR = 2, n_power = 5, but, generally, other values are also possible.
In analogy to EquationEquation (3)(3)
(3) the total number of PTMs can be given as follows:
(6)
(6)
where by n_H, n_ND, n_D are defined via EquationEquation (5)
(5)
(5) .
BHTE runs
For each of n PTMs a BHTE run was performed using our FD scheme, presented in the Appendix of [Citation36]. The general BHTE formulation is not repeated here, it is presented, for instance, in Equations (1) and (2) in [Citation36]. For detailed information about thermal and material parameters applied for solving the BHTE see ‘Supplement Part 3’.
The transient temperature behavior in every voxel of the BHTE model is not discussed in this paper, but it is similar to the ‘steady imaging SAR’ (‘S-SAR’) mode curve shown in Figure 4 in [Citation36] with a temperature increase phase and a steady-state phase with a (maximum) constant temperature. Only steady-state temperatures are used for comparisons of Temperature Sets in EquationEquation (7)(7)
(7) further below (see also again and Citation2). These temperature comparisons are described in the next paragraphs. For further details to BHTE runs see ‘Supplement Part 3’ and ‘Supplement Part 5’.
Figure 3. Parametrized treatment models (PTMs) for the case presented in the section Results, created as parameter combinations, involving: •two relative SAR distributions (‘central’ and ‘shifted’ patient positioning). •two therapies [‘Higher-Power’-Therapy (HP_THER) and ‘Lower-Power’-Therapy (LP_THER), each of them represented by a power range of absorbed power in patient, approximated by five power levels each thus resulting of a total of 20 absolute SAR distributions]. •three different PBTs [homogeneous (H) with 7 perfusion models, non-dynamic (ND) with 1350 perfusion models, and, dynamic (D) with 1536 perfusion models], resulting in the total number of PTMs of n = 57.860, equal to the total number of BHTE runs.
![Figure 3. Parametrized treatment models (PTMs) for the case presented in the section Results, created as parameter combinations, involving: •two relative SAR distributions (‘central’ and ‘shifted’ patient positioning). •two therapies [‘Higher-Power’-Therapy (HP_THER) and ‘Lower-Power’-Therapy (LP_THER), each of them represented by a power range of absorbed power in patient, approximated by five power levels each thus resulting of a total of 20 absolute SAR distributions]. •three different PBTs [homogeneous (H) with 7 perfusion models, non-dynamic (ND) with 1350 perfusion models, and, dynamic (D) with 1536 perfusion models], resulting in the total number of PTMs of n = 57.860, equal to the total number of BHTE runs.](/cms/asset/e2157d38-2804-42a9-af04-8ea4d264c7ba/ihyt_a_1909757_f0003_b.jpg)
RMSD-based optimization
The general purpose of this step and the following ‘Evaluation’ step () is to find those PTMs and perfusion models which best match the measured data.
To this end all n PTMs (and some sets of PTMs, see below) were grouped together, due to the particular therapy (HP_THER/LP_THER), positioning (CE_POS/SH_POS), and power level (P1…P5) (and additionally also due to the entire power range, see below). This resulted in a certain total number of cases, n_cases, (in our optimization scheme, the total number of n_cases is for each PBT identical). Then, for each case, i_case, a minimum RMSD value was identified via comparison of a total number of n_perf_TYPE perfusion models, as follows:
(7)
(7)
where θi: measured temperatures shortly before power-off in i = 1…N points, and, Ti: calculated steady-state temperatures in i = 1…N points.
In the simplest case the total number of squared differences, N, is equal to the total number of catheter points, Ncath (here 14), but for some additional cases, if several PTMs are grouped together, it can also be equal to multiples of Ncath (see below).
In this paper, those PTMs which exhibit minimum RMSD according to EquationEquation (7)(7)
(7) using N=Ncath are referred to as ‘suitable PTMs’. Their total number is identical for each PBT and can be specified, using EquationEquations (5)
(5)
(5) and Equation(6)
(6)
(6) , by the following expression:
(8)
(8)
In the particular case presented in the section Results, n_suitable_ptm = 2•2•5 = 20.
Furthermore, we refer to a particular PTM that exhibits a minimum RMSD in EquationEquation (7)(7)
(7) among some specified group of suitable PTMs as the ‘optimum’ PTM.
Our dedicated PTM comparison procedure in terms of RMSD-based minimization in EquationEquation (7)(7)
(7) was composed of two parts.
Part 1: ‘SINGLE-PTM-RMSD-Minimization’ (N = Ncath)
In Part 1, the RMSD-based minimization was performed on ‘single’ PTMs (i.e., without grouping them together). Thus, the total number of squared differences, N, in EquationEquation (7)(7)
(7) was equal to Ncath(Ncath=14 in our particular case), resulting in the total number of results identical to the total number of suitable PTMs in EquationEquation (8)
(8)
(8) (20 results in our particular case).
Part 2: ‘ALL5-RMSD-Minimization’
In Part 2, those PTMs which were related to the same power range [Equations (1b) and (1c)] were grouped together into sets of PTMs, each set containing a total number of n_power PTMs (here n_power = 5, hence ‘ALL5’). Each set of PTMs was ‘simultaneously’ evaluated in a single RMSD expression, thus N = n_power•Ncath in EquationEquation (7)(7)
(7) , resulting in our particular case in 70 (instead of 14 in Part 1) calculated temperature values Ti in EquationEquation (7)
(7)
(7) . Finally, due to this RMSD-based minimization scheme including above Parts 1 and Part 2, the total number of cases used in EquationEquation (7)
(7)
(7) can be calculated using the following expression (identical for each PBT):
(9)
(9)
whereby the value ‘n_suitable_ptm’ is specified in EquationEquation (8)
(8)
(8) . In our particular case presented in the section Results: n_cases = 20 + 2•2 = 24.
We refer to those perfusion models that are associated with the cases in EquationEquation (9)(9)
(9) and optimized via EquationEquation (7)
(7)
(7) as ‘suitable perfusion models’. Their total number can be as high as n_cases. Usually, however, it is much smaller because a particular suitable perfusion model can be associated with more than one case in EquationEquation (9)
(9)
(9) .
Evaluation: identification of optimum perfusion models
We present below three Perfusion Evaluation Approaches for identifying optimum perfusion models of a patient among all suitable perfusion models associated with n_cases in EquationEquation (9)(9)
(9) .
Perfusion evaluation approach 1: (SinglePTM approach)
This evaluation approach (‘Approach 1’) considers only the results of SINGLE-PTM-RMSD-Minimization. Among a defined group of suitable PTMs, the PTM with the minimum RMSD is determined (optimum PTM) and the perfusion model associated with this PTM is selected as the optimum perfusion model for Approach 1. This approach, however, should rather not be used for the prospective planning (i.e., prediction of the next therapy data) because there is rather a low probability that the aforementioned optimum PTM – with a particular power level and other particular parameters associated with this PTM – will be the best one for the next therapy, too. In contrast, this approach yields the best retrospective therapy information.
Perfusion evaluation approach 2: (ALL5-Approach)
This evaluation approach (‘Approach 2’) considers only the results of ALL5-RMSD-Minimization. Among a defined group of ALL5 cases, the case with the minimum RMSD is determined and the perfusion model associated with this ALL5 case is selected as the optimum perfusion model for Approach 2.
This approach is more general than Approach 1 (it includes a whole power range instead of one particular power value) and can be applied for prospective planning for the next therapy of the same patient when it is assured that the next therapy will be carried out similarly like the case associated with the optimum perfusion model (similar patient positioning, similar power range, the same channel setting, etc.).
This approach yields also good retrospective information about the therapy or therapies which were already performed, but, due to its averaging nature, not as exact as Approach 1.
Perfusion evaluation approach 3: (‘Highest-Incidence-Index’ approach)
This evaluation approach (‘Approach 3’) considers both the results of SINGLE-PTM-RMSD-Minimization and of ALL5-RMSD-Minimization. Approach 3 selects that perfusion model which was the most frequently occurring among a defined group of suitable PTMs and a defined group of ALL5 cases, whereby the descriptor is the so-called ‘Incidence Index’, ∑N, defined for a particular suitable perfusion model of a patient as follows:
(10)
(10)
where n_single: total number of suitable PTMs containing a particular suitable perfusion model of a patient, n_range: total number of ALL5 cases containing this suitable perfusion model. (This means, with n_power = 5, a fivefold weighting of those suitable perfusion models that are associated with ALL5-RMSD-Minimization). Thus, ∑N is equal to the total number of squared differences in EquationEquation (7)
(7)
(7) associated with a particular suitable perfusion model of a patient (examples see Results section).
Approach 3 is the most general one because the identified perfusion model of the patient is associated with the highest number of different cases, e.g., originating from two therapies, from two patient positioning cases and from two different power ranges, like in our case in the section Results. Thus, it can be applied for the prospective planning for the next therapy of the same patient when, e.g., the power range and/or the patient positioning are not yet exactly known. This approach can also be used for different/new patients. However, in this case a reasonable preselection of parameters and generation of ‘therapy-clusters’ is necessary, which represent similar therapies/cases. In contrast, due to the high number of involved different cases this approach yields still valuable but rather coarsely averaged retrospective information about the therapy or therapies which were already performed.
In conclusion, it is recommended to perform the retrospective analysis including all three perfusion evaluation approaches and to apply Approach 2 and/or Approach 3 for prospective planning. Moreover, only Approach 3 was used for the H_PBT–based coarse pre-optimization (). Further details of the particular use of these approaches can be found in Discussion.
Results
Clinical measurements and derivation of absorbed power in the patient model
reports relevant measured temperature and power values. The latter were used for derivation of particular values for P_range in EquationEquation (1)(1)
(1) (P_max = 113 W and P_min = 93 W for LP_THER and P_max = 120 W and P_min = 100 W for HP_THER) resulting in the following power levels, five for each therapy, respectively:
(11a)
(11a)
(11b)
(11b)
Table 1. Clinically measured power and temperature values for two investigated therapies of a pediatric pelvic rhabdomyosarcoma: Higher-Power-Therapy (HP_THER) in the middle column, and Lower-Power- Therapy (LP_THER) in the right column.
Note that in EquationEquations (11a)(11a)
(11a) and Equation(11b)
(11b)
(11b) the equidistant spacing between neighboring power values, ΔP, defined in EquationEquation (1)
(1)
(1) , is ΔP = 5 W for both HP_THER and LP_THER.
The derivation of particular values in EquationEquations (11a)(11a)
(11a) and Equation(11b)
(11b)
(11b) using forward and reflected power measurements and FDTD calculations is described in detail in ‘Supplement Part 4’.
Results of the PTM-based optimization procedure
The identification of suitable (and optimum) PTMs and perfusion models of the patient was performed applying the Two-Step Optimization scheme as depicted in . The main optimization steps are presented below as Steps 1–6.
For reasons of clarity, in , parameter combinations are displayed for our special case: n_therapies = 2 (HP_THER/LP_THER); n_SAR = 2 (CE_POS/SH_POS); n_power = 5, n_perf_H = 140, n_perf_ND = 1350, n_perf_D = 1510, resulting in the total number of PTMs of n = 57.860. The particular total numbers of perfusion models of the patient, n_perf_H, n_perf_ND, n_perf_D, see Step 1 and Step 4, below.
Figure 4. A root-mean-squared-deviation (RMSD)-based minimization in Equation (7) for the best case in for the parameter combination [‘Higher-Power’-Therapy (HP_THER), ‘dynamic Perfusion Behavior Type’ (D_PBT), ‘Central Patient Positioning’ (CE_POS), P = 120 W absorbed power in patient]. Displayed are RMSD values for all (i_perf = 1…n_perf_D = 1536) dynamic (D)-type perfusion models, as defined in EquationEquation (13)(13)
(13) , associated with this case (indicated as ‘MODEL-NUMBER’ on the abscissa). The minimum RMSD was found for the index i_perf = 1001, i.e. for perfusion model D-1001. RMSD values range from 0.3882 °C (for i_perf = 1001) to almost 5 °C. The latter high RMSD values were obtained for low perfusion model indices, i.e. (too) low tumor and rectum perfusion values.
![Figure 4. A root-mean-squared-deviation (RMSD)-based minimization in Equation (7) for the best case in Table 3 for the parameter combination [‘Higher-Power’-Therapy (HP_THER), ‘dynamic Perfusion Behavior Type’ (D_PBT), ‘Central Patient Positioning’ (CE_POS), P = 120 W absorbed power in patient]. Displayed are RMSD values for all (i_perf = 1…n_perf_D = 1536) dynamic (D)-type perfusion models, as defined in EquationEquation (13)(13) m_tumor= 2.5→5 | 5→10 | 7.5→15 | 10→20m_rectum= 2.5→5 | 5→10 | 7.5→15 | 10→20m_bladder= 1.25→2.5 | 2.5→5 | 5→10m_muscle= 3.33→10 | 5→15 | 10→30 | 13.33→40m_fat= 1→3 | 2→6 | 2.5→7.5 | 3.33→10m_bone= 1.25→2.5 | 2.5→5,(13) , associated with this case (indicated as ‘MODEL-NUMBER’ on the abscissa). The minimum RMSD was found for the index i_perf = 1001, i.e. for perfusion model D-1001. RMSD values range from 0.3882 °C (for i_perf = 1001) to almost 5 °C. The latter high RMSD values were obtained for low perfusion model indices, i.e. (too) low tumor and rectum perfusion values.](/cms/asset/cd43e1d7-8ca2-4d1e-8b7a-8ba6d86f3211/ihyt_a_1909757_f0004_c.jpg)
Step 1: initial coarse BHTE-related parametrization using H_PBT
In this initial step, H_PBT was assumed to be valid for the whole patient [n_reg = 1 in EquationEquation (4)(4)
(4) ] with uniform thermal properties equal to those of muscle (2nd line from the bottom in ). Seven perfusion levels were investigated [i_perf_H = 1…n_perf_H = 7 in EquationEquation (3)
(3)
(3) ] with typical perfusion values of m = 2.5, 5, 7.5, 10, 15, 20, and 30 ml/100g/min), resulting in a total number of n_H = 140 PTMs [n_H = 2•2•5•7 in EquationEquation (5)
(5)
(5) ] to be compared. The range of above seven basal perfusion values includes typical values used in the literature for muscle and fat tissue. Again, a good overview is given in [Citation36], but other hyperthermia groups use values in this range, too. For instance, in [Citation17,] the values for fat/muscle/tumor perfusion of fat are given as Wb = 1.1/3.6/1.8 kg/m3/s, which, with Wb=ρ⋅ρb⋅ m, is equivalent to m ≈ 7/20/10 ml/100g/min, respectively.
Table 2. Tissue perfusion values in perfusion models exhibiting the non-dynamic (ND) and dynamic (D) Perfusion Behavior Type (PBT) in the optimization procedure described in , , and .
In the following, for simplicity, the perfusion unit (ml/100g/min) is skipped. Moreover, a short notation is introduced for perfusion models of the patient, which refers to the consecutive perfusion index i_perf, as follows: ‘H-1’, ‘H-2’…’H-7’. Thus, H-1 refers to i_perf = 1 (m = 2.5), ‘H-4’ refers to i_perf = 4 (m = 10), etc. A similar notation is introduced for ND-type and D-type perfusion models of the patient, e.g., ‘D-1001’.
Step 2: coarse pre-optimization using H_PBT
After the coarse parametrization 140 BHTE runs were performed and 140 calculated Temperature Sets were compared with two measured ones in terms of RMSD values in EquationEquation (7)(7)
(7) , involving, both parts, Part 1, SINGLE-PTM-RMSD-Minimization [N= Ncath=14 in EquationEquation (7)
(7)
(7) ] and, Part 2, ALL5-RMSD-Minimization [N = 70 in EquationEquation (7)
(7)
(7) ]. Due to EquationEquation (9)
(9)
(9) this resulted in 24 comparison cases (20 SINGLE-PTM cases and 4 ALL5 cases).
The optimization results for H_PBT are listed in the lines 5-10 of and Citation4, respectively (24 cases for HP_THER and for LP_THER, respectively). For every case, using the aforementioned short notation, the respective number of each suitable perfusion model exhibiting minimum RMSD according to EquationEquation (7)(7)
(7) is also reported. The lines 5-9 refer to SINGLE-PTM-RMSD-Minimization (10 suitable PTMs per therapy, 5 for CE_POS and 5 for SH_POS), for each of the five power values separately. The 10th line refers to ALL5-RMSD-Minimization (2 ALL5 results per therapy, one for CE_POS and one for SH_POS).
Table 3. Optimization results in terms of minimum root-mean-square-deviation (RMSD) values, as defined in EquationEquation (7)(7)
(7) , for the Higher-Power-Therapy (HP_THER) for both Optimization Steps (Coarse, Fine).
Step 3: evaluation: identifying the optimum H-type perfusion model
The purpose of this step was to identify a particular perfusion model (indicated as ‘m_best_H’ in ) as a starting point for the next step, i.e., the fine optimization. As this purpose was merely a prospective one (and no particular cases were to be preferred/excluded) only the most general perfusion evaluation approach, Approach 3 (‘Highest-Incidence-Index’ Approach) was applied.
According to and the whole body perfusion was identified as m = m_best_H = 10 (perfusion model H-4) for 22 of 24 cases. Only for two cases in (LP_THER, P = 113 W, both patient positions) the suitable perfusion model was H-5 (m = 15). Applying EquationEquation (10)(10)
(10) for the perfusion model H-4, i.e., summating all ‘N-values’ in and Citation4 that are associated with H-4, we end up with the Incidence Index, ∑N, as high as 532 (18•14 + 4•70), and for H-5 we obtain only ∑N = 28.
Table 4. Optimization results only for the ‘Lower-Power’-Therapy (LP_THER) in terms of minimum RMSD values, displayed in an analogous way to .
summarizes, in the right column, the results of Approach 3 displaying the corresponding Incidence Index ∑N. The two H-type perfusion models can be found in lines 2-3. Furthermore, all suitable perfusion models (i.e., those which are displayed in and Citation4) are reported in alphabetic order and all region perfusion values/models are listed.
Table 5. Region perfusion values of all perfusion models reported in Tables 3 and 4.
Step 4: fine BHTE-related parametrization: creating ND-type and D-type perfusion models
In this step, with knowledge of the optimum whole-body perfusion m = m_best_H = 10, as found above, perfusion values of different organs/regions were specified, which is indicated in as ‘m_best_H ±Δm’. Apart from the perfusion, no other tissue-specific thermal properties were parametrized. Their (fixed) values as used for ND_PBT and D_PBT are indicated in .
The creation of ND-type and D-type perfusion models of the patient was performed for six regions, n_reg = 6 in EquationEquation (4)(4)
(4) . In the source code implementation six nested loops were written with a consecutive perfusion index or global loop counter i_perf = 1…n_perf_ND (or …n_perf_D). The outer loop was used for tumor perfusion values and the innermost loop for bone perfusion values.
For ND_PBT the highest number for perfusion values, five, was allowed for the two tissues with inserted catheters, in the tumor and in rectum. For these regions two perfusion values were chosen beneath m = 10, and two above. Following ND-type perfusion values were set for each of the six regions (a symbol ‘|’ is used as a delimiter):
(12)
(12)
The total number of ND-type perfusion patient models of the patient n_perf_ND, can be calculated as a combination of region perfusion models defined in EquationEquation (12)(12)
(12) , yielding, according to EquationEquation (4)
(4)
(4) , n_perf_ND = 5•5•3•3•3•2 = 1350.
Almost analogically, the loop structure for D_PBT was realized. However, the use of D_PBT, with varying/dynamic perfusion values in each region, allowed a better ‘covering’ of the perfusion range, so we used only 4 tumor and rectum perfusion models instead of 5 in N_PBT. In turn, the number of fat and muscle perfusion models was increased in comparison to N_PBT, from 3 to 4. For simplicity, we describe dynamic region perfusion models in EquationEquation (2)(2)
(2) using a short notation with arrows like ‘5 → 10’ for a double perfusion increase, or ‘5→15’ for the threefold increase. The following D-type region perfusion models were set for each of the six regions:
(13)
(13)
The total number of D-type perfusion models of the patient, n_perf_D, can be calculated as a combination of region perfusion models defined in EquationEquation (13)(13)
(13) , yielding, according to EquationEquation (4)
(4)
(4) , n_perf_D = 4•4•3•4•4•2 = 1536.
Step 5: PTM creation and fine optimization using ND_PBT and D_PBT
In this step, with the perfusion models identified in EquationEquation (12)(12)
(12) , a total number of n_ND = 27000 ND-type PTMs was created and 27000 BHTE runs were performed (EquationEquation (5)
(5)
(5) , and ). Similarly, due to EquationEquation (13)
(13)
(13) , n_D = 30720 PTMs and BHTE runs were applied for D_PBT, respectively. Next, all calculated Temperature Sets were compared with two measured Temperature Sets (for HP_THER and LP_THER) in terms of minimum RMSD (EquationEquation (7)
(7)
(7) ), using SINGLE-PTM-RMSD-Minimization and ALL5-RMSD-Minimization, resulting, in accordance with EquationEquation (9)
(9)
(9) , in an identical number of comparison cases, n_cases = 24, for each of the two PBTs, respectively (20 single PTM cases and 4 ALL5 cases).
In analogy to H_PBT optimization results of all 2•24 cases are listed in terms of minimum RMSD values (2•12 results for HP_THER in and 2•12 results for LP_THER in , respectively). ND_PBT cases are displayed in the middle segment (lines 12-17) of and , respectively, whereas D_PBT cases are listed in the bottom segment of these tables (the last 6 bottom lines).
Generally, RMSD values for HP_THER () were lower than those for LP_THER () and CE_POS yielded overall better results than SH_POS. In addition, ND-type results were overall slightly worse than D-type results (but much better than H-type results).
In we illustrate the RMSD-based minimization via EquationEquation (7)(7)
(7) for the comparison between i_perf = 1…n_perf_D = 1536 calculated Temperature Sets (indicated as ‘MODEL-NUMBER’ on the abscissa) and one measured Temperature Set for HP_THER. The comparison is made for the case that is associated with the optimum PTM (among all PTMs) parameter combination ‘(D_PBT Λ HP_THER Λ CE_POS Λ P = 120 W)’, which is marked in bold in in the next paragraph. A minimum RMSD value (0.3882 °C) was found for ‘i_perf = 1001’, i.e., for a PTM that involves the perfusion model D-1001. High RMSD values (up to almost 5 °C) were obtained for low perfusion model indices that are associated with obviously too low tumor and rectum perfusion values.
Step 6: evaluation of optimum ND-type and D-type perfusion models
Perfusion evaluation approach 1 (SINGLE-PTM approach)
Among all 20 ND-type and 20 D-type suitable PTMs, the optimum PTM [with the lowest RMSD in and Citation4 (0.3882 °C, marked bold in )] was a D-type PTM and was characterized by the following parameter combination: ‘(D-1001 Λ HP_THER Λ CE_POS Λ P = 120 W)’. An optimum ND-type PTM (RMSD = 0.5882 °C, thus worse than D-1001, also marked bold in ) was obtained for the following combination: ‘(ND-1011 Λ HP_THER Λ CE_POS Λ P = 120 W)’. Thus, as a result of Approach 1 the dynamic perfusion model D-1001 and the non-dynamic perfusion model ND-1011 were found as optimum perfusion models. For particular perfusion values/models see . Both Approach-1 results are shown in in the next paragraph.
Figure 5. Comparison of measured [for the Higher-Power-Therapy (HP_THER), black dashed curve with cross symbols] and calculated ‘Temperature Sets’ of the pelvic region along the tumor, rectal, and bladder catheters in 14 points: 5 in tumor catheter (0 cm corresponds to the caudal-medial catheter tip), 8 in rectal catheter (0 cm corresponds to anus), and one in bladder catheter, and Calculated results refer to the optimum Parametrized Treatment Models (PTMs) for each ‘Perfusion Behavior Type’ (PBT), respectively. These PTMs are indicated as follows: •‘H-4-centr-105 W’ (red, circle symbols) [homogeneous perfusion model H-4, central patient positioning (CE_POS), absorbed power in the patient model P = 105W]. •‘ND-1011-centr-120W’ (blue, square symbols) (non-dynamic perfusion model ND-1011, CE_POS, P = 120W), and, • ‘D-1001-centr-120W’ (purple, triangle symbols) (dynamic perfusion model D-1001, CE_POS, P = 120W). Region perfusion values are displayed in .
![Figure 5. Comparison of measured [for the Higher-Power-Therapy (HP_THER), black dashed curve with cross symbols] and calculated ‘Temperature Sets’ of the pelvic region along the tumor, rectal, and bladder catheters in 14 points: 5 in tumor catheter (0 cm corresponds to the caudal-medial catheter tip), 8 in rectal catheter (0 cm corresponds to anus), and one in bladder catheter, and Calculated results refer to the optimum Parametrized Treatment Models (PTMs) for each ‘Perfusion Behavior Type’ (PBT), respectively. These PTMs are indicated as follows: •‘H-4-centr-105 W’ (red, circle symbols) [homogeneous perfusion model H-4, central patient positioning (CE_POS), absorbed power in the patient model P = 105W]. •‘ND-1011-centr-120W’ (blue, square symbols) (non-dynamic perfusion model ND-1011, CE_POS, P = 120W), and, • ‘D-1001-centr-120W’ (purple, triangle symbols) (dynamic perfusion model D-1001, CE_POS, P = 120W). Region perfusion values are displayed in Table 5.](/cms/asset/59d77b40-f113-4778-818a-d0cc85760c75/ihyt_a_1909757_f0005_c.jpg)
Perfusion evaluation approach 2 (ALL5 approach)
The optimum ALL5 value (among all ALL5 values) was associated with a dynamic perfusion model D-994 (HP_THER Λ CE_POS, RMSD = 0.5417 °C, marked in bold in ). For ND_PBT an optimum ALL5 result was obtained again for HP_THER and was characterized by the perfusion model ND-992 and CE_POS (RMSD = 0.5882 °C, marked in bold in ). Thus, as a result of Approach 2 the dynamic perfusion model D-994 and the non-dynamic perfusion model ND-992 were found as optimum perfusion models. For particular perfusion values/models see .
In conclusion, all optimum perfusion models, found via Approach 1 and Approach 2, were obtained for HP_THER and CE_POS. Furthermore, the RMSD values in are generally lower than those in , thus HP_THER was better approximated by the optimization procedure than LP_THER.
Perfusion evaluation approach 3 (‘Highest-Incidence-Index’ approach)
As demonstrated in , the optimum perfusion models found via Approach 3 were D-906 for D_PBT (∑N = 154, marked in bold) and ND-955 for ND_PBT (∑N = 140, marked in bold, too), respectively. The dynamic perfusion model D-906 is present in (HP_THER) for three power values for SH_POS and for one ALL5 value, for SH_POS, too. Furthermore, this perfusion model can be found in (LP_THER) also for three power values for CE_POS. The non-dynamic perfusion model ND-955 is present in (HP_THER) for two power values for SH_POS and for one ALL5 value for SH_POS, too. Moreover, in (LP_THER), this perfusion model can be found for one power value for CE_POS and two power values for SH_POS.
Perfusion evaluation approaches 1 and 2 for LP_THER
If skipping and comparing only LP_THER (), Approach 1 yields as an optimum perfusion model D-913 (LP_THER Λ CE_POS Λ 113 W), with the RMSD value as high as 0.61 °C. This is much higher than 0.3882 °C which was the best case in . The model D-913 is also the optimum perfusion model for the entire P_range (Approach 2) yielding 0.6358 °C for RMSD. Thus, D-913 proves to be a useful perfusion model for LP_THER alone. For ND_PBT, moreover, Approach 1 yields as an optimum perfusion model ND-943 (LP_THER Λ CE_POS Λ 108 W) with RMSD = 0.6308 °C. Both Approach-1 results are shown in in the next paragraph.
Figure 6. Comparison of measured [for the Lower-Power-Therapy (LP_THER), black dashed curve with cross symbols] and calculated ‘Temperature Sets’ in points explained in the legend of Figure 6. Calculated results refer to those PTMs, which exhibited the minimum RMSD in , i.e. those which are the best for LP_THER only, for each perfusion behavior type (PBT), respectively. These PTMs are indicated as follows: •‘H-4-centr-93 W’ (red, circle symbols) (homogeneous PBT, CE_POS, p = 93 W). •‘ND-943-centr-108’ W (blue, square symbols) (non-dynamic PBT, CE_POS, p = 108 W), and •‘D-913-centr-108W’ (purple, triangle symbols) (dynamic PBT, CE_POS, p = 108 W). Region perfusion values are displayed in .
![Figure 6. Comparison of measured [for the Lower-Power-Therapy (LP_THER), black dashed curve with cross symbols] and calculated ‘Temperature Sets’ in points explained in the legend of Figure 6. Calculated results refer to those PTMs, which exhibited the minimum RMSD in Table 4, i.e. those which are the best for LP_THER only, for each perfusion behavior type (PBT), respectively. These PTMs are indicated as follows: •‘H-4-centr-93 W’ (red, circle symbols) (homogeneous PBT, CE_POS, p = 93 W). •‘ND-943-centr-108’ W (blue, square symbols) (non-dynamic PBT, CE_POS, p = 108 W), and •‘D-913-centr-108W’ (purple, triangle symbols) (dynamic PBT, CE_POS, p = 108 W). Region perfusion values are displayed in Table 5.](/cms/asset/a9df2f14-fc3b-4f37-a3b7-2ff808b44b0f/ihyt_a_1909757_f0006_c.jpg)
Graphical comparison along the catheters for both therapies
In we graphically compare temperatures which were measured along the catheters in the steady-state phase of HP_THER shortly before ‘power-off’ (black dashed curve) with three calculated Temperature Sets which were associated with the optimum PTMs in , each one for each of the three PBTs, respectively (H_PBT, ND_PBT, D_PBT). A similar comparison is performed in for the optimum PTMs in for LP_THER. For both therapies measured temperatures in the tumor were slightly higher than in rectum. Temperatures for HP_THER were on average higher than those for LP_THER by around 0.5–1 °C (see also ). The highest temperature value for HP_THER was measured in the bladder (black cross icon). For LP_THER the highest temperature value was in the center of the tumor. In the tumor, a decrease in temperature toward the lateral tumor margin (point 4) was observed, which may be explained by cooling effects originating from water bolus or by higher perfusion values for the tumor margin than for the tumor center. In the rectum, the temperatures were relatively constant, except for a decrease toward the caudal end (point 0). This can be explained by the influence of extracorporeal temperature conditions (cooling effects) at the anus.
The H-type PTMs exhibited for both therapies too high temperatures in the tumor and too low in rectum. Interestingly, improvement in inhomogeneous case was not due to lowering rectum perfusion in comparison to that of the tumor, but rather by lowering the fat perfusion and at the same time by equally increasing both rectum and tumor perfusion values (compare, in , the region perfusion values between the models H-4 and ND-1011 or between the models H-4 and D-1001).
In conclusion, although a substantial minimization of RMSD values was achieved (), no one of the optimum PTMs exactly approximated the characteristic tumor temperature behavior that exhibited a temperature increase in the central tumor part, especially in the case of LP_THER (). In contrast, a good approximation of temperature behavior in rectum was achieved. Probably, for future comparisons, a more complicated subtumoral model is needed, for instance with a less perfused tumor center and a higher perfused margin.
Discussion
This paper describes a novel optimization procedure for standardized comparisons in patient models using clinical measurements (temperature profiles along the catheters shortly before power-off and power measurements). The procedure is presented using data of two hyperthermia therapies of the same pediatric patient treated in SIGMA-30.
Forward and reflected power measurements and FDTD calculations were used for identification of the absorbed power range for each therapy. For comparisons, involving both the FDTD and the BHTE, various combinations of, 1, therapies, 2, patient positioning in the applicator, 3, power levels/ranges, and, 4, perfusion models were created, referred to as Parametrized Treatment Models (PTMs). Three different perfusion behavior types (PBTs) were investigated, homogeneous (H), non-dynamic (ND) and dynamic (D). Perfusion models were region-based, i.e., inside a region/organ the perfusion value did not vary from point to point. Three approaches for evaluation of the best perfusion models for both retrospective analysis and prospective planning were presented.
In the PTM-related retrospective analysis, the PTM with the lowest RMSD (0.3882 °C) was a D-type PTM which was characterized by the following parameter combination: ‘(D-1001 Λ HP_THER Λ CE_POS Λ P = 120 W)’. However, it cannot be generally expected that the dynamic perfusion model D-1001 that was identified to be the optimum one for the retrospective analysis (Perfusion Evaluation Approach 1) will be the best one for the prospective planning, too. This is because it is rather a low probability that the aforementioned optimum PTM – with the particular power level of 120 W and other particular parameters associated with this PTM – will be the best one for the next therapy, too. This can rather be expected for the dynamic perfusion model D-994, the optimum one among all ALL5 results (Approach 2) which was associated with the parameter combination ‘(HP_THER Λ CE_POS, RMSD = 0.5417 °C)’ when it is assured that the next therapy is carried out similarly like the case associated with the perfusion model D-994 [similar patient positioning CE_POS, similar power range to that specified in EquationEquation (11a)(11a)
(11a) and the same channel setting]. With other words, a perfusion model like perfusion model D-994, the optimum model for Approach 2, which optimally approximates 5 power values [values in EquationEquation (11a)
(11a)
(11a) ], is more likely to approximate the next power value (in the next therapy) than a model that approximates a single power value (for instance a power of 120 W that is ‘required’ for the perfusion model D-1001, the optimum model for Approach 1).
The Perfusion Evaluation Approach 3 identifies the best perfusion model via the Highest-Incidence Index, ∑N, defined in EquationEquation (10)(10)
(10) . As explained in the section Materials and Methods, this approach is the most general one, and it can be applied for the prospective planning for the next therapy of the same patient and/or for different/new patients. However, in the latter case it requires a reasonable preselection of parameters and generation of ‘therapy-clusters’ representing similar therapies/cases. In contrast, due to the high number of involved different cases this approach yields still valuable but rather coarsely averaged retrospective information about the therapy or therapies which were already performed.
Note that all optimum perfusion models identified via Approach 1 and Approach 2 relate to HP_THER and CE_POS. Thus, firstly, the higher-power therapy was easier to approximate than the lower-power one, and, secondly, the real positioning of the patient in the applicator was indeed more similar to the central one than to the shifted one. Moreover, all optimum perfusion models identified via Perfusion Evaluation Approaches 1-3 exhibited the dynamic perfusion behavior type (D-1001 for Approach 1, D-994 for Approach 2, and D-906 for Approach 3). Thus, the dynamic perfusion behavior specified in EquationEquation (2)(2)
(2) seems to be a very useful model for hyperthermia treatment planning.
In general, presentation of the results in terms of all cases, like it is done in and Citation4, is strongly recommended. In this way, evaluation of parameter combinations which are subsets of n_cases, can be performed, for instance only those cases which are associated with one particular therapy, one particular positioning, etc., can be selected. These constellations of cases should be selected depending on the purpose. If, for instance, a third therapy of the same patient should be predicted from the retrospective data of two previous ones, then the perfusion evaluation should include data of both therapies (like HP_THER and LP_THER in Approach 3 resulting in the identification of the perfusion model D-906). If a completely new patient is planned, only data of similar patients should be included in the database.
Such prospective planning purposes can result in a further generalization of RMSD-based optimization, i.e., a further increase of the value of ‘N’ in EquationEquation (7)(7)
(7) after a reasonable selection of cases for the database, depending on the concrete purpose. Following this methodology, the next step beyond the RMSD-based minimization scheme presented in this paper could be an enlargement of N to 140 or even to N = 280. In an ‘optimization sense’ this would be equivalent to searching for a single perfusion model that is related ‘simultaneously’ to 20 power values, two therapies and two patient positions (instead of searching for many optimum perfusion models case by case as presented in this paper). These ‘N-enlargement cases’ are not shown in this paper in detail, but, interestingly, they result in an identification of the same perfusion model D-906 that was also found using Approach 3, confirming the general nature of this perfusion model. Alternatively/additively, several cases originating from different therapies and different power ranges can be included in the evaluation scheme. Due to the general nature of Approach 3, it can be applied to other RMSD-based minimization schemes originating from any combinations of particular values of N in EquationEquation (7)
(7)
(7) and the evaluation can consider any number of cases, applying weighting procedures similar to those in EquationEquation (10)
(10)
(10) . For proving if these – theoretically plausible – perfusion evaluation approaches are useful in clinical practice, further investigations are needed in the near future.
The optimization procedure is presented for a pediatric patient in SIGMA-30, but it can be easily extended to other patient types, including adults, and it can be applied to other hyperthermia applicators. The necessary condition for obtaining realistic perfusion values is, however, estimation of a reasonable range of absorbed power in a given patient for a given applicator.
The future goal is to be able to predict any therapy using prospective analysis based on such patient-specific PTMs and – by improving the accuracy of planning methods and models – to reduce the need of thermometry. This requires a higher number of parameters than those investigated in this paper (several channel settings, more perfusion models, various patient positions, etc.). Moreover, data derived from local T-rise/-drop measurements in patients can also be included into future PTM comparisons, requiring, however, additional comparison formulas to that in EquationEquation (7)(7)
(7) . For that, further retrospective investigations are needed to build a database, including a sufficiently large pool of different therapies based on optimization procedure principles developed in this paper, resulting in a cumulative learning effect from one therapy to the next. Moreover, collecting PTM data of different patient therapies to the aforementioned database would allow prediction of temperatures in similar patients in the future. To this end, this paper is the first step in this perspective.
Conclusions
A novel procedure for identification of patient-specific electromagnetic and thermal models with different parameter settings and parameters, which we refer to as Parametrized Treatment Models, was developed and evaluated by comparison with measurements obtained from two clinical hyperthermia therapies of a pediatric patient treated in SIGMA-30. The determining factor for accurate calculations of patient-specific therapy planning was the proper choice of the perfusion models according to the specified absolute values of the absorbed power in the patient model. For identification of optimum perfusion models, which can be used for improved patient planning, dedicated evaluation approaches were proposed. The optimization procedure can be extended to other patient types, including adults, and to different hyperthermia applicators. The future goal is to be able to predict temperature during any therapy using prospective analysis based on such patient-specific PTMs and – by improving the accuracy of planning methods and models – to reduce the need of thermometry.
Supplemental Material
Download PDF (187.2 KB)Disclosure statement
I hereby declare that the author and coauthors of this manuscript have no conflicts of interest in the authorship or publication of this contribution.
Correction Statement
This article has been republished with minor changes. These changes do not impact the academic content of the article.
Additional information
Funding
References
- Issels RD, Lindner LH, Verweij J, European Organization for the Research and Treatment of Cancer-Soft Tissue and Bone Sarcoma Group and the European Society for Hyperthermic Oncology, et al. Effect of neoadjuvant chemotherapy plus regional hyperthermia on long-term outcomes among patients with localized high-risk soft tissue sarcoma: The EORTC 62961-ESHO 95 randomized clinical trial. JAMA Oncol. 2018;4(4):483–492.
- Wessalowski R, Schneider DT, Mils O, et al. An approach for cure: PEI-chemotherapy and regional deep hyperthermia in children and adolescents with unresectable malignant tumors. Klin Padiatr. 2003;215(6):303–309.
- Wessalowski R, Schneider DT, Mils O, MAKEI study group, et al. MAKEI study group. Regional deep hyperthermia for salvage treatment of children and adolescents with refractory or recurrent non-testicular malignant germ-cell tumours: an open-label, non-randomised, single-institution, phase 2 study. Lancet Oncol. 2013;14(9):843–852.
- Seifert G, Budach V, Keilholz U, et al. Regional hyperthermia combined with chemotherapy in paediatric, adolescent and young adult patients: current and future perspectives. Radiat Oncol. 2016;11:65.
- Turner PF. Mini-annular phased array for limb hyperthermia. IEEE Trans Microwave Theory Techn. 1986;34(5):508–513.
- Charny CK, Guerquin‐Kern JL, Hagmann MJ, Levin SW, et al. Human leg heating using a mini-annular phased array. Med Phys. 1986;13(4):449–456.
- Charny CK, Levin RL. A three-dimensional thermal and electromagnetic model of whole limb heating with a MAPA. IEEE Trans Biomed Eng. 1991;38(10):1030–1039.
- Dewhirst MW, Viglianti BL, Lora-Michiels M, et al. Basic principles of thermal dosimetry and thermal thresholds for tissue damage from hyperthermia. Int J Hyperthermia. 2003;19(3):267–294.
- van Rhoon GC, Samaras T, Yarmolenko PS, et al. CEM43 thermal dose thresholds: a potential guide for magnetic resonance radiofrequency exposure levels? Eur Radiol. 2013;23(8):2215–2227.
- Nadobny J, Klopfleisch R, Brinker G, et al. Experimental investigation and histopathological identification of acute thermal damage in skeletal porcine muscle in relation to whole-body SAR, maximum temperature, and CEM43 °C due to RF irradiation in an MR body coil of birdcage type at 123 MHz. Int J Hyperthermia. 2015;31(4):409–420.
- Fatehi D, van der Zee J, Notenboom A, et al. Comparison of intratumor and intraluminal temperatures during locoregional deep hyperthermia of pelvic tumors. Strahlenther Onkol. 2007;183(9):479–486.
- Wust P, Cho CH, Hildebrandt B, et al. Thermal monitoring: invasive, minimal-invasive and non-invasive approaches. Int J Hyperthermia. 2006;22(3):255–262.
- Sullivan DM, Ben-Yosef R, Kapp DS. Stanford 3D hyperthermia treatment planning system. Technical review and clinical summary. Int J Hyperthermia. 1993;9(5):627–643.
- Wust P, Seebass M, Nadobny J, et al. Simulation studies promote technological development of radiofrequency phased array hyperthermia. Int J Hyperthermia. 1996;12(4):477–494.
- Gellermann J, Wust P, Stalling D, et al. Clinical evaluation and verification of the hyperthermia treatment planning system hyperplan. Int J Radiat Oncol Biol Phys. 2000;47(4):1145–1156.
- Lagendijk JJ. Hyperthermia treatment planning. Phys Med Biol. 2000;45(5):R61–76.
- Kok HP, Van Haaren PMA, Van de Kamer JB, et al. High-resolution temperature-based optimization for hyperthermia treatment planning. Phys Med Biol. 2005;50(13):3127–3141.
- Paulides MM, Stauffer PR, Neufeld E, et al. Simulation techniques in hyperthermia treatment planning. Int J Hyperthermia. 2013;29(4):346–357.
- Wust P. Thermotherapy in oncology. Bremen: UNI-MED Verlag; 2016.
- Kok HP, Kotte ANTJ, Crezee J. Planning, optimisation and evaluation of hyperthermia treatments. Int J Hyperthermia. 2017;33(6):593–607.
- Lüdemann L, Wust P, Gellermann J. Perfusion measurement using DCE-MRI: implications for hyperthermia. Int J Hyperthermia. 2008;24(1):91–96.
- Cheng KS, Yuan Y, Li Z, et al. The performance of a reduced-order adaptive controller when used in multi-antenna hyperthermia treatments with nonlinear temperature-dependent perfusion. Phys Med Biol. 2009;54(7):1979–1995.
- Acker JC, Dewhirst MW, Honoré GM, et al. Blood perfusion measurements in human tumours: evaluation of laser Doppler methods. Int J Hyperthermia. 1990;6(2):287–304.
- Lagendijk JJ, Hofman P, Schipper J. Perfusion analyses in advanced breast carcinoma during hyperthermia. Int J Hyperthermia. 1988;4(5):479–495.
- Lagendijk JJ. The influence of bloodflow in large vessels on the temperature distribution in hyperthermia. Phys Med Biol. 1982;27(1):17–23.
- Rosen BR, Belliveau JW, Chien D. Perfusion imaging by nuclear magnetic resonance. Magn Res Q. 1989;5:263–281.
- Yee K. Numerical solution of initial boundary value problems involving Maxwell's equations in isotropic media. IEEE Trans Antennas Propag. 1966;14(3):302–307.
- Sullivan DM. Electromagnetic simulation using the FDTD method. 2nd ed. Hoboken, NJ: IEEE Press, Wiley; 2013.
- Sullivan DM. Mathematical methods for treatment planning in deep regional hyperthermia. IEEE Trans Microwave Theory Tech. 1991;39(5):862–872.
- Sullivan DM. An unsplit step 3-D PML for use with the FDTD method. IEEE Microw Guid Wave Lett. 1997;7(7):184–186.
- Nadobny J, Fähling H, Hagmann MJ, et al. Experimental and numerical investigation of feed-point parameters in a 3-D hyperthermia applicator using different FDTD models of feed networks. IEEE Trans Biomed Eng. 2002;49(11):1348–1359.
- Nadobny J, Pontalti R, Sullivan DM, et al. A thin-rod approximation for the improved modeling of bare and insulated cylindrical antennas using the FDTD Method. IEEE Trans Antennas Propagat. 2003;51(8):1780–1796.
- Nadobny J, Sullivan DM, Wust P, et al. A high-resolution interpolation at arbitrary interfaces for the FDTD method. IEEE Trans Microwave Theory Techn. 1998;46(11):1759–1766.
- Nadobny J, Sullivan DM, Wlodarczyk W, et al. A 3-D tensor FDTD-formulation for treatment of sloped interfaces in electrically inhomogeneous media. IEEE Trans Antennas Propagat. 2003;51(8):1760–1770.
- Nadobny J, Weihrauch M, Zschaeck S, et al. Fast and efficient generation of patient models for hyperthermia based on radiation therapy contours. Strahlenther Onkol. 32nd Annual Meeting of the European Society for Hyperthermic Oncology; 2018 May 16–19; Berlin/Germany; 194. p. 492–493 PO8.
- Nadobny J, Szimtenings M, Diehl D, et al. Evaluation of MR-induced hot spots for different temporal SAR modes using a time-dependent finite difference method with explicit temperature gradient treatment. IEEE Trans Biomed Eng. 2007;54(10):1837–1850.
- Pennes HH. Analysis of tissue and arterial blood temperatures in the resting human forearm. J Appl Physiol. 1948;1(2):93–122.
- Gellermann J, Wlodarczyk W, Ganter H, et al. A practical approach to thermography in a hyperthermia/magnetic resonance hybrid system: validation in a heterogeneous phantom. Int J Radiat Oncol Biol Phys. 2005;61(1):267–277.
- Wust P, Fähling H, Brünner M, et al. Visualization and registration of three-dimensional E-field distributions in annual-phased-array applicators. Med Phys. 1999;26(4):653–659.
- Wust P, Berger J, Fähling H, et al. Scanning E-field sensor device for online measurements in annular phased-array systems. Int J Radiat Oncol Biol Phys. 1999;43(4):927–937.
- Wust P, Beck R, Berger J, et al. Electric field distributions in a phased-array applicator with 12 channels: measurements and numerical simulations. Med Phys. 2000;27(11):2565–2579.
- Wust P, Fähling H, Wlodarczyk W, et al. Antenna arrays in the SIGMA-eye applicator: interactions and transforming networks. Med Phys. 2001;28(8):1793–1805.
- J. Lang J, Erdmann B, Seebass M. Impact of nonlinear heat transfer on temperature control in regional hyperthermia. IEEE Trans Biomed Eng. 1999;46(9):1129–1138.
- Bernardi P, Cavagnaro M, Pisa S, et al. Specific absorption rate and temperature increases in the head of a cellular-phone user. IEEE Trans Microwave Theory Techn. 2000;48(7):1118–1127.