
 ?Mathematical formulae have been encoded as MathML and are displayed in this HTML version using MathJax in order to improve their display. Uncheck the box to turn MathJax off. This feature requires Javascript. Click on a formula to zoom.
Abstract
Background
The success of cancer hyperthermia (HT) treatments is strongly dependent on the temperatures achieved in the tumor and healthy tissues as it correlates with treatment efficacy and safety, respectively. Hyperthermia treatment planning (HTP) simulations have become pivotal for treatment optimization due to the possibility for pretreatment planning, optimization and decision making, as well as real-time treatment guidance.
Materials and methods
The same computational methods deployed in HTP are also used for in silico studies. These are of great relevance for the development of new HT devices and treatment approaches. To aid this work, 3 D patient models have been recently developed and made available for the HT community. Unfortunately, there is no consensus regarding tissue properties, simulation settings, and benchmark applicators, which significantly influence the clinical relevance of computational outcomes.
Results and discussion
Herein, we propose a comprehensive set of applicator benchmarks, efficacy and safety optimization algorithms, simulation settings and clinical parameters, to establish benchmarks for method comparison and code verification, to provide guidance, and in view of the 2021 ESHO Grand Challenge (Details on the ESHO grand challenge on HTP will be provided at https://www.esho.info/).
Conclusion
We aim to establish guidelines to promote standardization within the hyperthermia community such that novel approaches can quickly prove their benefit as quickly as possible in clinically relevant simulation scenarios. This paper is primarily focused on radiofrequency and microwave hyperthermia but, since 3 D simulation studies on heating with ultrasound are now a reality, guidance as well as a benchmark for ultrasound-based hyperthermia are also included.
1. Introduction
Hyperthermia therapy (HT), heating tumor tissue within 40–44 °C, is an adjuvant cancer treatment that has shown to be a potent sensitizer to radiotherapy and chemotherapy [Citation1,Citation2]. HT is typically applied using radiofrequency (RF) or microwave (MW) electromagnetic waves, but other modalities, such as focused ultrasound (FUS), infrared, ferromagnetic seeds, and magnetic nanoparticles, are also used for HT delivery [Citation3,Citation4]. Although clinical results clearly favor the use of adjuvant HT, the generally assumed optimum temperature of 43 °C in the entire target region is usually not achieved in clinical practice [Citation5,Citation6]. On the one hand, treatment with current devices is associated with substantial unwanted heating in normal tissues (hot spots), which prevents adjustment of total power to induce the desired target temperature. Also, the temperature in the target region is inhomogeneous due to region-specific, strongly variable and unknown tissue properties [Citation7]. On the other hand, current thermal dosimetry during treatment is very limited, leading to an incomplete picture of the heating patterns achieved. Hence, both improvement of HT delivery techniques, as well as HT dosimetry, are warranted to bring HT to the twenty first century.
To address the aforementioned limitations, computational modeling of RF/MW/FUS applicator designs and HT treatment optimization play an important role [Citation3,Citation8–10]. However, in contrast to the availability of simulation tools and computational power, our understanding of tissue properties and the most suitable hyperthermia treatment planning (HTP) techniques is only slowly increasing. The choices that have to be made in simulations are often unclear and/or incomplete but strongly influence the absorbed power and temperature predictions. In addition, the enhanced availability of modeling tools and all their different numerical methods have led to a situation in which comparison of the benefits of the various computational modeling strategies is nearly impossible. This lack of standardization limits further progress in the HT field, which motivated the European Society of Hyperthermic Oncology (ESHO) to launch the ESHO Grand Challenge 2021 on HT-based computational modeling, including HTP, which is aimed at accelerating progress in simulation-based HT technology (Appendix 1 and 2). Hereto, we present guidelines and benchmarks for computational modeling of HT applications designed to ensure uniformity of in silico modeling and improve HTP quality.
HTP involves a two-step process: first, the specific absorption rate (SAR) in W/kg or Power Loss Density (PLD) in W/m3 is calculated, which is then integrated into the heat transfer analysis to compute temperature (T). [The de facto unit standard of temperature in HT clinical practice is degrees centigrade (°C), not the SI unit Kelvin (K).] HTP has a prominent role in the guidance of clinical assessments, but the same simulation techniques also provide a framework to develop and optimize novel HT devices and treatment strategies. The role of HTP in clinical guidance is multifold and includes (1) the selection of applicator type and arrangement [Citation11–16], (2) analysis of the applicator heat-ability in nonstandard clinical cases [Citation11,Citation12,Citation17,Citation18], (3) as the basis for interdisciplinary discussions, and (4) investigation to what extent potential contraindications compromise treatment. HTP is also used during treatment for the (5) treatment adaptation based on measurements or feedback from the patient [Citation19–21]. After treatment, HT-based computational modeling helps in (6) retrospective analyses of the suitability of the settings used during treatment. Another area where HTP plays an important role is (7) the education and training of hyperthermia technicians, physicists, and physicians. Besides these seven treatment-related applications of HTP, it also has a prominent role in the design and optimization of novel devices and treatment strategies, and as part of closed-loop control using rapid, model-guided, treatment adaptation based on feedback during treatment administration.
Initially, HTP using computational modeling was mainly a research tool and, therefore, not mentioned in any quality assurance (QA) document in hyperthermia. Empirical steering protocols were used, which are rather effective because of the relatively large wavelengths associated with frequencies used in the clinic (60–120 MHz) and the relatively low numbers of antennas per applicator. However, significant progress in HTP, as described in several review papers [Citation9,Citation22,Citation23], increased clinical use, and the QA guidelines reported for the first time by Bruggmoser et al. in 2012 recommend the routine use of HTP [Citation24]. Clinical investigations showed that treatment quality could indeed be ensured or improved by the use of HTP [Citation19–21,Citation25]. In superficial and interstitial hyperthermia QA guidelines, patient-specific HTP is now mentioned as a tool to gain an understanding of the quality of the applied heat distribution [Citation26,Citation27] like in cases that deviate from typical treatment situations [Citation11,Citation12,Citation17]. However, while HTP is gaining traction, there is limited convergence toward standard computational practices, tissue properties and benchmark models. The exception relies on the IT’IS Foundation tissue properties database that includes dielectric, acoustic, thermal, perfusion, and other properties [Citation28]. Besides being the most up-to-date tissue properties database, it provides unambiguous traceability via a unique Digital Object Identifiers (DOI).
The purpose of this paper is to define benchmarks for computational modeling of HT studies using clinically-derived patient models that can be utilized to assess the potential clinical improvement offered by the various HT technologies. These include new applicators or optimization techniques. In this respect, a set of anatomical models for studying the application of hyperthermia in the pelvis and head and neck (H&N) areas was recently published and made available to the general public [Citation29]. Building on these anatomical models, we added two breast cancer patient models and further suggest consistent tissue properties and simulation approaches, which allow comparison of the performance of different devices, algorithms and treatment approaches. Hereto, we describe open-source computational anatomical models and simplified applicator models that mimic those used in the clinic, as well as simulation settings, quality metrics, and optimization goals (functionals). In this paper, the focus is on RF/MW HT, but guidance on FUS is also provided. Our intent is to use patient models as well as applicator setups and procedures matching those accepted in clinical practice. In summary, this paper serves to:
provide benchmarks to verify the correctness of a treatment modeling implementation and to support quality assurance;
provide benchmarks to assess and compare the performance of treatment optimization approaches;
provide guidance on computational treatment modeling, as well as input for future standardization.
Finally, this paper is intended to serve as the basis for the ESHO 2021 Grand-challenge on hyperthermia computational modeling . This challenge aims at invigorating and streamlining progress in hyperthermia device development and treatment strategy research, by providing standardized simulation benchmarks to evaluate the predicted clinical improvement. In other words, it serves to provide the forum to display the potential of new hyperthermia developments in a standardized framework introduced in this paper. The new developments can include the comparison of different treatment planning approaches, optimization strategies and applicators for existing disease sites, as well as provide guidance for novel applicators for novel sites. Further, in order to stimulate cross-modality comparisons, the challenge is open not only for RF/MW but also US technologies. The details are provided in Appendix 2 and at https://www.esho.info/GrandChallenge, where registration for the ESHO grand challenge is possible.
2. Materials and methods
The following sections will cover all steps required to generate a computational model for a wide range of hyperthermia applications. Most methods and recommendations have been published elsewhere, but have not been compiled into one cohesive guideline, a gap that we aim to address in the following sections.
2.1. Patient models
In HTP simulation studies, cylindrical, homogeneous or healthy-volunteer-based models are commonly used [Citation12,Citation14,Citation17,Citation30–35]. However, these models lack the necessary anatomical details, do not include the changes in patient anatomy due to tumor growth and/or the patient/volunteer posture is different from treatment position. Several studies have shown the non-representative nature of such models [Citation12,Citation14,Citation17,Citation35]. We recommend using realistic patient models in hyperthermia modeling investigations and therefore propose a set of six patient models that cover some of the most common hyperthermia treatment sites with these considerations in mind.
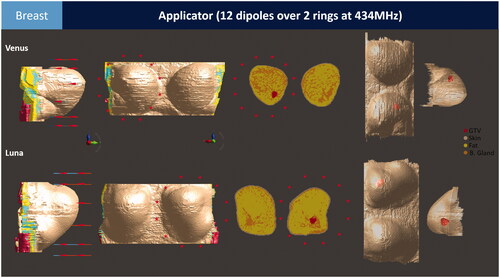
Computer-aided design (CAD) models of four patients were selected from the Erasmus Virtual Patient Repository (EVPR) [Citation29] and two newly developed breast patient models are considered as the baseline for our benchmark studies (). The EVPR models are from patients referred for regular hyperthermia in the pelvic and H&N regions. For the pelvic region, we selected two patients treated for cervical (Clarice) and rectal cancer (Will), where the rectal tumor was significantly large and thus more challenging to heat. Both H&N cases were challenging, which reflects the fact that hyperthermia in this region is intrinsically complex, and many patients present heating complications for different reasons. One of the patient models presents a nasopharynx tumor (Alex) and the other is a postoperative case (Murphy) with no gross tumor volume (GTV) present. For the breast models, we included one patient with a superficial tumor (Venus) and another with a deep-seated tumor (Luna). As in the clinical routine, models of patients with H&N (Alex, Murphy) or breast (Venus, Luna) cancer have a hyperthermia target volume (HTV) that comprises the GTV plus a margin of 10 mm, whereas for pelvic cancer patients models, the HTV was the same as the GTV. More details on these EVPR models can be found in [Citation29].
Figure 1. The benchmark pelvic applicator consists of 12 half-wavelength dipole antennas distributed over two rings. The benchmark patient models Clarice and Will include tumors in the pelvic region. Note that the hyperthermia target volume (HTV) is the same as the gross tumor volume (GTV). The GTV is shown on the right in 3 D together with just the skeleton for easier visualization of the target.
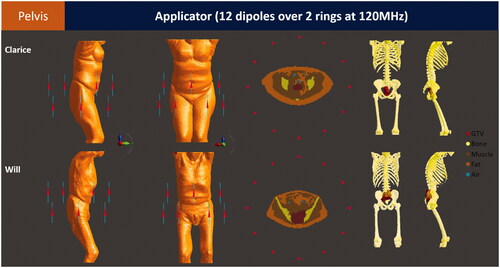
Figure 2. The benchmark H&N applicator consists of twelve half-wavelength dipole antennas distributed over three rings. The benchmark patient models Alex and Murphy include a tumor in the nasopharynx and oropharynx regions (postoperative case), respectively. Only bones and tumors are shown for clarity, please refer to and for the complete list of tissues used in the model.
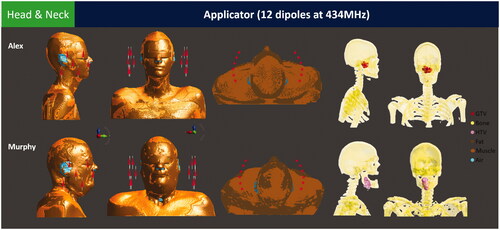
Figure 3. The benchmark breast applicator consists of 12 half-wavelength dipole antennas distributed over two rings. The benchmark patient models Venus and Luna include a superficial and a deep-seated tumor, respectively.
2.2. Benchmark applicators
The proposed benchmark applicators were developed using simplified versions of reference applicators (). A recent publication by Paulides et al. [Citation3] provides a comprehensive review of commercial RF/MW applicators in clinical use for the combination of chemotherapy with hyperthermia. From the list of clinical applicators, we took inspiration from the BSD Sigma family (Pyrexar, Salt Lake City UT, USA) [Citation36,Citation37], and the HyperCollar (Erasmus MC, Rotterdam, the Netherlands) [Citation38–40] as well as HyperCollar3D (Sensius BV, Rotterdam, The Netherlands) [Citation11,Citation41,Citation42] applicators. Our selection was based on the large body of literature, the standard application of HTP for these devices, and the distinctly different body sites they are intended for: pelvic, H&N and breast regions. Note that, currently, there is no clinical phased-array applicator for breast hyperthermia; therefore, we propose a benchmark applicator based on the HyperCollar design. The proposed benchmark applicators contain a non-redundant number of antennas for focused heating at depth [Citation43] and to accommodate different treatment planning algorithms. Note that the applicators include simple dipole antennas to enable easy implementation, regardless of the software used for simulation.
Table 1. Description of the reference and correspondent simplified benchmark applicators.
The pelvic applicator ( and ) contains twelve independent half-wavelength dipole antennas (total length of 195 mm with an 8 mm gap/feed) operating at 120 MHz and placed along the z-axis (caudal-cranial) in two antenna rings separated by 19.5 cm. As in any hyperthermia applicator, a water compartment (water bolus) is added to cool the superficial tissues and couple energy from the antennas toward the target [Citation44]. For the benchmark applicator, the water bolus covers the antenna array and has a cylindrical shape with a diameter of 48.4 cm and a height of 59 cm. The H&N applicator consists of an array of twelve half-wavelength dipole antennas (total length of 51 mm with an 8 mm gap/feed) operating at 434 MHz and placed along the z-axis (caudal-cranial). The antennas are arranged over three rings (separated by 4.5 cm) in a horse-shoe configuration (arc = 240°) () to avoid placing antennas near the nose, chin, ears and neck. The water bolus of our simplified setup has a cylindrical shape with a diameter of 34 cm and a height of 16 cm. Note that the water bolus covers the nose and eyes in this simplified setup, but in the clinical applicators, it has a tailored shape to allow for breathing and verbal feedback as well as preventing claustrophobia. The breast applicator consists of an array of twelve half-wavelength dipole antennas (total length of 51 mm with an 8 mm gap/feed) operating at 434 MHz and placed along the y-axis (dorsal-ventral). The antennas are arranged over two rings (separated by 29.5 mm) and equidistantly spaced by 60° (). This arrangement was inspired by a previous adaptation of the HyperCollar applicator for testing hyperthermia feasibility in a model of a patient with breast cancer [Citation45]. The water bolus of our simplified setup has a cylindrical shape with a diameter of 22 cm and a height of 16 cm. The exact location of each antenna and patient center point is provided in Appendix 3 (Table A1).
2.3. Electromagnetic (EM) modeling benchmark
Several EM-simulation methods have been described in the literature [Citation46], either based on the differential or integral form of Maxwell’s equations. The electromagnetic field distribution is typically calculated using finite-difference time-domain (FDTD) or finite-element (FEM) methods. To avoid reflections of the electromagnetic waves at the boundaries of the computational domain, several variations of absorbing boundary conditions can be used, of which the perfectly matched layer is recommended as the most effective [Citation47,Citation48]. For metallic surfaces, the use of a perfect electric conductor boundary condition is recommended.
Another fundamental requirement for the numerical solution to be valid is mesh-independence. Time-domain methods like FDTD typically use a Cartesian grid, so the term grid is often used instead of mesh. Meshes for electromagnetic problems are often developed as a function of the wavelength in tissue (λt). As a rule of thumb, the numerical problem can be initiated with a maximum mesh size of λt/4 (FDTD) and λt/8 (FEM), whereas an accurate solution will be achieved by increasing the grid refinement to λt/15-λt/10 (FDTD) and λt/8- λt/6 (FEM) [Citation49]. The resolution of the mesh needs to be finer for regions with higher spatial gradients. Nowadays, approaches exist that refine the resolution in locations with high dielectric contrast, sharp/fine features, or metallic objects, e.g., iterative, local-error-estimator-driven adaptive mesh refinement or subgridding. Some manual adjustments are recommended to improve mesh convergence. For instance, accurate modeling of microstrip antennas commonly used in applicators requires at least 2 mesh cells within the substrate thickness, 2–4 mesh cells across a strip, and 2 mesh lines in a radiating gap such as the dipoles used in this paper [Citation49]. The EM modeling of the benchmark applicators was performed using the EM FDTD solver of Sim4Life (v.5.2.0, Zurich MedTech, Zurich, Switzerland). The antennas were excited with harmonic signals and simulated for 20 periods to ensure steady state has been reached (for implicit solvers, convergence-assessment based on residuum reduction – by at least 8 orders of magnitude, and until no significant changes are observed – is recommended instead). Different grids were used to calculate the numerical solutions for the pelvic, H&N and breast benchmark models. For the pelvic model, a maximum grid size of 5 mm was used in tissue and a maximum grid size of 1.5 mm was used in the benchmark HT applicator. For the H&N and breast models, a maximum grid size of 1.5 mm was used in tissue and a maximum grid size of 0.75 mm was used in the benchmark HT applicator. Then, the calculated field distributions from irregular grid was intrapolated to a uniform grid of 5 mm for the pelvis models and 2.5 mm for the breast and head and neck models before optimizing the fields.
Convergence of the solution must be carefully ascertained. A convergent solution is reached when the results of interest do not change significantly with increasing mesh refinement steps. Please note that convergence is not yet a guarantee for solution correctness. For example, thermal staircasing errors at boundaries are method-inherent and not reduced by mesh refinement. For the electromagnetic component of HTP, we recommend plotting the maximum SAR or TC50 as a function of the number of mesh elements and choosing the mesh such that the chosen parameter does not vary by more than 1% between iterations, assuming a mesh refinement factor of 1.3 per iteration. The parameter TC50 corresponds to the volume percentage of the HTV covered by the 50% iso-SAR contour.
The EM energy is converted into heat through the lossy nature of the tissue. The energy absorbed in the tissue can be described by the SAR parameter, which corresponds to the rate at which EM energy absorbed per unit mass of tissue:
where σ (S/m) is the electrical conductivity, ρ (kg/m3) is the mass density, and |E| (V/m) is the magnitude of the local electric field vector. The interaction of electromagnetic fields with biological tissue is typically investigated using a macroscopic model involving the dielectric properties, i.e., relative permittivity εr and σ. We suggest using the IT’IS Foundation tissue property database v4.0 [28], which is the current de facto standard for HTP and simulation studies. This database is currently the most exhaustive collection of physical properties of human tissues. However, this database only contains healthy tissues properties; so, for tumor dielectric properties, we propose using the interpolated average from a variety of tumor tissues (bladder, colon, kidney, liver, lung, lymph nodes, mammary, spleen, and testes) measured within 50–900 MHz [Citation50]. To reduce the error from the interpolation, we used a Lagrange 3rd degree interpolating polynomial using the measured properties within 50–200 MHz for 120 MHz and 300–500 MHz for 434 MHz ().
Table 2. Dielectric properties of healthy [Citation28] and tumor [Citation50] tissues at 120 and 434 MHz.
2.4. Thermal modeling benchmark
The most commonly used thermal modeling for hyperthermia treatment planning is based on Pennes’ bioheat equation (PBHE) [Citation51,Citation52]:
with Cp (J/kg/K) the specific heat capacity. The term
represents the heat conduction in tissue, with k (W/m/K) the thermal conductivity. The second term on the right-hand side models the blood perfusion, with Cb the specific heat capacity of blood, Wb (kg/s/m3) the volumetric blood perfusion rate and Ta the local arterial temperature, which is usually assumed to be the body core temperature (37 °C). The heat source term
(W/m3) corresponds to the power absorbed in tissue from the external heating device. Note that the original bioheat equation includes a metabolic heat generation source term that is omitted in the proposed benchmark studies since its effect is small relative to the temperature increase, the dominant external heat source and the blood perfusion heat sink terms. Furthermore, for practical reasons and since the therapeutic window coincides with periods of relative temperature stability, we recommend using a steady-state formulation for the bioheat equation, where the time derivative on the left-hand side becomes zero. Unless the treatment parameters are frequently adapted (e.g., in a closed-loop control scenario), the transient term can be neglected since the characteristic time of temperature adaptation is short when compared to the treatment duration. Optimization is also strongly facilitated by using a steady-state formulation, and steady-state distributions can numerically be obtained more efficiently.
The largest sources of uncertainty in thermal simulations are the blood perfusion values. When tissue temperature increases, the local perfusion values are significantly enhanced [Citation53]. This enhancement depends on various factors, such as the local temperature elevation, the heating duration, the tissue type, as well as other factors such as the patient’s age and physical condition [Citation54]. There are basically two different options to model this enhanced perfusion during hyperthermia: using a static thermal stress model [Citation55] or a temperature-dependent perfusion model [Citation56]. All current, clinically applied HTP software that relies on temperature optimization use the static thermal stress model. Therefore, to establish a clinical benchmark, we ignored the transient variations of blood perfusion in our computations, and propose that all the computations be performed using static blood perfusion under heat stress () as reported in [Citation55]. Nevertheless, we do acknowledge that it can have a significant impact on temperature predictions. The tumor thermal properties were assumed to be the same as muscle, except for perfusion. See references [Citation7,Citation9,Citation52,Citation57] for more detail on thermal modeling.
Table 3. Thermal properties of healthy and tumor tissues at baseline [Citation28] and under thermal stress [Citation56]. Blood perfusion rates are presented in SI units and in ml/min/kg for convenience.
The patient’s initial temperature was set to 37 °C and boundary conditions for the water bolus surface and external air temperatures were fixed at 20 °C for the pelvic (Clarice and Will) and H&N (Alex and Murphy) models. For breast models, a water bolus temperature of 40 °C (Venus) and 30 °C (Luna) was assumed. The clinically employed water temperatures are in the range of 10–40 °C, with low bolus temperatures typically being used for deeper tumors [Citation58]. A convective boundary condition is more realistic than a fixed temperature boundary condition, and should preferably be used. Differences in boundary conditions primarily impact 1–2 cm of the adjacent tissue. Heat transfer coefficients in the order of 6 and 40 W/(m2 K) at the interface to the external air and water bolus, respectively, are typically recommended. However, the heat transfer coefficients are setup-dependent (typically in the range of 2–40 W/(m2 K); depending on forced vs. natural convection, velocity, and thermal properties) and must be reported and justified. The heat source terms calculated from EM simulations were interpolated to a homogeneous grid and thereafter used for the thermal simulations. For a mesh-independent solution, we used and recommend analyzing the maximum temperature (Tmax) and T50, so that they do not vary more than 0.05 °C after each consecutive mesh refinement iteration (assuming a refinement factor 1.3 per refinement iteration). As pointed out in Section 2.3, mesh convergence is a not a sufficient condition for solution correctness regarding staircasing-related thermal boundary effects.
2.5. Optimization benchmark
With HTP, phase and amplitude settings are optimized to realize tumor heating above or close to a specified therapeutic level [Citation59–67]. The debate on whether SAR or temperature optimization is the optimal choice in HTP is still open. Contrasting arguments were proposed in literature [Citation36,Citation68,Citation69] and our goal is not to propose the optimal HTP approach but rather guidelines in how to implement and evaluate HTP platforms regardless of their basis. We encourage the community to compare their novel HTP approaches with the most advanced approaches in clinical use: the SAR-based optimization implemented in VEDO [Citation19] and the temperature-based optimization implemented in Plan2Heat [Citation8]. In this paper, we applied a SAR optimization example for H&N, pelvic and breast benchmark applicators using the patient models Murphy, Clarice and Venus, respectively. The temperature optimization was applied for the patient models Alex,Will and Luna.
2.5.1. SAR optimization
The proposed optimization strategy in this paper represents the only example of SAR-based optimization routinely used in the clinical practice. It is used for patients with both deep-seated tumors in the pelvis and H&N, and is also proposed here for patients with breast tumors. This approach aims at maximizing the Target-Hotspot-Quotient (THQ), which is defined as the ratio between the mean SAR in the HTV and the average SAR in hot spots (HS), i.e., the 50 ml of healthy tissue that is exposed to the highest SAR [Citation70]. The objective function is then given by:
where the bar above SAR represents its average. The THQ has been shown to correlate with simulated and later measured T50, an hence associates with HT outcome [Citation71,Citation72]. Note that, in contrast to the relative definitions in literature, we chose the absolute hotspot volume (50 ml) as this enables comparisons of the THQ’s values between different applications. Due to a non-convex nature of the optimization landscape, a global (Particle Swarm) optimizer is used to optimize THQ [Citation19]. Despite the non-null likelihood of selecting a suboptimal local optimum associated with non-convex optimization approaches, stability can be maximized by tumor-site/type-specific fine tuning of the search algorithm. Further details on the THQ PSO are presented in [Citation73].
2.5.2. Temperature optimization
The proposed approach for temperature optimization has been introduced clinically about 15 years ago [Citation74] and optimizes an objective function θ to aim for a specific goal temperature range in the HTV. Several goal functions are possible, but here we aim at a homogeneous temperature (Tgoal) in the HTV, by minimizing:
where Tgoal was set to 43 °C. Hard constraints of 44 °C to both tumor and normal tissue were applied to avoid thermal injuries and a sequential quadratic programming (SQP) method was used. In order to avoid a local optimum as a final result, several optimizations with random initial phase-amplitude settings should be performed. In our work, we selected the best of 10 optimizations.
2.6. Evaluation benchmarks
For SAR-based quality indicators, we used THQ and target coverage (TC) on SAR field smoothed over 1 cm3 voxels (cfSAR) by applying a 3 D moving-average filter. TC parameters are defined as the volume percentage of the HTV covered by the 25% (TC25), 50% (TC50), and 75% (TC75) iso-cfSAR contour, with cfSAR being normalized to the maximum cfSAR in the patient. According to clinical practice, tumor coverage should be evaluated by the indexed temperatures T10, T50 and T90, which represent the temperatures achieved in at least 10, 50 and 90% of the target volume, respectively. Both TCxx and Txx parameters are used to quantify treatment quality based on measurements and were shown to correlate with treatment outcome [Citation75]. To obtain relevant values quantifying simulation results, scaling of the input power with strictly defined bounds is required. Hereto, we propose to increase input power to achieve a maximum temperature of 44 °C, for both tumor and normal tissues.
2.7. HTP benchmark for focused ultrasound
Focused ultrasound (FUS) is used for thermal therapies in the ablative and hyperthermic regimes as well as for reversible blood-brain-barrier opening, noninvasive neurostimulation, and targeted drug delivery. FUS generates deeply localized, sharp, and potentially steerable foci at which energy is deposited noninvasively. Heating frequently occurs in combination with other physical effects, such as stable and inertial cavitation, which can be desirable or not. While targeting can be superior to that achieved using electromagnetic applicators, it usually involves more complexities, e.g., due to the frequently larger number of treatment parameters (e.g., amplitude and phase settings for hundreds of source elements). The strengths and challenges are often related to the fact that the waves attenuate little in tissue, and acoustic wavelengths are short and of comparable magnitude to small anatomical features and tissue heterogeneities. Also, strong, and sometimes, complex reflections at bone interfaces or air often create insurmountable hurdles.
This paper is primarily focused on electromagnetic heating, but since FUS is becoming increasingly popular in hyperthermic oncology, this section will provide guidance, as well as a benchmark, for FUS-based hyperthermia. As the clinical reality demands treatment of large tumors, while a key strength of FUS is its focality, a physical or electronic focus scanning approach (or some novel alternative) is required. Suitable solutions that do not result in surface overheating are not yet generally available, and establishing a well-defined benchmark that permits comparison of proposed approaches is thus desirable. Such suitable applicators capable of electronic steering are typically complex and can feature several hundreds of transducer elements [Citation76]. Instead, our proposed benchmark uses a simple spherical transducer element without scanning for simplicity reasons, and focuses on the patient model, acoustic and thermal properties. For participants of the Grand Challenge, an objective could be to devise a scanning strategy and/or corresponding phased-array applicator that maximizes the thermal optimization metric from Section 2.5.
2.7.1. Physical model and numerical solvers
A wide range of physical propagation models and numerical solvers are being applied to the simulation of FUS. The most complete description is based on stress-strain relationships and involve deformation vectors, tensors, and complex material models (e.g., fiber-enforced, non-linear materials). However, such simulations quickly become too resource-intensive, leading to necessary simplifications. Pressure waves are frequently simulated, rather than displacement waves, at the cost of not capturing shear-wave effects. The most common formulations are the linear acoustic pressure wave equation (LAPWE):
where p is the pressure, c is the speed of sound and ã is related (and sometimes equated) to attenuation. The non-linear extension of LAPWE, the Westervelt-Lighthill equation (WLE, [Citation77]), accounts for dispersive properties and frequency mixing (but is typically not appropriate for the large non-linearities required to simulate shock-waves):
where c0 is the equilibrium speed of sound, δ is the diffusivity, β is the non-linearity coefficient, and ρ0 is the equilibrium density of the fluid.
For setups in which one propagation direction dominates, paraxial approximations are commonly employed. In hyperthermic FUS applications, the linear acoustic pressure wave solver (LAPWE) is recommended and full-wave 3 D solvers should be used. The most frequent numerical solvers use (hybrid) angular spectrum approaches [Citation78], finite element and finite differences time-domain methods [Citation79,Citation80], and pseudospectral methods [Citation81]. These methods come with their own numerical error sources related to spatial and temporal discretization, time-integration schemes, and convergence. Performing refinement and convergence analyses when applying a method to a new context-of-use is therefore strongly recommended. For a detailed discussion of acoustic solver verification and validation, see reference [Citation82].
2.7.2. Material properties and heterogeneity
Reported values for acoustic tissue properties vary strongly. It is recommended to use reference [Citation28] for a curated, literature-based, versioned (for reproducibility) and regularly updated collection, which also reports recommended values and information about associated uncertainty. Particularly for transcranial focused ultrasound (tcFUS) the highly heterogeneous structure of skull and bone cannot be neglected as it leads to scattering, beam and focus distortion and aberration, absorption and heating, shear waves, and standing waves. It can be necessary to use personalized information, e.g., from CT scans, to produce patient-specific property maps for the simulations [Citation83]. For tcFUS, heterogeneity in tissues must be considered.
2.7.3. Energy deposition, induced heating, tissue damage
Acoustic absorption leads to induced tissue heating. The power deposition can be computed through the formula αp2/ρc, with α being the absorption coefficient. While not commonly considered, it can be important to distinguish between attenuation and absorption, as effective attenuation encompasses both absorption and scattering, but is commonly referred to as absorption. For transient (e.g., pulsed) exposures, whether transient simulation of the exposure is required or temporal averaging is acceptable depends on the relative magnitudes of the characteristic pulsation/modulation and the characteristic heating time scales. Modeling of acoustic and electromagnetic heating is typically performed in a similar manner (i.e., using the Pennes bioheat Equation [Citation51]), unless the acoustic heating involves temperatures at which vascular shutdown and coagulation becomes important, where similar methods are applied as for RF ablation modeling [Citation84]. Again, it can be important to specifically account for large vasculature in the vicinity of the heated domain. Common tissue damage metrics include the Arrhenius tissue damage model, thermal dose models (such as CEM43, [Citation85]), and thermal iso-levels (typically chosen at 50–55 °C). In what concerns the water bolus, frequently used for impedance matching and surface cooling, similar considerations as for electromagnetic hyperthermia applicators apply.
2.7.4. Source modeling
There is no generally accepted way in how acoustic transducers are modeled. Depending on the employed physical model, either given pressures or displacements or velocities are applied, which are not equivalent and complicate comparison. Furthermore, it can be important to model the internal structure of transducers [Citation86], which often contain impedance matching and lens elements and can be affected by mechanical factors, such as fixation and friction.
2.7.5. Targeting
Many approaches for acoustic targeting, steering, and aberration compensation have been proposed [Citation87]. When larger regions are to be heated, e.g., in the context of hyperthermic oncology, spatial scanning is typically required, and the heating performance (efficiency, localization, homogeneity) strongly depends on the scanning strategy.
2.7.6. Benchmark
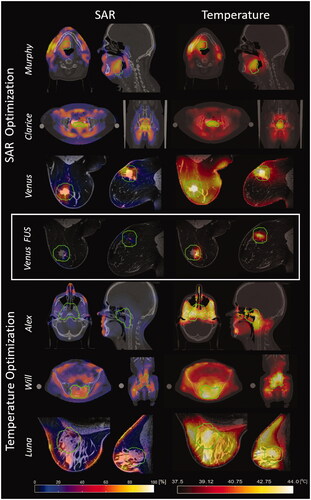
The benchmark for the ESHO Grand Challenge shall consist of the patient model Venus. The provided benchmark makes no use of physical or electronic focus scanning and instead predicts the acoustic exposure and induced heating from a spherical transducer (geometric radius: 10 cm, aperture angle: 73.7 deg (10 cm), frequency: 1.6 MHz, pressure at the source: 16 kPa) placed vertically below the tumor center (assuming lying position), at a distance equal to the transducer curvature radius. Thermal simulations are performed according to Section 2.4 and the acoustic properties from [Citation28] are used (tumor is treated as glandular breast tissue [Citation88]). The shared reference solution has been generated using an FDTD acoustic solver (Sim4Life v5.2.2), a grid resolution of at least a tenth of a wavelength throughout (the provided reference solution used a grid resolution around 0.09 mm and 2.6 Billion voxels), perfectly matched layer boundary conditions, Dirichlet pressure sources, and a run-time of 200 periods. Heating for a duration of 2700s was simulated using an FDTD thermal solver (Sim4Life v5.2.2) and a grid with 30.6 Million voxels was used with a maximum grid-step of 1.9 mm. The acoustic and thermal results can be seen in , which illustrate how the actual focus location deviates from the geometric focus and how its shape is distorted, which also affects the induced heating.
Figure 4. THQ (Murphy, Clarice, Venus) or T50 (Alex, Will, Luna) optimized SAR and temperature distributions for the benchmark applicators displayed on top of the CT images with the target region indicated by the green contour. Axial and sagittal cross-sections are given for Murphy and Alex and axial and coronal cross-sections for Clarice, Venus, Will and Luna. Note that the CT slice of Claris and Will also includes the slings (lines, dots) on which patients are scanned and treated. The FUS results for Venus show the SAR and temperature distributions for a single pressure focus, i.e., without focus scanning.
3. Results
(top row) shows the optimized SAR and corresponding temperature distributions for the Murphy, Clarice and Venus patient models chosen for the SAR optimization benchmark. Similarly, (bottom row) shows the optimized temperature and corresponding SAR distributions for the Alex, Will and Luna patient models, chosen for the temperature optimization benchmark. The quality indicators for SAR (THQ, TCxx) and temperature (Txx) are reported for all cases in , irrespective of the optimization method used. Note that direct comparison of temperature and SAR optimization were not performed since literature shows that this comparison is strongly affected by dielectric and thermal tissue properties as well as their uncertainties [Citation36]. By providing both options, we aim to accommodate benchmarking options for those working on SAR optimization and those working on temperature optimization.
Table 4. Treatment planning results achieved using the benchmark applicators and optimized based on SAR (THQ) with VEDO software or based on temperature (tumor goal of 43 °C, with normal tissue constraints of 44 °C) with Plan2Heat software.
SAR optimization with benchmark applicators was able to pass the inclusion criteria (TC25 > 75%) set in VEDO [Citation19] for H&N, pelvic and breast cancer patient models and all models also had a satisfactory T50 (above 40 °C) as indicated in . Note that the Murphy model incorporates an easier to heat target location, however the lack of a highly absorbing solid tumor mass (high electrical conductivity) resulted in low TC50 values. A high THQ and target coverage was found for Clarice, representing an average hyperthermia treatment scenario. As expected, temperature optimization resulted in higher T50, even though both cases had unconventional tumor shapes.
and also illustrates the results of the acoustic exposure benchmark, in terms of pressure and induced heating. It is apparent that - despite aligning the geometric focus of the applicator with the center of the tumor - the heterogeneity of the acoustic properties results in a shifted and distorted focus. It is also evident that physical or electronic scanning of the focus is required to properly ensure tumor coverage.
4. Discussion
4.1. Clinical model selection
Patients models from the EVPR database and two new breast models were chosen to represent difficult to heat scenarios within their respective clinically treated patient populations. Note that the current clinical practice in hyperthermia breast cancer focuses on recurrent disease, requiring the use of superficial applicators instead of the phased array devices as analyzed in this paper. The inclusion of models with tumors in the intact breast should be considered as a first step toward clinical phased-array device development, rather than building on an ongoing routine clinical application like in H&N and pelvic hyperthermia.
SAR and temperature optimization led to distinct results in terms of temperature quality indicators in the models, which can be explained by the fact that, during SAR optimization, the THQ is the objective function to maximize and not the temperature (see also section 4.4). Note that we did not investigate the dependence on tissue properties uncertainties, which has been reported to strongly affect differences between quality metrics for SAR and temperature optimization [Citation36]. Our results also show that the proposed benchmark applicators provide sufficient heating and degrees of freedom for field shaping and, hence, a solid ground to compare novel optimizers and hyperthermia devices.
4.2. Tumor properties
Tumors show an even more considerable inter-subject variability than normal tissues, such that any patient-specific information about tumor properties is valuable. It should also be noted that tumors are frequently highly heterogeneous (e.g., well-perfused rim, but necrotic core) and may not be represented sufficiently by assigning homogeneous tissue properties to segmented regions. The impact of this approximation, however, is to date unknown. The IT’IS tissue properties database only lists healthy tissue properties. For tumor dielectric properties, we propose using the average of bladder, colon, kidney, liver, lung, lymph nodes, mammary, spleen, and testes tumors measured within 50–900 MHz [Citation50]. The dielectric properties variability between these tissues was ±25%, except for relative permittivity at 50 MHz that varied within −24% to +39% from the average. As many other tissue properties retrieved from literature, these properties were measured at room temperature (23–25 °C) 1–2 h after being excised from the human body. The water content is very likely decreased for ex vivo samples, which decreases the measured values. On the other hand, the samples were measured at a significantly lower temperature than normothermia which also tends to lower dielectric properties. We accept these limitations since, when performing simulations with lower dielectric properties, the hyperthermia temperature increase is also expected to be lower, meaning that we are analyzing dielectric tissue properties for a likely worst-case scenario. Note that healthy tissue properties also present significant variability. The IT’IS tissue properties database lists the measured ranges, standard devitation and number of samples, facilitating tissue-specific sensitivity analyses.
4.3. Optimization goals
In this work, the goal temperature in the target was set to 43 °C, since the widely accepted optimal treatment is when tumor temperatures are maintained as close as possible to 43 °C for 60 min [Citation89]. However, in the clinical setting, the goal temperature of 43 °C is often challenging to achieve with locoregional hyperthermia equipment. For all thermal simulations, hard constraints of 44 °C to both tumor and normal tissue were applied to avoid thermal toxicity. We used homogeneous tumor properties, but tumors can be very heterogeneous with poorly perfused or even necrotic regions. Nevertheless, thermal toxicity at the tumor location and its surroundings should be avoided since ill-defined thermal ablation could reduce the radiosensitization effect of hyperthermia [Citation90]. In clinical practice, treatment guidance is usually performed using temperature probes inserted at or near the tumor location, as well as patient feedback from heating discomfort or pain from hot spots. To aim for sufficiently high tumor temperatures, the applicator power is usually increased until treatment-limiting hot spots (or excessive measured tumor temperatures) occur. The threshold temperature for hot spot-related pain complaints has been reported to be near 45 °C [Citation91], but clinical experience shows that pain is sometimes reported by the patient at lower temperatures. Hence, the maximum normal tissue temperature was set to 44 °C in the proposed HTP guidelines. The slightly lower constraint was mainly chosen because of the uncertainties in (thermal) modeling caused by uncertainties in tissue properties and perfusion, as well as impaired perfusion at locations where surgery was applied.
4.4. Clinical relevance of SAR/T optimization factors
Clinically relevant SAR indicators for evaluation and optimization of treatment plans should be predictive for temperature and thus show a good correlation with temperature. Both THQ and TC (TC50 and TC25) are predictive SAR indicators, as demonstrated in planning studies for locoregional and H&N hyperthermia [Citation70,Citation71]. In clinical superficial hyperthermia, TC25 was also shown a prognostic factor for local control [Citation92,Citation93].
For thermal modeling, plan evaluation is usually performed based on the indexed temperatures T10, T50, and T90, which are commonly used clinical indicators to evaluate treatment quality. Especially T90 is correlated with clinical outcome [Citation94,Citation95], and is therefore also often used as the objective function to maximize during temperature-based optimization, as an alternative for the goal temperature of 43 °C [Citation13,Citation36].
4.5. Sar vs T optimization
Both the SAR-based and temperature-based optimization approaches used in this study aim to maximize tumor heating, albeit using a different approach. The SAR-based optimization optimizes the THQ, i.e., the energy deposition in the tumor vs. local exposure peaks, but does not take into account significant thermal effects such as bolus cooling, thermal diffusion (mimicked by SAR smoothing), and blood perfusion, while the temperature-based optimization directly optimizes the target temperature distribution with constraints to normal tissue temperatures. Thus, the employed temperature optimization metric puts a higher weight on average behavior, only giving a small weight to volumetrically small hot spots, as long as they remain below the threshold. The considered SAR optimization metric focuses on hot spot suppression, compromising on achievable tumor heating. This difference explains why temperature-based optimization typically yields a lower THQ than SAR-based optimization, while SAR-based optimization frequently results in lower tumor temperatures compared to direct temperature-based optimization (). This difference in approach makes a direct comparison of optimization results difficult. Thus, this paper does not intend to advise a specific optimization approach. However, one should be aware that these differences can substantially affect optimization results in system design studies [Citation96]. For example, a study by Seebass et al. showed that using SAR-based optimization of a single-ring antenna array set up with 12 independent dipoles was optimal for locoregional heating, while using temperature-based optimization, a three-ring system with four dipole pairs showed the best performance [Citation96].
Despite the differences in the optimization approach, as described above, both SAR- and temperature-based optimizations have been successfully applied in clinical hyperthermia for many years [Citation19,Citation74]. A SAR-based optimization used clinically and suggested in this paper is a particle swarm optimization (PSO): a metaheuristic method that can effectively search very large spaces of candidate solutions. The clinical temperature-based optimization, as suggested in this paper, uses a sequential quadratic programming (SQP) method and selects the best result out of several optimizations started with random initial amplitude-phase settings. Although both PSO and SQP cannot guarantee that a mathematically optimal solution is obtained, results are generally suitable for clinical use.
Initially, SAR-based methods were more popular because they are computationally much cheaper. Temperature-based methods are more time-consuming because of the explicit constraints to normal tissue temperatures to be accounted for. However, since computational power has increased significantly in recent years, and efficient superposition methods are available for temperature calculations [Citation60,Citation97,Citation98], thermal optimization has become increasingly popular and can even be performed online during treatment. Uncertainties in dielectric and thermal tissue properties still limit the quantitative accuracy of both SAR and temperature-based pretreatment planning optimization [Citation36,Citation99–102]. Therefore, adjustments during treatment in response to hot spots remain necessary, and both predicted changes in SAR and temperature correlate with measured temperature changes after phase-amplitude steering [Citation100,Citation103].
4.6. Bioheat and blood perfusion modeling
The bioheat equation has become the de facto standard in hyperthermia thermal simulations [Citation9,Citation21,Citation51]. In this mathematical model of heat transfer in living tissues, blood perfusion is assumed to be non-directional and heat disappears from the tissue via a heat-sink term. The validity of this equation was demonstrated for heating a large region in tissue with healthy microvasculature and blood flowing through vessels with isotropically distributed orientations. However, this assumption can result in inaccurate temperature predictions in highly vascularized body parts such as neck or prostate [Citation104,Citation105]. To take into account of the non-continuum nature of perfusion and non-equilibrium effects, several different thermal models were proposed [Citation106–111]. However, these models require integrating discrete vasculature into the modeling, which is a time-consuming process for both patient and pretreatment planning [Citation104,Citation112]. Approaches, such as the one from [Citation99], which considers the spatial variability of the arterial blood temperature and its convection field, depend on a large number of additional properties and even property fields. For this approach, little information from HT is available and personalization to a specific patient is currently unfeasible. Despite the limitations of the PBHE, we still recommend it for clinical applications because it leads to reasonable estimates in a timely manner within the known uncertainty of tissue properties [Citation9].
To make the bioheat model more relevant for hyperthermia therapy, we also recommend the use of blood perfusion properties under stress. The bioheat formulation proposed is static and does not account for the transient effects of perfusion as a function of temperature. Several groups have demonstrated changes in tissue blood perfusion of over ten times during heating in the 40–44 °C range [Citation53,Citation113,Citation114]. Blood perfusion transiently increases during mild heating, but with higher temperatures (43–45 °C depending on tissue), vascular damage will occur, leading to a rapid decrease in blood perfusion [Citation53]. Accounting for this non-linear time- and temperature-dependent effect on blood perfusion would be computationally challenging and the available (human) experimental data basis is weak, leading to significant uncertainties.
The proposed static thermal stress model assumes an enhancement factor per tissue type, for average hyperthermic temperatures. This assumption still yields a constant perfusion thus facilitating fast simulations. There are no widely accepted standard models for transient thermoregulation in humans, at least not on the tissue level – see [Citation115] for whole-body thermoregulation standardization. Therefore, in this guidance document, we omit temperature dependence in view of simplicity. As physiological understanding, imaging technologies for personalization, and computational modeling technologies progress, it would be desirable to improve the modeling of perfusion/vasculature, thermoregulation, and transient effects, and to further adapt simulations to individual patients. Note that all remaining tissue properties (e.g., electrical conductivity, density, and heat capacity) do not vary significantly within the hyperthermia range (40–44 °C), but the temperature effects should be taken into account in all tissue properties for ablation procedures [Citation7].
4.7. Model verification and validation
Proper model verification (ensuring correct model implementation) and validation (ensuring that the model captures the relevant features of reality) are crucial for establishing confidence in the reliability of treatment modeling in terms of treatment risk and effectivity prediction. Both verification and validation are critical for any regulatory submission supported by evidence from computational modeling or involving computational modeling in the treatment planning, optimization, or application. Regulatory acceptance is a requirement for HTP to be widely applied outside of research conditions and for modeling-supported applicator development. The corresponding Food and Drug Administration (FDA) guidance document [Citation116] and the ASME V&V 40 standard [Citation117] provide valuable guidance on establishing, demonstrating and reporting the level of rigor needed for computational modeling used in support of a regulatory submission of any medical device or software intended to treat patients, such as HTP platforms.
The benchmarks presented in this paper can be valuable for the purpose of hyperthermia treatment modeling verification (i.e., ascertaining that the model implementation is as intended). However, validation (i.e., ensuring that the intended model reproduces the real-world behavior of the relevant quantities-of-interest with sufficient accuracy) will typically require experimental data to ensure agreement with reality, which is usually obtained in the thermal medicine field through phantom testing (see [Citation118] for EM and [Citation82] for acoustic modeling) or in vivo test data. The latter is strongly preferable for thermal validation, in view of the critical impact of perfusion [Citation10,Citation39]. Providing guidelines to experimental validation of the computational models is outside the scope of this guideline paper, but we encourage the reader to read references [Citation26,Citation27,Citation119–121]. The key aspect to keep in mind is that the computational methods used in hyperthermia applications will support decisions that will influence the safety and health of patients. Both standards and guideline documents, such as this paper, are key elements for the development of safe and effective hyperthermia technology. For a detailed discussion on verification, validation, uncertainty quantification and quality assurance for computational anatomical models and related applications, see reference [Citation122]. Thus, the here elaborated benchmarks, are intended for implementation verification of different numerical approaches used for HTP and performance comparison of different hyperthermia applicators benchmarks; which is in line with the according to Merriam-Webster’s definition “benchmark: a standardized problem or test that serves as a basis for evaluation or comparison (as of computer system performance)”. To be clear, – these benchmarks have not been experimentally validated to ascertain that they faithfully reproduce the biophysical reality.
5. Conclusions and outlook
In this paper, we present new hyperthermia applicator benchmarks, anatomical models and simulation parameters to stimulate standardization in simulation studies of hyperthermia technology. The focus was on current clinical hyperthermia applications in the pelvic region, H&N, and breast. In summary, the presented benchmarks and guidance in this paper aimed at:
Standardization: We foresee that advancing standardization will improve treatment quality and facilitate the comparison of different hyperthermia approaches.
Benchmarks: Providing benchmarks not only serves to facilitate such comparison, but will also drive technological advances as well as being crucial for code-verification and quality assurance.
ESHO Grand Challenge 2021: The benchmarks are of direct relevance to the forthcoming ESHO Grand Challenge 2021, as they can serve as objective metrics and permit to objectively quantify claims across different submissions.
Guidance: The methods and parameters used in hyperthermia treatment modeling vary greatly across literature and practice, and the rationale for choices is not always apparent. This paper also aims to provide guidance and justification in that respect. It also aims to clarify the additional research required to further progress in HTP technology.
It is our hope that this publication is valuable to practitioners and researchers in the field of hyperthermic oncology, while providing input for more comprehensive future standardization of computational-based platforms for use in hyperthermia cancer therapy.
Emerging tumor sites, where HT application has the potential to significantly improve the current care, such as pancreas or brain tumors, were left for future challenges. In addition, FUS-based hyperthermia is only briefly discussed, and other heating technologies, such as nanoparticles or magnetic seeds are not considered in this paper.
| Abbreviations | ||
| CTV | = | Clinical target volume |
| ESHO | = | European Society for Hyperthermic Oncology |
| GTV | = | Gross tumor volume |
| HTV | = | Hyperthermia target volume |
| H&N | = | Head and neck |
| HT | = | Hyperthermia |
| HTP | = | Hyperthermia treatment planning |
| SAR | = | Specific absorption rate |
| T | = | Temperature |
| THQ | = | Target hot spot quotient |
| TC | = | Target coverage |
| TC25 | = | volume percentage of the HTV covered by the 25% iso-SAR contour |
| TC50 | = | volume percentage of the HTV covered by the 50% iso-SAR contour |
| TC75 | = | volume percentage of the HTV covered by the 75% iso-SAR contour |
| T10 | = | temperatures achieved in at least 10% of the HTV |
| T50 | = | temperatures achieved in at least 50% of the HTV |
| T90 | = | temperatures achieved in at least 90% of the HTV |
| QA | = | Quality assurance. |
Disclosure statement
No potential conflict of interest was reported by the author(s).
Additional information
Funding
Notes
1 Details on the ESHO grand challenge on HTP will be provided at https://www.esho.info/
References
- Elming PB, et al. Hyperthermia: the optimal treatment to overcome radiation resistant hypoxia. Cancers. 2019;11(1):60.
- Peeken JC, Vaupel P, Combs SE. Integrating hyperthermia into modern radiation oncology: What evidence is necessary? Front Oncol. 2017;7:132.
- Paulides MM, Dobsicek Trefna H, Curto S, et al. Recent technological advancements in radiofrequency- andmicrowave-mediated hyperthermia for enhancing drug delivery. Adv Drug Deliv Rev. 2020;163–164:3–18.
- Kok HP, Cressman ENK, Ceelen W, et al. Heating technology for malignant tumors: a review. Int J Hyperthermia. 2020;37(1):711–741.
- Oei AL, Vriend LEM, Crezee J, et al. Effects of hyperthermia on DNA repair pathways: one treatment to inhibit them all. Radiat Oncol. 2015;10(1):165.,
- van Rhoon GC. Is CEM43 still a relevant thermal dose parameter for hyperthermia treatment monitoring? Int J Hyperthermia. 2016;32(1):50–62.
- Rossmann C, Haemmerich D. Review of temperature dependence of thermal properties, dielectric properties, and perfusion of biological tissues at hyperthermic and ablation temperatures. Crit Rev Biomed Eng. 2014;42(6):467–492.
- Kok HP, Kotte A, Crezee J. Planning, optimisation and evaluation of hyperthermia treatments. Int J Hyperthermia. 2017;33(6):593–607.
- Paulides MM, Stauffer PR, Neufeld E, et al. Simulation techniques in hyperthermia treatment planning. Int J Hyperthermia. 2013;29(4):346–357.
- Verhaart RF, Verduijn GM, Fortunati V, et al. Accurate 3D temperature dosimetry during hyperthermia therapy by combining invasive measurements and patient-specific simulations. Int J Hyperthermia. 2015;31(6):686–692.
- Drizdal T, Paulides MM, van Holthe N, et al. Hyperthermia treatment planning guided applicator selection for Sub-superficial head and neck tumors heating. Int J Hyperthermia. 2018;34(6):704–713.
- de Bruijne M, Wielheesen DHM, van der Zee J, et al. Benefits of superficial hyperthermia treatment planning: five case studies. Int J Hyperthermia. 2007;23(5):417–429.
- Kok HP, Navarro F, Strigari L, et al. Locoregional hyperthermia of deep-seated tumours applied with capacitive and radiative systems: a simulation study. International Journal of Hyperthermia. 2018;34(6):714–730.
- Kok HP, Crezee J. A comparison of the heating characteristics of capacitive and radiative superficial hyperthermia. Int J Hyperthermia. 2017;33(4):378–386.
- Kok HP, de Greef M, van Wieringen N, et al. Comparison of two different 70 MHz applicators for large extremity lesions: simulation and application. Int J Hyperthermia. 2010;26(4):376–388.
- Kok HP, Beck M, Löke DR, et al. Locoregional peritoneal hyperthermia to enhance the effectiveness of chemotherapy in patients with peritoneal carcinomatosis: a simulation study comparing different locoregional heating systems. Int J Hyperthermia. 2020;37(1):76–88.
- Trujillo-Romero CJ, Paulides MM, Drizdal T, et al. Impact of silicone and metal port-a-cath implants on superficial hyperthermia treatment quality. Int J Hyperthermia. 2015;31(1):15–22.
- Sreenivasa G, Gellermann J, Rau B, et al. Clinical use of the hyperthermia treatment planning system HyperPlan to predict effectiveness and toxicity. Int J Radiat Oncol Biol Phys. 2003;55(2):407–419.
- Rijnen Z, Bakker JF, Canters RAM, et al. Clinical integration of software tool VEDO for adaptive and quantitative application of phased array hyperthermia in the head and neck. Int J Hyperthermia. 2013;29(3):181–193.
- Kok HP, Korshuize-van Straten L, Bakker A, et al. Online adaptive hyperthermia treatment planning during locoregional heating to suppress treatment-limiting hot spots. Int J Radiat Oncol Biol Phys. 2017;99(4):1039–1047.
- Kok HP, Korshuize-van Straten L, Bakker A, et al. Feasibility of on-line temperature-based hyperthermia treatment planning to improve tumour temperatures during locoregional hyperthermia. Int J Hyperthermia. 2018;34(7):1082–1091.
- Kok HP, Wust P, Stauffer PR, et al. Current state of the art of regional hyperthermia treatment planning: a review. Radiat Oncol. 2015;10:196–114.
- Lagendijk JJ. Hyperthermia treatment planning. Phys Med Biol. 2000;45(5):R61–76.
- Bruggmoser G, Bauchowitz S, Canters R, et al.; European Society for Hyperthermic Oncology. Guideline for the clinical application, documentation and analysis of clinical studies for regional deep hyperthermia: quality management in regional deep hyperthermia. Strahlenther Onkol. 2012;188(Suppl 2):198–211.,
- Franckena M, Canters R, Termorshuizen F, et al. Clinical implementation of hyperthermia treatment planning guided steering: a cross over trial to assess its current contribution to treatment quality. Int J Hyperthermia. 2010;26(2):145–157.
- Dobšíček Trefná H, Schmidt M, van Rhoon GC, et al. Quality assurance guidelines for interstitial hyperthermia. Int J Hyperthermia. 2019;36(1):277–294.
- Dobšíček Trefná H, Crezee J, Schmidt M, et al. Quality assurance guidelines for superficial hyperthermia clinical trials: II. Technical requirements for heating devices. Strahlenther Onkol. 2017;193(5):351–366.
- Hasgall PA, Di Gennaro F, Baumgartner C, et al. IT’IS database for thermal and electromagnetic parameters of biological tissues (version 4.0). 2018. DOI:https://doi.org/10.13099/VIP21000-04-0. itis.swiss/database.
- Bellizzi GG, Sumser K, VilasBoas-Ribeiro I, et al. Standardization of patient modeling in hyperthermia simulation studies: introducing the erasmus virtual patient repository. Int J Hyperthermia. 2020;37(1):608–616.
- Paulides MM, Wielheesen DHM, Van Der Zee J, et al. Assessment of the local SAR distortion by major anatomical structures in a cylindrical neck phantom. Int J Hyperthermia. 2005;21(2):125–140.
- Rodrigues DB, Ellsworth J, Turner P. Feasibility of heating brain tumors using a 915 MHz annular phased-array. Antennas Wirel Propag Lett. 2021;20(4):423–427.
- Oberacker E, Kuehne A, Oezerdem C, et al. Radiofrequency applicator concepts for thermal magnetic resonance of brain tumors at 297 MHz (7.0 Tesla).Int J Hyperthermia. 2020;37(1):549–563.
- Takook P, Persson M, Trefná HD. Performance evaluation of hyperthermia applicators to heat Deep-Seated brain tumors. IEEE J Electromagn RF Microw Med Biol. 2018;2(1):18–24.
- Bellizzi GG, Crocco L, Battaglia GM, et al. Multi-Frequency constrained SAR focusing for patient specific hyperthermia treatment. IEEE J Electromagn RF Microw Med Biol. 2017;1(2):74–80.
- De Greef M, Kok HP, Bel A, et al. 3D versus 2D steering in patient anatomies: a comparison using hyperthermia treatment planning. Int J Hyperthermia. 2011;27(1):74–85.
- Canters RAM, Paulides MM, Franckena M, et al. Benefit of replacing the sigma-60 by the Sigma-Eye applicator. A monte carlo-based uncertainty analysis. Strahlenther Onkol. 2013;189(1):74–80.
- Canters RAM, Paulides MM, Franckena MF, et al. Implementation of treatment planning in the routine clinical procedure of regional hyperthermia treatment of cervical cancer: an overview and the rotterdam experience. Int J Hyperthermia. 2012;28(6):570–581.
- Paulides MM, Bakker JF, Neufeld E, et al. Winner of the "New Investigator Award" at the European Society of Hyperthermia Oncology Meeting 2007. The HYPERcollar: a novel applicator for hyperthermia in the head and neck. Int J Hyperthermia. 2007;23(7):567–576.
- Paulides MM, Bakker JF, Linthorst M, et al. The clinical feasibility of deep hyperthermia treatment in the head and neck: new challenges for positioning and temperature measurement. Phys Med Biol. 2010;55(9):2465–2480.
- Verduijn GM, de Wee EM, Rijnen Z, et al. Deep hyperthermia with the HYPERcollar system combined with irradiation for advanced head and neck carcinoma – a feasibility study. Int J Hyperthermia. 2018;34(7):994–1001.
- Rijnen Z, Togni P, Roskam R, et al. Quality and comfort in head and neck hyperthermia: a redesign according to clinical experience and simulation studies. Int J Hyperthermia. 2015;31(8):823–830.
- Paulides MM, Verduijn GM, Van Holthe N. Status quo and directions in deep head and neck hyperthermia. Radiat Oncol. 2016;11(1):21.
- Bucci OM, Gennarelli C, Savarese C. Representation of electromagnetic fields over arbitrary surfaces by a finite and nonredundant number of samples. IEEE Trans Antennas Propagat. 1998;46(3):351–359.
- Stauffer PR, et al. Using a conformal water bolus to adjust heating patterns of microwave waveguide applicators. Proceedings of SPIE, 2017. 10066(0N): p. 1–15.
- Bakker J. Dosimetry of exposure to electromagnetic fields in daily life and medical applications. in Department of radiation oncology. Rotterdam: Erasmus MC Daniel den Hoed Cancer Center; 2012.
- Rylander T, Ingelström P, Bondeson A. Computational electromagnetics. In: Texts in applied mathematics. 2nd ed. Vol. 51. New York: Springer-Verlag New York; 2013.
- Berenger JP. A perfectly matched layer for the absorption of Electromagnetic-Waves. Comput Phys. 1994;114(2):185–200.
- Bérenger J-P. Perfectly matched layer (PML) for computational electromagnetics. Synthesis Lectures on Computational Electromagnetics. 2007;2(1):1–117.
- Weiland T, Timm M, Munteanu I. A practical guide to 3-D simulation. IEEE Microwave. 2008;9(6):62–75.
- Joines WT, Zhang Y, Li C, et al. The measured electrical properties of normal and malignant human tissues from 50 to 900 MHz. Med Phys. 1994;21(4):547–550.
- Pennes HH. Analysis of tissue and arterial blood temperatures in the resting human forearm. J Appl Physiol. 1948;1(2):93–122.
- Arkin H, Xu LX, Holmes KR. Recent developments in modeling heat transfer in blood perfused tissues. IEEE Trans Biomed Eng. 1994;41(2):97–107.
- Song CW. Effect of local hyperthermia on blood flow and microenvironment: a review. Cancer Res. 1984;44(10 Suppl):4721s–44730.
- Guiot C, Madon E, Allegro D, et al. Perfusion and thermal field during hyperthermia. Experimental measurements and modelling in recurrent breast cancer. Phys Med Biol. 1998;43(10):2831–2843.
- Cheng K-S, Stakhursky V, Stauffer P, et al. Online feedback focusing algorithm for hyperthermia cancer treatment. Int J Hyperthermia. 2007;23(7):539–554.
- Drizdal T, Togni P, Vrba J, et al. Comparison of constant and temperature dependent blood perfusion in temperature prediction for superficial hyperthermia. Radioengineering. 2010;19(2):281–289.
- Neufeld E, Paulides MM, van Rhoon GC, et al. Numerical modeling for simulation and treatment planning of thermal therapy. In: Moros EG, editor, Physics of thermal therapy: fundamentals and clinical applications. Boca Raton (FL): CRC Press; 2013. p. 119–138.
- Van der Gaag ML, De Bruijne M, Samaras T, et al. Development of a guideline for the water bolus temperature in superficial hyperthermia. Int J Hyperthermia. 2006;22(8):637–656.
- Nikita KS, Maratos NG, Uzunoglu NK. Optimal steady-state temperature distribution for a phased array hyperthermia system. IEEE Trans Biomed Eng. 1993;40(12):1299–1306.
- Das SK, Clegg ST, Samulski TV. Computational techniques for fast hyperthermia temperature optimization. Med Phys. 1999;26(2):319–328.
- Das SK, Clegg ST, Samulski TV. Electromagnetic thermal therapy power optimization for multiple source applicators. Int J Hyperthermia. 1999;15(4):291–308.
- Bardati F, Borrani A, Gerardino A, et al. SAR optimization in a phased array radiofrequency hyperthermia system. Specific absorption rateIEEE Trans Biomed Eng. 1995;42(12):1201–1207.
- Kok HP, Van Haaren PMA, Van de Kamer JB, et al. High-resolution temperature-based optimization for hyperthermia treatment planning. Phys Med Biol. 2005;50(13):3127–3141.
- Wiersma J, Van Maarseveen RAM, van Dijk JDP. A flexible optimization tool for hyperthermia treatments with RF phased array systems. Int J Hyperthermia. 2002;18(2):73–85.
- Wust P, Seebass M, Nadobny J, et al. Simulation studies promote technological development of radiofrequency phased array hyperthermia. Int J Hyperthermia. 1996;12(4):477–494.
- Trefna HD, Vrba J, Persson M. Time-reversal focusing in microwave hyperthermia for deep-seated tumors. Phys Med Biol. 2010;55(8):2167–2185.
- Bellizzi GG, Drizdal T, van Rhoon GC, et al. The potential of constrained SAR focusing for hyperthermia treatment planning: analysis for the head & neck region. Phys Med Biol. 2018;64(1):015013.
- Bellizzi GG, Drizdal T, van Rhoon G, et al. Do SAR quality indicators predict temperature? A verification study in head and neck hyperthermia. In: 32nd annual meeting of the European society for hyperthermic oncology. Berlin: Strahlentherapie Und Onkologie; 2018. p. 504–505.
- de Greef M, Kok HP, Correia D, et al. Optimization in hyperthermia treatment planning: the impact of tissue perfusion uncertainty. Med Phys. 2010;37(9):4540–4550.
- Bellizzi GG, Drizdal T, van Rhoon GC, et al. Predictive value of SAR based quality indicators for head and neck hyperthermia treatment quality. Int J Hyperthermia. 2019;36(1):456–465.
- Canters RAM, Wust P, Bakker JF, et al. A literature survey on indicators for characterisation and optimisation of SAR distributions in deep hyperthermia, a plea for standardisation. Int J Hyperthermia. 2009;25(7):593–608.
- Canters RAM, Franckena M, Paulides MM, et al. Patient positioning in deep hyperthermia: influences of inaccuracies, signal correction possibilities and optimization potential. Phys Med Biol. 2009;54(12):3923–3936.
- Canters RAM, Franckena M, van der Zee J, et al. Complaint-adaptive power density optimization as a tool for HTP-guided steering in deep hyperthermia treatment of pelvic tumors. Phys Med Biol. 2008;53(23):6799–6820.
- Kok HP, van Haaren PMA, van de Kamer JB, et al. Prospective treatment planning to improve locoregional hyperthermia for oesophageal cancer. Int J Hyperthermia. 2006;22(5):375–389.
- Lee HK, Antell AG, Perez CA, et al. Superficial hyperthermia and irradiation for recurrent breast carcinoma of the chest wall: prognostic factors in 196 tumors. Int J Radiat Oncol Biol Phys. 1998;40:365–375
- Ghanouni P, Pauly KB, Elias WJ, et al. Transcranial MRI-Guided focused ultrasound: a review of the technologic and neurologic applications. AJR Am J Roentgenol. 2015;205(1):150–159.
- Westervelt PJ. Parametric acoustic array. J Acoust Soc Am. 1963;35(4):535–537.
- Vyas U, Christensen D. Ultrasound beam simulations in inhomogeneous tissue geometries using the hybrid angular spectrum method. IEEE Trans Ultrason Ferroelectr Freq Control. 2012;59(6):1093–1100.
- Kane Y. Numerical solution of initial boundary value problems involving maxwell's equations in isotropic media. IEEE Trans Antennas Propag. 1966;14(3):302–307.
- Zienkiewicz OC, Taylor RL. The finite element method. London: McGraw-Hill (UK); 1977.
- Mast TD, Souriau LP, Liu D-LD, et al. A k-space method for large-scale models of wave propagation in tissue. IEEE Trans Ultrason, Ferroelect, Freq Contr. 2001;48(2):341–354.
- Neufeld E, Kyriacou A, Kainz W, et al. Approach to validate Simulation-Based distribution predictions combining the Gamma-Method and uncertainty assessment: application to focused ultrasound. J Verific Valid Uncertainty Quantific. 2016;1(3):031006.
- Montanaro H, Pasquinelli C, Lee HJ, et al. The impact of CT image parameters and skull heterogeneity modeling on the accuracy of transcranial focused ultrasound simulations. J Neural Eng. Under Revision.
- Berjano EJ. Theoretical modeling for radiofrequency ablation: state-of-the-art and challenges for the future. Biomed Eng Online. 2006;5:24.
- John AP. Relationship between arrhenius models of thermal damage and the CEM 43 thermal dose. Proceedings of SPIE. 2009;7181(04):1–15.
- Pasquinelli C, Montanaro H, Lee HJ, et al. Transducer modeling for accurate acoustic simulations of transcranial focused ultrasound stimulation. J Neural Eng. 2020;17(4):046010.
- Kyriakou A, Neufeld E, Werner B, et al. A review of numerical and experimental compensation techniques for skull-induced phase aberrations in transcranial focused ultrasound. Int J Hyperthermia. 2014;30(1):36–46.
- Okita K, Narumi R, Azuma T, et al. Effects of breast structure on high-intensity focused ultrasound focal error. J Ther Ultrasound. 2018;6:4.
- Sapareto SA, Dewey WC. Thermal dose determination in cancer therapy. Int J Radiat Oncol Biol Phys. 1984;10(6):787–800.
- Dewhirst MW, Vujaskovic Z, Jones E, et al. Re-setting the biologic rationale for thermal therapy. Int J Hyperthermia. 2005;21(8):779–790.
- Stoll AM, Greene LC. Relationship between pain and tissue damage due to thermal radiation. J Appl Physiol. 1959;14(3):373–382.
- Lee HK, Antell AG, Perez CA, et al. Superficial hyperthermia and irradiation for recurrent breast carcinoma of the chest wall: prognostic factors in 196 tumors. Inter J Rad Oncol Biol Phys. 1998;40(2):365–375.
- Myerson RJ, Perez CA, Emami B, et al. Tumor control in long-term survivors following superficial hyperthermia. Int J Radiat Oncol Biol Phys. 1990;18(5):1123–1129.
- Wust P, Rau B, Gellerman J, et al. Radiochemotherapy and hyperthermia in the treatment of rectal cancer. Recent Results Cancer Res. 1998;146:175–191.
- Oleson JR, Samulski TV, Leopold KA, et al. Sensitivity of hyperthermia trial outcomes to temperature and time: implications for thermal goals of treatment. Int J Radiat Oncol Biol Phys. 1993;25(2):289–297.,
- Seebass M, Beck R, Gellermann J, et al. Electromagnetic phased arrays for regional hyperthermia: optimal frequency and antenna arrangement. Int J Hyperthermia. 2001;17(4):321–336.
- Cheng K-S, Stakhursky V, Craciunescu OI, et al. Fast temperature optimization of multi-source hyperthermia applicators with reduced-order modeling of 'virtual sources'. Phys Med Biol. 2008;53(6):1619–1635.
- Kok HP, van den Berg CAT, Bel A, et al. Fast thermal simulations and temperature optimization for hyperthermia treatment planning, including realistic 3D vessel networks. Med Phys. 2013;40(10):103303.
- Aklan B, Zilles B, Paprottka P, et al. Regional deep hyperthermia: quantitative evaluation of predicted and direct measured temperature distributions in patients with high-risk extremity soft-tissue sarcoma. Int J Hyperthermia. 2019;36(1):170–185.
- Kok HP, Ciampa S, de Kroon-Oldenhof R, et al. Toward on-line adaptive hyperthermia treatment planning: correlation between measured and simulated specific absorption rate changes caused by phase steering in patients. Inter J Rad Oncol Biol Phys. 2014;90(2):438–445.
- Van de Kamer JB, Van Wieringen N, De Leeuw AA, et al. The significance of accurate dielectric tissue data for hyperthermia treatment planning. Int J Hyperthermia. 2001;17(2):123–142.
- de Greef M, Kok HP, Correia D, et al. Uncertainty in hyperthermia treatment planning: the need for robust system design. Phys Med Biol. 2011;56(11):3233–3250.
- Kok HP, Schooneveldt G, Bakker A, et al. Predictive value of simulated SAR and temperature for changes in measured temperature after phase-amplitude steering during locoregional hyperthermia treatments. Int J Hyperthermia. 2018;35(1):330–339.
- Sumser K, Neufeld E, Verhaart RF, et al. Feasibility and relevance of discrete vasculature modeling in routine hyperthermia treatment planning. Int J Hyperthermia. 2019;36(1):801–811.
- Van den Berg CAT, Van de Kamer JB, De Leeuw AAC, et al. Towards patient specific thermal modelling of the prostate. Phys Med Biol. 2006;51(4):809–825.
- Mitchell JW, Myers GE. An analytical model of the counter-current heat exchange phenomena. Biophys J. 1968;8(8):897–911.
- Lagendijk JJW. The influence of bloodflow in large vessels on the temperature distribution in hyperthermia. Phys Med Biol. 1982;27(1):17–23.
- Kolios MC, Sherar MD, Hunt JW. Large blood vessel cooling in heated tissues: a numerical study. Phys Med Biol. 1995;40(4):477–494.
- Zhu L, Xu LX, He Q, et al. A new fundamental bioheat equation for muscle tissue-part II: Temperature of SAV vessels. J Biomech Eng. 2002;124(1):121–132.
- Kotte A, van Leeuwen G, de Bree J, et al. A description of discrete vessel segments in thermal modelling of tissues. Phys Med Biol. 1996;41(5):865–884.
- Shrivastava D, Vaughan JT. A generic bioheat transfer thermal model for a perfused tissue. J Biomech Eng. 2009;131(7):074506.
- Gavazzi S, van Lier ALHMW, Zachiu C, et al. Advanced patient-specific hyperthermia treatment planning. Int J Hyperthermia. 2020;37(1):992–1007.
- Dudar TE, Jain RK. Differential response of normal and tumor microcirculation to hyperthermia. Cancer Res. 1984;44(2):605–612.
- Waterman FM, Tupchong L, Nerlinger RE, et al. Blood flow in human tumors during local hyperthermia. Int J Radiat Oncol Biol Phys. 1991;20(6):1255–1262.
- Fiala D, Havenith G, Bröde P, et al. UTCI-Fiala multi-node model of human heat transfer and temperature regulation. Int J Biometeorol. 2012;56(3):429–441.
- Food and Drug Administration. Reporting of computational modeling studies in medical device Submissions - Guidance for industry and FDA staff. Food and Drug Administration. 2016. p. 1–45.
- American Society of Mechanical Engineers. V&V40 assessing credibility of computational modeling through verification and validation: application to medical devices. ASME. 2018. p. 1–60.
- Paulides MM, Bakker JF, Hofstetter LW, et al. Laboratory prototype for experimental validation of MR-guided radiofrequency head and neck hyperthermia. Phys Med Biol. 2014;59(9):2139–2154.
- Farina L, Sumser K, van Rhoon G, et al. Thermal characterization of phantoms used for quality assurance of deep hyperthermia systems. Sensors. 2020;20(16):4549.
- Mobashsher AT, Abbosh AM. Artificial human phantoms: Human proxy in testing microwave apparatuses that have electromagnetic interaction with the human body. IEEE Microwave. 2015;16(6):42–62.
- Trefná HD, Crezee H, Schmidt M, et al. Quality assurance guidelines for superficial hyperthermia clinical trials: I. Clinical requirements. Int J Hyperthermia. 2017;33(4):471–482.
- Kainz W, Neufeld E, Bolch WE, et al. Advances in computational human phantoms and their applications in biomedical Engineering - A Topical Review. IEEE Trans Radiat Plasma Med Sci. 2019;3(1):1–23.
Appendix 1. Summary of the proposed guidelines for computational modeling in hyperthermia
This appendix establishes the recommended minimum level for the computational modeling of hyperthermia therapy.
Patient models
Use of detailed patient models with the relevant anatomical resolution and tissues (including tumor tissue) is strongly recommended.
RF/MW simulations
A specific recommendation on how to carry out EM calculations in HTP as discussed in Section 2.3:
For metallic regions, the use of a perfect electric conductor (PEC) material is advised.
From a numerics perspective, the grid resolution should be initiated at λt/15-λt/10 (FDTD) or λt/8- λt/6 (FEM) and a grid refinement convergence analysis should be performed.
In addition, to ascertain proper resolution of the anatomical heterogeneity and structure, it is heuristically recommended that the maximum grid step for applications similar to the presented benchmarks be chosen as follows:
^ for the pelvic region and regions with similar dimensions, using applicators heating patterns similar to the provided benchmarks: a maximum step size of 5 mm in tissue and a maximum grid step of 1.5 mm in the HT applicator.
^ for the H&N, breast models and regions with similar dimension, using applicators heating patterns similar to the provided benchmarks: a maximum grid step of 1.5 mm in tissue and a maximum grid step of 0.75 mm in the applicator.
The grid convergence of the solution should be ascertained by plotting the maximum SAR or TC50 as a function of the number of mesh elements. Other metrics may be used, if well justified.
The dielectric properties of healthy tissues and tumor should be calculated according [Citation28] and [Citation50], respectively.
Should the results be resampled, a minimal resolution of 5 mm for the pelvic models (or similar) and 2.5 mm for the breast and H&N models (or similar) is recommended.
For time domain simulations, the antennas are typically excited with harmonic signals and simulated for at least 20 periods (dependent on the domain-size/wavelength ratio and the Q-factor of the applicator). Convergence analysis (i.e., achievement of periodic results) is recommended.
For time-domain methods, perfectly matched layer (PML) boundary conditions are recommended.
For implicit solvers, convergence assessment based on residuum reduction is recommended (at least by 8 orders of magnitude, until no significant changes are observed).
US simulations:
A specific recommendation on how to carry out FUS calculations in HTP as discussed in Section 2.7:
LAPWE is recommended and full-wave 3D solvers should be used
For FDTD simulations, λt/12 resolution is recommended, but should be accompanied a grid convergence analyses
For FDTD, simulations, PML boundary conditions and Dirichlet pressure sources are suggested.
For transcranial FUS the highly heterogeneous structure of skull and bone cannot be neglected and property maps (e.g., from CT) should be used.
The acoustic tissue properties of reference [Citation28] should be used. For breast tumor, glandular breast tissue properties should be used [Citation88].
In the context of HT, spatial scanning is necessary as a result of the high FUS focality to achieve an adequate temperature distributions
Thermal simulations
Unless the hypthermia therapy is applied in a dynamic fashion (e.g., time-modulated), thermal simulations shall be performed according to Section 2.4, i.e.,
Apply a steady-state formulation of the Pennes’ bioheat equation for temperature optimization
Computations are performed using static blood perfusion under heat stress ().
We recommend that solver convergence is ascertained, as the required degree of residuum reduction depends on the heating focality and initial condition (e.g., 37C).
Dirichlet or Convective boundary conditions should be used for the water bolus interface (the reference temperature will typically be in the range 10–40 °C, depending on the specific treatment protocol), as well as interfaces to internal and external air, and major blood vessels. For Convective boundary conditions, the convective coefficients must be provided and justified. They are typically in the range of 2–40 W/m2/K (depending on forced vs. natural convection, velocity, and thermal properties).
For the calculation of the quality metrics and as general recommendation (unless the treatment protocol demands otherwise), the input power is scaled such that both tumor and normal tissue temperatures do not exceed 44 °C. In case of brain and eyes, the tissue temperatures should not exceed 42 °C.
Optimization and quality metrics
The optimization metrics from Section 2.5 have been clinically used as they were shown to correlate with simulated and measured T50, as well as treatment outcome. Therefore, we recommend applying and/or reporting on the metrics stated below.
For SAR-based quality indicators, both Target-Hotspot-Quotient (THQ) and target coverage (TC) metrics on the smoothed SAR field (1 cm3 moving-average filter; cfSAR) are desirable. The cfSAR is normalized to the maximum cfSAR in the patient.
Tumor coverage is evaluated by the indexed iso-temperatures T10, T50 and T90 when scaling the exposure to a maximal temperature of 44 °C, for both tumor and normal tissues.
In order to increase the chance of identifying the global optimum, performing several optimization runs with random initial phase-amplitude settings is recommended.
Reporting on the duration of the optimization producedures and the employed computational hardware is encouraged.
Appendix 2. ESHO 2021 grand challenge on hyperthermia computational modeling
The purpose of the ESHO Grand challenge is to drive and facilitate the standardized evaluation of new hyperthermia applicator and treatment optimization techniques. The simulated performance of novel technologies will be compared with benchmark applicators and anatomical models. Detailed instructions of the challenge are published at https://www.esho.info/ESHOGrandChallenge.
The available datasets contain segmented patient voxel models, electric field distribution generated by the benchmark applicators, and amplitude/phase values of the optimized antenna steering parameters. To request the datasets, an email with the subject ‘ESHO-GC-setup’ should be sent to [email protected].
Hyperthermia treatment planning (HTP) approaches
We encourage to use all available benchmarks of anatomical models and applicators. The applicators shall remain unaltered. The dielectric properties of healthy tissues and tumor must be assigned according to [Citation28] and [Citation51], respectively. Thermal modeling must be carried out as described in Section 2.4.
Novel applicator developments
We encourage to apply proposed novel applicators to two different provided anatomies. If the investigated frequencies deviate from those in the benchmarks, the dielectric properties of healthy tissues and tumor must be calculated according [Citation28] and [Citation51], respectively, and reported. Note that new applicator proposals may be accompanied with new optimization approaches.
US HT
The provided acoustic benchmark for the ESHO Grand Challenge consists of the patient models Venus and simulates the acoustic exposure and induced heating from a spherical transducer (see Section 2.7 regarding placement and geometry). Thermal simulations shall be performed according to Section 2.4 and the acoustic properties from [Citation28] must be used. The simulation methods shall support full-wave 3 D modeling (e.g., FDTD or pseudo-spectral method). For FDTD solvers, PML boundary conditions should be employed and it must be ascertained that the number of layers prevents significant reflections at the domain boundary. The thermal optimization metrics from Section 2.5 apply for treatment optimization.
In view of the high focality of FUS, – which is a strength for targeting, but also poses a challenge when treating larger tumors, we encourage participants to investigate/devise scanning strategies and/or corresponding phased-array applicators that permit to maximize the thermal optimization metrics from Section 2.5.
Appendix 3. Patient – device positioning settings
Table A1. Center point of the patient models, water bolus and antennas. All values are given in millimeters.