
 ?Mathematical formulae have been encoded as MathML and are displayed in this HTML version using MathJax in order to improve their display. Uncheck the box to turn MathJax off. This feature requires Javascript. Click on a formula to zoom.
Abstract
Objective
Hyperthermia as an enhancer of radio- and/or chemotherapy has been confirmed by various trials. Quite a few positive randomized trials have been carried out with capacitive hyperthermia systems (CHS), even though specific absorption rates (SAR) in deep regions are known to be inferior to the established annular-phased array techniques. Due to a lack of systematic SAR measurements for current capacitive technology, we performed phantom measurements in combination with simulation studies.
Materials and Methods
According to the current guidelines, homogeneous and inhomogeneous agarose phantoms were manufactured for the commercial CHS Celsius42. Temperature/time curves were registered, and specific absorption rate (SAR) profiles and distributions were derived using the temperature gradient method. We implemented models for electrodes and phantom setups for simulation studies using Sim4Life.
Results
For a standard total power of 200 W, we measured effective SAR until depths of 6–8 cm in a homogeneous phantom, which indicates fair heating conditions for tumor diseases in superficial and intermediate depths. A fat layer of 1 cm strongly weakens the SAR, but 10–20 W/kg are still achieved in intermediate to deep regions (2–10 cm). In the phantom setup with integrated bone, we measured low SAR of 5–10 W/kg in the cancellous bone. Our simulations could fairly describe the measured SAR distributions, but predict tendentially higher SAR than measured. Additional simulations suggest that we would achieve higher SAR with vital fatty tissue and bone metastases in clinical situations.
Conclusion
Capacitive systems are suitable to heat superficial and medium-deep tumors as well as some bone metastases, and CHS application is feasible for a specific class of patients with pelvic and abdominal tumors. These findings are consistent with positive clinical studies.
Introduction
The combined use of hyperthermia with radiation therapy and/or chemotherapy is a well-known treatment method to enhance the oncologic outcome in several types of cancer. In doing so, different hyperthermia systems are applied [Citation1]. Annular-phased-array systems (APAS) have been successfully validated in a few randomized studies on locally advanced sarcoma and cervical cancer [Citation2,Citation3]. However, APAS constitutes a technically complex and cost-intensive method of hyperthermia, resulting in limited availability worldwide. On the other hand, particularly in Asia, a significant number of positive clinical trials using capacitive hyperthermia systems (CHS) were performed with promising clinical outcomes [Citation4–7], and guidelines for CHS have been drawn up early [Citation8]. As a result, CHS are more widespread than APAS, which is technically superior but has limitations as well [Citation9]. In any case, the high number of positive studies with capacitive technology is surprising and should be further investigated. We hypothesized that the potentials of the capacitive technique might be underestimated in the case of targets in intermediate depths (e.g., head & neck tumors) and specific bony lesions or metastases. On the other hand, the strongly limiting influence of fat layers for deep heating was recognized early [Citation10–12]. We concluded that absolute measurements of the specific absorption rate (SAR in W/kg) using meaningful phantom setups for a common CHS might elucidate the indications for the capacitive technology. Such measurements are time-consuming and not available for current systems in clinical use to the best of our knowledge.
Numerous simulation studies were performed upon CHS [Citation13,Citation14], some intending the comparison to APAS [Citation8–10]. Such comparative modeling studies show limitations of CHS to heat deep-seated tumors. Sahinbas et al. [Citation15] recorded temperature-time curves in a couple of measurement points in two static phantoms (agarose, Alderson), but did not determine the global SAR distributions. In particular, comparisons of measured SAR distributions in a standard phantom setup [Citation16] with calculated SAR patterns for specific models are missing, but are a prerequisite to develop patient-specific planning.
For a better assessment of CHS, we performed absolute SAR measurements in phantoms for the commercially available CHS Celsius42 and compared them with numerical calculations in our simulation platform.
Materials and methods
Phantom design
In order to elucidate the indication spectrum of the CHS Celsius42 we determined the achievable SAR in a homogeneous phantom setup to estimate the heating capability under favorable conditions. Then we evaluated the SAR for two additional inhomogeneous phantom setups either with a fat layer or an integrated bone, which are known as limiting factors for the heating capability. With the latter phantom setup, we also wanted to investigate the suitability of the system for treating bone metastases. We determined the central SAR depth profiles along the central y-axis in measuring points Vx () and SAR distributions in the y/z-plane.
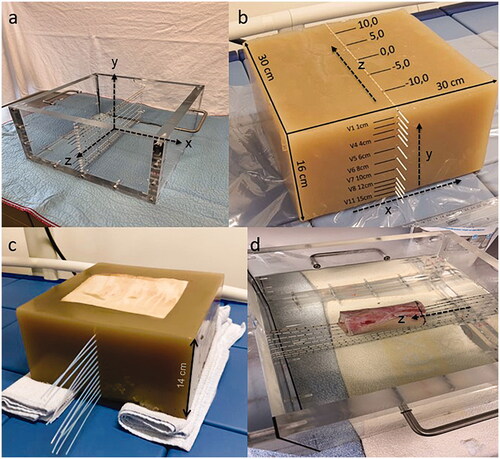
Figure 1.1. (a) Casting mold for the phantom fabrication with a coordinate system, (b–d) three different phantoms with y perpendicular to the catheters (depth profile) and z parallel to the catheters. (b) homogeneous agarose phantom, (c) phantom with integrated porcine fat layer, (d) phantom with integrated bone.
Homogeneous phantom
A homogeneous phantom was produced according to the quality assurance guidelines for superficial hyperthermia [Citation16]. First, a casting mold made of acrylic glass (width: 30 cm, depth: 30 cm, height: 16 cm) was manufactured (). The acrylic glass was previously prepared with drill holes required for insertion and fixation of catheters (1.6 mm diameter) for temperature measurements. 640 grams of Agarose powder (Sigma Aldrich) and 38.4 grams of sodium chloride were mixed with 15.5 liters of heated (70° celsius) demineralized water, followed by a heating period at a temperature of 85° celsius maintained for 10 min. Afterward, the agarose mixture was poured into the casting mold for hardening. The mixture of agarose, sodium chloride, and demineralized water was selected in accordance with the guidelines to manufacture a homogeneous 2/3 muscle equivalent phantom with the following properties: σ = 0.44–0.6 S/m, εr = 79, ρ = 969 kg/m3 at 13.56 MHz [Citation16].
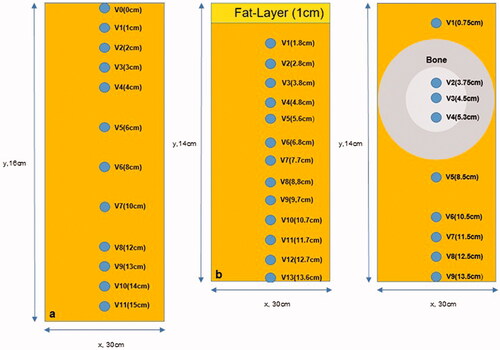
The completed phantom () was equipped with 12 catheters in the midplane placed vertically one below the other to measure temperature/time curves in the central axis y with the depths V0-V11 (V0= superficial, V1 in 1 cm, V2 in 2 cm, V3 in 3 cm, V4 in 4 cm, V5 in 6 cm, V6 in 8 cm, V7 in 10 cm, V8 in 12 cm, V9 in 13 cm, V10 in 14 cm and V11 in 15 cm) depicted in . The coordinate system x/y/z is defined in according to conventions in radiotherapy. The catheter array spans the y/z-plane. Knowing that the catheters tend to expand under the heat of the agarose when filled into the mold, we confirmed the location of the catheters via computerized tomography (CT) imaging of the cooled phantom.
Inhomogeneous phantoms
The production of the agarose matrix was equivalent to the homogeneous phantoms. In the next step, two different kinds of inhomogeneous phantoms were manufactured as follows.
Phantom with fat layer
A layer of porcine skin fat was cut to the dimensions of 20 cm x 20 cm x 1 cm. The fat layer was integrated into the agarose mixture at the top of the phantom. Thus, the porcine skin constituted the upper surface of the phantom. The whole phantom measured 30 cm x 30 cm x 14 cm. Thirteen catheters (V1-V13), (V1 in 1,8 cm, V2 in 2,8 cm, V3 in 3,8 cm, V4 in 4,8 cm, V5 in 5,6 cm, V6 in 6,8 cm, V7 in 7,7 cm, V8 in 8,8 cm, V9 in 9,7 cm, V10 in 10,7 cm, V11 in 11,7 cm, V12 in 12,7 cm, V13 in 13,6 cm) were implanted in the phantom central plane as depicted in , whereby V1 was placed very near to the fat layer. Given the short life span of the phantom, no CT data were acquired to confirm the location of the catheters.
Phantom with bone structure
For analyzing the influence of bony structures on the SAR-distribution, a part of a bovine long bone (thigh bone) of 10 cm in length with a diameter of 5.5 cm was integrated (center of the thigh bone in 4.5 cm depth) in the agarose phantom (30 cm x 30 cm x 14 cm) in the z-direction. Nine catheters were placed in the phantom with three [V2-V4] traversing the bone longitudinally (in z-direction). The depths of the catheters V1-9 (V1 in 0,75 cm, V2 in 3,75 cm, V3 in 4,5 cm, V4 in 5,3 cm, V5 in 8,5 cm, V6 in 10,5 cm, V7 in 11,5 cm, V8 in 12,5 cm, V9 in 13,5 cm) were confirmed by CT scans of the phantom and are illustrated in .
Sequential control of electrical properties of phantoms
After chilling and hardening of the phantom, a sample was analyzed for electrical properties. At later dates, further samples of the used phantom were taken. The dielectric properties of the samples were characterized by the open end coaxial probe method using a network/spectrum/impedance analyzer (4396 b, Agilent Technologies Inc., CA, USA) [Citation17–19]. To control time-/treatment-induced alterations, the analysis was repeated after ten days and after six weeks.
Measurements
Equipment for temperature measurements
Four fiberoptic temperature measuring probes (OTG-MPK5/opSens-Solutions, Quebec, Canada) with a temperature accuracy of ± 0.3 °C (20–45 °C) and a reaction time of 225 milliseconds were used to record temperatures.
Capacitive hyperthermia system
The capacitive heating was performed with the clinically employed Tumor Cell Solution (TCS) system (Celsius42, 52249 Eschweiler, Germany). The system consists of a patient bench, the main electrode fixed on a rotatable arm and an adjustable counter electrode integrated into the bench. Both electrodes (main and counter-electrode) are available in two diameters (15 and 25 cm). Both electrodes are equipped with an integrated water bolus of 2 cm height.
Measuring procedure in phantoms
The homogeneous or inhomogeneous phantoms were placed on the bench between the main and the counter electrode. For optimal coupling of the electrodes to the phantom, a thin additional water bolus (heat-sealed plastic foil filled with demineralized water, 17 cm x 17 cm size, thickness approximately 1 cm) was placed between electrode and phantom on each side. The very small additional (not electrode integrated) water bolus were not considered for the simulation model ().
At the start of the measurement procedure, two temperature probes were inserted from opposite sides into the catheter to meet at position z = 0 (defined as the midline vertical central axis). During the measurement, the probes were pulled out stepwise to 12 positions (± 1, 2, 3, 4, 5, 6, 7, 8, 9, 10, 11, 12 cm distance from the central axis). Temperature detection always started with the most superficial catheters. After power-on with 200 Watt, the temperature detection for a two-minute period was performed at each position resulting in a time-temperature curve depicted and saved on the connected PC system. After a measuring period of 30 min, all measuring points of two catheters along z (Vx/z= ±1–12 cm) were analyzed, and the experiment had to be paused for a minimum of 12 h to ensure thermal equilibration (reaching room temperature) of the phantom. The procedure, as outlined above, was repeated until measurements of all catheters were completed.
We checked that the linearity of the temperature-time curves in the measuring interval of 30 min was still satisfactory. Due to the chronological order of SAR measurements after power on, the SAR was determined particularly precisely centrally and was possibly underestimated for small SAR and the latest measurements in the periphery due to increasingly disturbing thermal gradients.
Figure 2. Model of the applicator and phantom setup for the simulations. We variated diameters of the electrodes and dielectric properties εr and σ of the different phantoms (see Figure 1, ) to improve agreement between measurements and simulations.
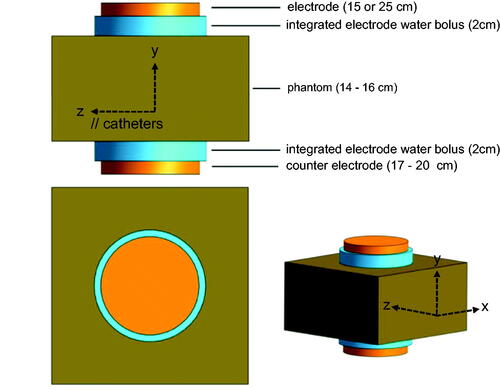
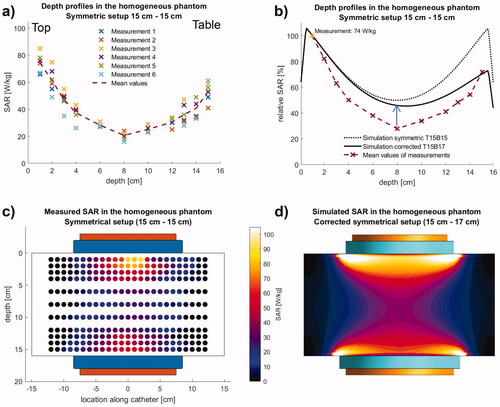
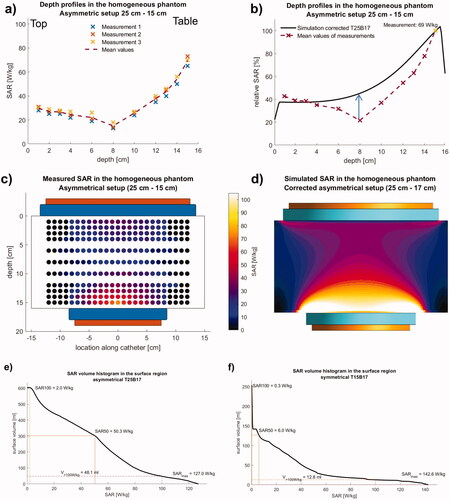
Figure 3. Measurements (left) and simulation (right) in the homogeneous phantom using the symmetrical electrode setup. (a) Measurements (sixfold) of absolute SAR along the central depth profile. (b) Comparison of mean measurements with simulations normalized to V1. The best agreement is achieved, if the asymmetry is considered by an increased bottom electrode with 17 cm diameter (solid line). The simulation predicts SAR nearly twice as high in the central part. The symmetric setup with 15 cm electrodes top and bottom results in a poor agreement. (c, d) Measured SAR distributions (left, T15B15) in comparison to the simulations (right, corrected T15B17). In simulation, dissipated power Pdiss = 200 W was obtained for a voltage of 88 V. While the agreement in the center is satisfactory (depth profiles in b), SAR elevations at the electrode edges are not measured due to the measurement procedure (see text).
Calculation of the specific absorption rate (SAR) and estimation of temperature
The gradient of temperature increase over time after power on was used to calculate the SAR according to the formula derived from the bioheat-transfer equation, if the precondition of a vanishing Laplacian [Citation20,Citation21]:
(1a)
(1a)
We used a heat capacitance c = 4000 Ws/kg°C (between muscle and fat). We note that this method tends to underestimate the measured SAR, if the SAR is small in comparison to the adjacent thermal gradients. The formula above is not applicable, if high SAR gradients occur, because then the Laplacian of the temperature is not zero even shortly after switching on.
In macroscopic regions, i.e., volumes ≥ 1 ml or dimensions ≥ 1 cm, with given SAR[W/kg] and perfusion w[ml/100g/min] the temperature rise ΔT[°C] can be estimated using a simple formula [Citation20,Citation21]:
(1b)
(1b)
According to this formula, the (reactive) perfusion determines whether or not a hot spot arises. Note that for SAR = 100 W/kg a reactive perfusion of 30 ml/100g/min is sufficient to keep the temperature below 42 °C. The smaller the exposed volume and the more superficial it is, the greater the additional contribution of conduction and water bolus to cooling.
Simulation of SAR distributions
Calculations of SAR-profiles and -distributions in the phantoms were performed for comparison with dielectric parameters in agreement with our measurements and published values as listed in [Citation22]. The software Sim4Life (ZurichMedTech, Zürich, Switzerland) was applied for the computational simulation process. Sim4Life facilitates the modeling of electromagnetic data derived from a model for the electrodes, water bolus, and phantom, according to . The simulations of electromagnetic fields at 13.56 MHz are based on the electrical quasi-static approximation [Citation13].
Table 1. Range of dielectric properties er and s [S/m] for the phantom materials and tissues at 13.56 MHz, which is found in the literature (see references) and applied for the simulation studies (see text).
The procedure of simulations
Geometrical objects were generated in the 3 D-Interface of Sim4Life to emulate the original dimensions. Cuboids with the original dimensions of the phantoms (30 cm x 30 cm x 16 cm or 30 cm x 30 cm x 14 cm), cylinders with the radius of 7.5 cm (small electrode) or 12.5 cm (large electrode) and a height of 1 cm representing the CHS electrodes, and cylinders with the diameter of the respective electrode plus 1 cm and a height of 2 cm to model the integrated water bolus of the electrodes were created (). In inhomogeneous phantoms, the position and composition of the fat layer and long bone were also modeled. For the bone we delineated the shell with cortical bone of 1.5 cm thickness and cancellous bone of 2.5 cm thickness resulting in a cylinder of 5.5 cm diameter. Afterward, tissue-specific parameters (density, conductivity, relative permittivity) were defined for each simulated structure according to [Citation22–24] as summarized in . The capacitive treatment system was simulated with a frequency of 13.56 MHz and a voltage of 100 V between the two electrodes (±50 V). An isotropic resolution of 1 mm in the phantom was implemented. The simulation results were analyzed regarding the total dissipated power Pdiss within the phantom. The voltage was then rescaled until Pdiss amounted to 200 W, matching the power setting used in the experiments.
The resulting SAR data was averaged over cubes with a mass of 1 g (SAR1g) in order to mimic the resulting temperature distribution and better match the temperature derived SAR-measurements. Comparison between simulation and measurements were only performed for normalized SAR values because information on the real voltage between electrodes and real total power (Watt) deposited in the phantom (efficiency) was not known. To account for a discrepancy in absolute power levels between the actual experiments and simulations, due to any losses or interactions beyond the electrodes, the SAR distribution along the depth profiles was compared qualitatively. The measured depth profiles were normalized to the maximum, and its position was identified. The simulated profiles were then normalized to their value at the same position as the measured maximum. This can result in simulated values >100%, especially at the surface since the catheters were always placed in a certain depth within the phantom. For absolute SAR values (SAR distribution and SAR volume histograms) we determined the correct voltage that provided a dissipated power of 200 W in the phantom.
In a second step, we aimed to investigate the hypothesis that the bottom electrode is not free of interactions with the patient table it is embedded in. To do so, we varied the diameter of the bottom electrode and compared the simulated SAR distributions and profiles with our measured data.
Last, we chose and varied the dielectric parameters of our ex-vivo fat and bone inserts within the range of reported values [Citation22,Citation24] to estimate the difference between the values in our ex-vivo measurements and the corresponding SAR values to be expected for vital tissue.
Results
Homogeneous phantom
Sequential control of electrical properties of phantoms
For confirmation of expected electrical properties (phantom manufacturing was performed according to the preparation recommendations of the guidelines) and for control of consistency and stability, measurements of conductivity σ and permittivity εr of the homogeneous phantom were performed and detected the following results:
We found for the homogeneous phantom () εr of 76 and σ of 0.41 S/m after production, εr of 76 and σ of 0.43 S/m after ten days and εr of 81 and σ of 0.47 S/m after six weeks.
Measurements and simulations with electrodes of 15 cm diameter top and bottom
For a total power of 200 Watt, temperature/time curves in the central y-axis of the catheters V1-V11 were registered (six replicate measurements) ( and ).
The resulting absolute SARs (see methods) were depicted as SAR depth profiles (). With a mean of 74 W/kg (±6.6 W/kg standard deviation), the maximum SAR was detected at the lowest depth of 1 cm in all measurements. The SAR declines to 21 W/kg (±3.3 W/kg) in a depth of 8 cm (V6).
The distribution of absolute SAR values in the y/z plane was also determined and depicted. This complete distribution was determined only in one of the six measurements (). The highest SAR values were detected along the central y-axis. We found a decrease of SAR values with increasing distance to the central y-axis and increasing depth. As a result of this observation, the SAR-distribution is shaped like an hourglass. It is important to notice that, unlike theoretically expected for an undisturbed symmetrical electrode setup, the distribution is not symmetrical with respect to the middle axis along z.
Normalized to the maximum absolute SAR, we calculated relative SAR values and created a relative SAR distribution profile of the central phantom y-axis (). The penetration depth d1/2 (depth with a reduction of SAR to 50% in comparison with surface value) of approximately 4 cm was determined. In the center of the phantom (8 cm depth), the relative SAR is still 28% of the maximum SAR. At the bottom side of the phantom, 72% of the maximum SAR was detected, highlighting a significant asymmetry despite the symmetrical setup.
shows that simulating the bottom electrode (B) with a corrected diameter of 17 cm (‘T15B17’, solid black line) shows better agreement with our measured data (dashed red line) than the symmetrical setup (‘T15B15’, dotted black line), confirming our hypothesis of a certain coupling of the electrode to the patient table.
show the measured and simulated SAR distributions in the y-z plane using the corrected bottom electrode in the simulation setup. Generally, the simulations are based on ideal configurations (see the model in ), whereas the measurements are subject to various restrictions. Therefore, the simulated curve results in higher relative SAR by a factor of 1.5 to 2 in the central part (blue arrow in ).
The calculated SAR elevations at the edge of the electrodes are confined to a small volume, e.g., SAR > 100 W/kg in a volume of < 15 ml (). Because of (reactive) perfusion, superficial bolus cooling, and smoothing effect of the bioheat transfer equation for the temperature, these maxima are typically neither measurable by our method nor clinically relevant (see a detailed analysis for the asymmetrical phantom setup below).
Figure 4. Measurements (left) and simulation (right) in the homogeneous phantom using the asymmetrical electrode setup. (a) Measurements (threefold) of absolute SAR along the central depth profile. (b) Comparison of mean measurements with simulations normalized to the largest measurement in V11. The best agreement is achieved with the actual diameter 25 cm for the top electrode and the increased diameter 17 cm for the bottom electrode (solid line). Like in , the simulations yield SAR twice as high in the central part. (c,d) Measured SAR distributions (left, T25B15) in comparison to the simulations (right, corrected T25B17). In simulation, dissipated power Pdiss = 200 W was obtained for a voltage of 73 V. While the agreement in the center is satisfactory (depth profiles in b), SAR elevations at the electrode edges are not measured due to the measurement procedure (see text). (e) SAR volume histogram for the asymmetrical setup at the bottom electrode (diameter of 17 cm) in a cylindrical volume of diameter 23 cm and 1 cm height. Pdiss = 200 W was obtained for a voltage of 88 V. SAR of >100 W/kg are in a volume of 50 ml and SAR > 50 W/kg in 300 ml. Reactive perfusion and surface cooling determine the final temperature (see Equation 1b and text). A decrease of these values in experiments/treatment is to be expected considering the idealized simulation setup limited to the electrodes and the phantom, neglecting any losses beyond. Nevertheless, if necessary in treatment, the total power of 200 W must be reduced. (f) SAR volume histogram for the symmetrical setup. Pdiss = 200 W was obtained for a voltage of 73 V. At the top electrode (diameter 15 cm) SAR > 100 W/kg are in a volume of 13 ml and SAR > 50 W/kg in
40 ml. Therefore, the risk of overheating is reduced in comparison to the asymmetrical setup.
The restrictions in the phantom setups and measurement procedures, which were not considered in the model, are due to additional interfaces between boluses and electrodes/phantom, the catheter array itself (housing the fluoro-optic probes), and averaging effects as well as thermal gradients during the measurement process (see methods). Note that even low thermal gradients can lead to a further lowering of low SAR in the center and periphery. All these limitations contribute that the measured SAR is below the simulations.
Measurements and simulations with asymmetrical phantom setup (top electrode 25 cm diameter, bottom electrode 15 cm)
For this asymmetric phantom setup, the measured depth profile of the absolute SAR along the central y-axis (three replicates) is shifted to the smaller electrode, as shown in . The SAR distribution again showed maximum SAR in the central y-axis and a decrement with distance from this axis. The maximum SAR was located close to the smaller bottom electrode of the phantom (mean 70 W/kg ± 3.1 W/kg in V11, 1 cm distance from the bottom). In the center of the phantom in V6 (depth 8 cm from the bottom), the mean SAR declines to 15 W/kg (±2.3 W/kg), but is still sufficiently high in V9 (3 cm depth from the bottom with 44 W/kg ± 2.4 W/kg) and V8 (4 cm depth from the bottom with 37 W/kg ± 2.2 W/kg), again showing a d1/2 of approximately 4 cm away from the smaller dominant electrode (). The SAR increase toward the larger electrode on the opposite side is only small.
For the simulations () we normalized to the maximum of the measurements in V11. A satisfactory agreement between simulation (solid line) and measurements is achieved, if we assume a counter electrode with the same 17 cm diameter, as determined above, while the top electrode remains 25 cm in diameter. Again, the simulation predicts higher SAR than recorded in measurements up to a factor of 2 (see arrow in ) in the central parts of the phantoms for the same reasons as described for the symmetric 15–15 cm setup.
For the total dissipated power of 200 W, the SAR increase at the edge of the bottom electrode is visually particularly pronounced and is therefore analyzed in more detail. The SAR volume histogram (SVH) of the bottom electrode’s surface region () indicates macroscopic volumes of 48 ml with high SAR > 100 W/kg (SARmax = 127 W/kg) and 300 ml with SAR > 50 W/kg. The volumes exposed with high SAR are at or just below the surface. Therefore, estimation of the temperature rises according to EquationEquation 1b(1b)
(1b) shows that (reactive) perfusions of 20–30 ml/100g/min and ideally an additional cooling effect of the water bolus (20 °C room temperature) are required to keep the temperature in the superficial tissue below critical values of 42–44 °C. In contrast, the SVH for the symmetrical setup shows () that the exposed volumes with SAR > 100 or >50 W/kg are distinctly smaller (<15 ml or 40 ml). The risk of hot spot formation is therefore lower for the symmetrical setup assuming the same total power of 200 W.
Inhomogeneous phantoms
Measurements and simulations using the fat layer phantom and symmetric electrode setup (15 cm diameter)
For the phantom with integrated fat layer of 1 cm thickness ( and ) the maximum SAR at 200 W was identified in position V1 (adjacent to the bottom surface of the fat layer) with a rather high value of 80.5 W/kg. The depth profile then exhibits a steep decrease down to 10–20 W/kg (V2 < 1 cm below the fat layer, ) and a slight increase up to 25 W/kg toward the bottom electrode. Note that the simulated SAR drop from the fat layer to the agarose is set by the averaging dimensions of 1 cm. This averaging size reflects the smoothing effect of the temperature and the resulting spatial inaccuracy of V1 in relation to the fat layer. In contrast to the homogeneous phantom, the SAR penetration depth d1/2 declines to 2–2.5 cm caused by the fat layer. The decline of SAR under the fat layer resulted in relative SAR values down to 20% in the center and a slight increase up to 30–40% toward the counter electrode. Due to the limited storage life and degeneration of the fat layer in this phantom, only one complete measurement along the central y-axis was performed.
Figure 5. (a) Measurements of absolute SAR along the central depth profile in the phantom with integrated fat layer of 1 cm thickness. V1 (see ) is near at the electrical boundary fat/agarose and is used for normalization. (b) Qualitative agreement between the measured and simulated curves exists but normalization according results in rather large differences between measurements and simulation. (c) Better agreement (solid line) is achieved when shifting the measuring points 6 mm toward the fat layer and assuming minimum values of σ and εr (). Simulations are maximally twice as high in accordance (solid line). For the largest values of σ and εr simulations predict 3–4 times higher SAR (dotted line). We assume that the latter approaches the clinical situation. (d) Nearly the same curves are achieved, if we assume plausible errors for the fat layer thickness and y-coordinates of ±3 mm, i.e., fat layer of 1.3 cm thickness and V1 in 1.5 cm depth.
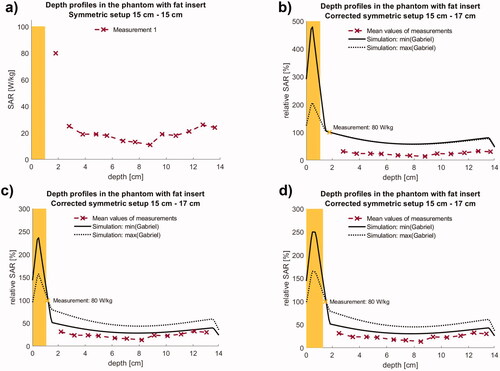
shows the relative SAR depth profiles compared with simulations. Qualitative agreement between the measured and simulated curves exists but the exact position of the normalization point V1 turned out to be critical. The high SAR value measured at V1 vs. the consistently low values in V2-13 indicate that V1 must be located closer to the fat/agarose interface than initially assumed (see ) since V1 is exposed to a high temperature increase occurring in the superficial fat layer. Moving the measuring points 6 mm toward the fat layer, which is consistent with the error interval set by our SAR measuring method, resulted in an improved agreement between simulation and measurements ().
Due to the short life span of the phantom, no CT data are available to confirm catheter placement and actual thickness and location of the fat layer. Therefore, the thickness of the fat layer and coordinates V1-13 are only recorded in the laboratory book. However, for the measurements of coordinates and the thickness/alignment of the fat layer, we can assume errors of ± 3 mm each. This justifies the shift of V1-13 by 6 mm toward the fat layer, of which the corresponding relative SAR profile is shown in . To confirm our assumptions, we performed a second set of simulations for the maximum errors, i.e., for a fat layer of 1.3 cm thickness and a shift of only 3 mm toward the surface for the comparison. We obtained very similar results ().
Simulations of the SAR depth profiles were performed with the lowest possible σ = 0.03 S/m and εr = 10 of that best characterize a devitalized porcine fat layer (solid curves), which is non-perfused and drier than under in vivo conditions. With these assumptions, we obtain high SAR in the fat layer and a steep decline of SAR beneath the fat with a satisfactory agreement between measurements and simulations (solid curve in ). Again, the simulations predict SAR higher by a factor of 1.5–2.
If we assume the highest possible σ = 0.20 S/m and εr = 40 of that better approach the in vivo conditions, we calculate distinctly higher SAR by a factor of 3–4 in the center (dotted curve). Therefore under clinical conditions, a 1 cm fat layer might be less restricting than expected from our phantom measurements.
For the total power of 200 W, the SVH at the top electrode results in a volume of 24 ml with SAR > 100 W/kg and 80 ml with SAR > 50 W/kg, which is below the asymmetrical setup.
Measurements and simulations using the phantom with integrated bone and symmetric electrode setup (15 cm diameter)
With the standard power of 200 Watt, in the phantom with the integrated bovine thigh bone (ranging from y = 1.8 to 7.3 cm, and ), we measured mean absolute SAR values of 101 W/kg at position V1 in a depth of 0.75 cm (two replicates) and rather low values of 5–10 W/kg (V2-V4) in the cancellous bone. Results are depicted in . Beyond the bone, the SAR increases toward the bottom electrode up to 50 W/kg.
Figure 6. Measurements (left) and simulation (right) in the phantom with bone insert using the symmetrical electrode setup. (a) Measurements (twofold) of absolute SAR along the central depth profile. In the cancellous bone low SAR of 5–10 W/kg are measured. (b) The best agreement is achieved for the dielectric parameters er and s of ex vivo bone () and an increased diameter of 20 cm for the bottom electrode in the table (solid line). Again, simulations are higher (see arrow). For er and s of vital bone distinctly higher SAR of ∼50 W/kg are calculated (dotted line). This confirms the suitability for bone metastases. (c,d) Measured SAR distributions (left, T15B15) in comparison to the simulations (right, corrected T15B20). In simulation, Pdiss = 200 W was obtained for a voltage of 84 V. While the agreement in the center is satisfactory (depth profiles in b), SAR elevations at the electrode edges are not measured due to the measurement procedure (see text).
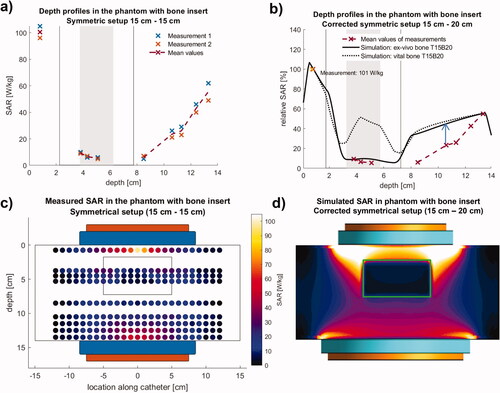
The relative SAR depth profile illustrates the steep decrement of SAR in the bone and beyond the bone in the near distance. SAR increases up to 50% toward the bottom electrode ().
The measured SAR distribution () shows a strong weakening in the center of the thigh bone below 10 W/kg. At the same time, SAR increased to the end of the bone, which ranges from z = −5 cm to +5 cm, indicating some enhancing edge effects near the end of the bone inside and outside the bone. Likewise, with rising distance to the bone, the SAR increased in the area under the bone (V6-V9, i.e., 10.5–13.5 cm).
The simulation () shows a steep SAR decrease toward the bone for the central depth profile, comparable to the measurements. The intraosseous measurements of 5–10 W/kg () are accurately reproduced by the simulations, if the low ex-vivo values for εr and σ in for cortical and cancellous bone are applied (solid curve). However, the dielectric properties of vital bony structures and lesions are different (). If we insert the highest possible values for cortical and cancellous bone, which are described in the literature [Citation22,Citation24], effective SAR of 50 W/kg are predicted in the cancellous bone (dotted line). Even higher SAR are expected, if we assume a soft tissue mass in the bone with εr ∼ 70–80 and σ ∼ 0.6–0.8 S/m typical for a destructive metastatic lesion.
Beyond the bone toward the bottom electrode with increasing distance from the normalization point, the calculated SAR is again higher than the measurements. For a better agreement, we increased the effective diameter of the counter electrode up to 20 cm. This larger diameter (compared with the homogeneous phantom) can be explained by the shielding effect of the bone and the smaller phantom height (14 cm instead of 16 cm, and ).
For the total power of 200 W, the SVH at the top electrode results in a volume of ml with SAR > 100 W/kg and
50 ml with SAR > 50 W/kg, which is below the asymmetrical setup.
Discussion
Our phantom measurements with a common clinical system Celsius42 in conjunction with targeted simulation studies were able to substantiate the spectrum of indications for capacitive hyperthermia.
The homogeneous phantom of 16 cm thickness represents for σ of 0.4–0.5 S/m, a so-called 2/3 medium, if we assume σ around 0.7 S/m for muscle [[Citation22,Citation24], ]. Our results show that for a clinically feasible total power of 200 W, sufficiently high SAR of 60 W/kg in 2 cm depth and still 30 W/kg in 6 cm depth and 20 W/kg even in 8 cm depth can be reached. Note that the requirements for an adequate heating device for superficial hyperthermia according to ESHO guidelines (60 W/kg in 1 cm depth) are exceeded [Citation16]. The penetration depth d½ (depth for a decline of the SAR by 50%) amounts to 4 cm and is thus higher than with radiative applicators (e.g., at 434 MHz). The SAR distribution of the and appears well suited for the neck region, but also for numerous superficial and medium-deep (6–8 cm) tumor diseases such as tumors of the chest wall, back, breast, abdominal wall, lymph node regions (cervical, supraclavicular, axillary, inguinal) and selected tumors of the limbs (e.g., sarcomas). According to guidelines, SAR of 20–30 W/kg (0.3–0.5 °C/min) is a minimum requirement to enable effective heating [Citation25,Citation26]. We note that away from boundaries inside a tumor, the temperature increase ΔT can be estimated with the formula ΔT [°C] = 1.5 x SAR/w, if the SAR (in W/kg) and the perfusion w (in ml/100g/min) are known [Citation20]. Therefore, with SAR of 20–30 W/kg, low perfused tumors with 5–10 ml/100g/min can be heated effectively up to 42–43 °C.
In the case of the asymmetric setup (25–15 cm), the SAR distribution is concentrated at the smaller electrode (15 cm diameter), and the opposite tissue is spared according to and . Such an arrangement is especially suitable for tumor diseases of superficial and intermediate depths. The measured SAR profiles and distributions for the homogeneous phantom are in agreement with positive studies in the head & neck area [Citation4,Citation5].
To better understand positive studies in the pelvic region upon cervical cancer [Citation6,Citation7,Citation27,Citation28] and rectal cancer [Citation29], we performed measurements with an inhomogeneous phantom inserting a fat layer of 1 cm thickness ( and ). Fat layers are known to severely limit the SAR and achieved temperatures in deeper regions [Citation11]. We measured a reduction down to 20 W/kg in 3–6 cm depth (including the fat layer) and then further down to 10 W/kg (). Therefore the absolute SAR reduction in the depth is about 10 W/kg (or 50%) in comparison to the homogeneous phantom without a fat layer. Therefore, slim patients with fat layers < 1–2 cm (Asian habitus) and/or higher total power are needed to achieve an effective SAR > 30 W/kg in the central part of the pelvis. This is in fact, reported for the studies of Harima [Citation6,Citation7], which applied rather high total powers of 800–1500 W with larger electrodes (25–30 cm). No information about the BMI (body mass index) of the patients is reported, but patients with fat layers of ≥4 cm were excluded.
Our simulations () suggest that our measurements might characterize an unfavorable case that is not representative for the clinical situation. If we assume a well-perfused and vital fat layer with higher εr and σ according to , we achieve higher SAR around 40 W/kg in the center, instead of only 10–20 W/kg. Therefore, we must consider a significant variability for heating the pelvis by the capacitive technique that depends particularly on the dielectric properties of the tissues.
We also analyzed the SAR distributions with high SAR >100 W/kg at the edges of the electrodes. The largest superficially located volumes of approximately 40 ml with >100 W/kg and 300 ml with SAR >50 W/kg are exposed for the asymmetrical setup at the smaller bottom electrode. The estimated temperatures turned out to remain thermally uncritical, if the cooling effects of a (reactive) perfusion of 20–30 ml/100g/min and the water bolus (20 °C) are assumed (). However, there is a risk in scars if sensitivity and thermal regulation are reduced.
We note that the exposed volumes with SAR > 100 W/kg for the other setups (see ) are below 15–25 ml and even less critical. Furthermore, our analysis is based on the assumption that 100% of total power (200 W) is deposited in the phantom. Therefore, some overestimation of the simulated absolute SAR values in comparison to the real experiments/treatments is to be expected due to aberrant losses. Our estimations go hand in hand with the clinical experiences that treatment limiting hot spots or even burns at the applicator edge are rarely observed, if water bolus and water pillows are positioned appropriately between electrodes and patient and the patient is carefully observed.
Our phantom data are not able, however, to explain the (positive) studies of Minnaar et al. [Citation27,Citation28] and Kim et al. [Citation29], where a low total power of 130–140 W was applied with a large electrode (30 cm) for the capacitive system EHY2000+. In addition, the indicated mean BMI of 27.8 in the hyperthermia group [Citation28] shows that these are not exactly very slim patients, and no exclusion criterion for patients with large BMI was formulated. We estimate SAR ≤ 10–20 W/kg for these patients that is usually not considered sufficient for effective heating. Therefore, the positive outcome of these two studies is difficult to understand with the rules formulated in the common guidelines for hyperthermia [but see, e.g. [Citation30],].
Abdominal hyperthermia is a special, large-volume form of application for which there is an urgent oncological indication for gastrointestinal and ovarian carcinoma. For this application is, according to the current state of knowledge, only the annular-phased-array technique suitable [Citation31].
A phantom setup with an integrated bone (thigh) was fabricated ( and ) and measured () to clarify the interesting study of Chi et al. 2018 [Citation32], where the effectiveness of standard radiotherapy of bone metastases was enhanced by the capacitive heating system Thermotron RF-8. Our direct SAR measurements show the typical decline from the upper electrode to the bone, and inside the cancellous bone, a rather low SAR of 5–10 W/kg (). The range of dielectric properties of cortical and cancellous bone are listed in , reflecting the uncertainty about these values in the literature [Citation22,Citation24]. For our phantom, we assumed an avital bovine thigh bone with low permittivities and conductivities according to . In a vital bone, we expect higher εr and σ. The dielectric constants might even approach εr and σ of a tumor, i.e., εr = 80 and σ = 0.8 S/m in malignant bone lesions. Our additional simulations in for larger εr and σ show that bone metastases can be heated by the capacitive technique, if they are in intermediate depth and have suitable dielectric properties, which are especially expected for tumor lesions. Therefore, the results of Chi et al. [Citation32] are comprehensible with our measurements and simulations, at least for low perfused bone lesions.
Our simulations based on the simplified model of predict distinctly higher SAR with increasing distance from the normalization point than we found in our measurements. In the center of the phantom, the simulations based on this model calculate roughly double the SAR for the homogeneous phantom with or without fat layer ( and ). We identified two major reasons.
First, we have a relevant asymmetry in the phantom setup, because the counter electrode is integrated in the table, causing an effective enlargement of the electrode. This effectively enlarged counter electrode causes a weakening in the center and on the table-side. We considered the asymmetry by selecting a larger counter electrode table-side in (selecting 17–20 cm instead of 15 cm), which improves the agreement.
Such arrangements in simulation models could considerably improve the agreement, but nevertheless, simulations predict larger SAR in the depth than we measured.
Second, we can assume various factors that cause a reduction of the measured SAR in comparison to the ideal simulations. Interfaces between the electrodes and integrated water boluses as well as between the water boluses and the phantoms, can influence the results. The water bolus of electrodes are implemented in the simulations as perfectly flat planes without additional material encasing the water bolus. It is known that in reality, such interfaces worsen the coupling and lead to a reduction of the power input, even if their thickness is in the mm-range or below. In addition, the catheter array (see ) creates inhomogeneities and weakens the electric field, which was not modeled in the simulations. Finally, the measuring method of the SAR (see methods) can lead to an underestimation of the SAR, in particular, if the SAR is small and the thermal gradients become relatively high (at the end of the measuring interval).
Such details must be resolved for patient-specific planning, which has not been established yet – neither for such simple phantom setups, and certainly not for complex patient cases. However, the software package Sim4Life (ZurichMedTech) is a promising basis for the development and refinement of hyperthermia treatment planning tools for capacitive devices.
The limitations of our study are the limited number of phantom setups with simplified arrangements and measurements, which turned out to be very time-consuming. Therefore, the clinical indications were derived indirectly from the phantom measurements with the help of additional simulation studies. Nevertheless, we were able to comprehensibly describe the accessibility of various tumor entities in accordance with the outcome of the clinical studies for the capacitive technology [Citation4–7,Citation32]. Questions remain only for two studies [Citation27–29] that will be treated later.
Conclusions
Systematic SAR measurements compared with simulations are sparse for CHS. Our phantom measurements indicate sufficient SAR deposition in superficial and intermediate deep-seated areas. For slim patients and/or application of sufficiently high total power also the pelvic or abdominal region is feasible. This finding is in line with the promising oncological results of several studies using CHS for hyperthermia in oncological therapies. Simulations of the phantom setups with Sim4Life could adequately describe the measurements and can be further developed to a patient-specific planning tool.
Disclosure statement
PG received advisory fees from Celsius42 GmbH. The other authors report no conflicts of interest. The authors alone are responsible for the content and writing of the article.
Additional information
Funding
References
- Wust P, Hildebrandt B, Sreenivasa G, et al. Hyperthermia in combined treatment of cancer. Lancet Oncol. 2002;3(8):487–497.
- Issels RD, Lindner LH, Verweij J, European Organization for the Research and Treatment of Cancer-Soft Tissue and Bone Sarcoma Group and the European Society for Hyperthermic Oncology, et al. Effect of neoadjuvant chemotherapy plus regional hyperthermia on long-term outcomes among patients with localized High-Risk soft tissue sarcoma: the EORTC 62961-ESHO 95 randomized clinical trial. JAMA Oncol. 2018;4(4):483–492.
- van der Zee J, Gonzalez Gonzalez D, van Rhoon GC, et al. Comparison of radiotherapy alone with radiotherapy plus hyperthermia in locally advanced pelvic tumours: a prospective, randomised, multicentre trial. Dutch deep hyperthermia group. Lancet. 2000;355(9210):1119–1125.
- Datta NR, Bose AK, Kapoor HK, et al. Head and neck cancers: results of thermoradiotherapy versus radiotherapy. Int J Hyperthermia. 1990;6(3):479–486.
- Huilgol NG, Gupta S, Sridhar CR. Hyperthermia with radiation in the treatment of locally advanced head and neck cancer: a report of randomized trial. J Can Res Ther. 2010;6(4):492–496.
- Harima Y, Nagata K, Harima K, et al. A randomized clinical trial of radiation therapy versus thermoradiotherapy in stage IIIB cervical carcinoma. Int J Hyperthermia. 2009;25(5):338–343.
- Harima Y, Ohguri T, Imada H, et al. A multicentre randomised clinical trial of chemoradiotherapy plus hyperthermia versus chemoradiotherapy alone in patients with locally advanced cervical cancer. Int J Hyperthermia. 2016;32(7):801–808.
- Kikuchi M, Amemiya Y, Egawa S, et al. Guide to the use of hyperthermic equipment. 1. Capacitively-coupled heating. Int J Hyperthermia. 1993;9(2):187–203.
- Wust P, Weihrauch M. Hyperthermia classic commentary: 'Simulation studies promote technological development of radiofrequency phased array hyperthermia' by peter wust et al., international journal of hyperthermia 1996;12:477-494. Int J Hyperthermia. 2009;25(7):529–532.
- Kato H, Hiraoka M, Nakajima T, et al. Deep-heating characteristics of an RF capacitive heating device. Int J Hyperthermia. 1985;1(1):15–28.
- Hiraoka M, Jo S, Akuta K, et al. Radiofrequency capacitive hyperthermia for deep-seated tumors. I. Studies on thermometry. Cancer. 1987;60(1):121–127.
- van Rhoon GC, van der Zee J, Broekmeyer-Reurink MP, et al. Radiofrequency capacitive heating of deep-seated tumours using pre-cooling of the subcutaneous tissues: results on thermometry in dutch patients. Int J Hyperthermia. 1992;8(6):843–854.
- Kroeze H, van de Kamer JB, de Leeuw AA, et al. Treatment planning for capacitive regional hyperthermia. Int J Hyperthermia. 2003;19(1):58–73.
- D'Ambrosio V, Dughiero F. Numerical model for RF capacitive regional deep hyperthermia in pelvic tumors. Med Biol Eng Comput. 2007;45(5):459–466.
- Sahinbas H, Rosch M, Demiray M. Temperature measurements in a capacitive system of deep loco-regional hyperthermia. Electromagn Biol Med. 2017;36(3):248–258.
- Dobsicek Trefna H, Crezee J, Schmidt M, et al. Quality assurance guidelines for superficial hyperthermia clinical trials: II. Technical requirements for heating devices. Strahlenther Onkol. 2017;193(5):351–366.
- Stuchly MA, Stuchly SS. Coaxial line reflection methods for measuring dielectric properties of biological substances at radio and microwave frequencies-A review. IEEE Trans Instrum Meas. 1980;29(3):176–176-83.
- Gardiol FE. Open-ended waveguides: principles and applications. Adv Electron Electron Phys. 1985;63:139–187.
- Pournaropoulos CL, Misra D. The coaxial aperture electromagnetic sensor and its application in material characterization. Meas Sci Technol. 1997;8(11):1191–1202.
- Wust P, Cho CH, Hildebrandt B, et al. Thermal monitoring: invasive, minimal-invasive and non-invasive approaches. Int J Hyperthermia. 2006;22(3):255–262.
- Wust P, Stahl H, Loffel J, et al. Clinical, physiological and anatomical determinants for radiofrequency hyperthermia. Int J Hyperthermia. 1995;11(2):151–167.
- Gabriel C, Gabriel S, Corthout E. The dielectric properties of biological tissues: I. Literature survey. Phys Med Biol. 1996;41(11):2231–2249.
- Klauenberg BJ, Miklavčič D. Radio frequency radiation dosimetry and its relationship to the biological effects of electromagnetic fields. Dordrecht, Netherlands: Springer; 2000.
- Gabriel C. Compilation of the dielectric properties of body tissues at RF and microwave frequencies. Occupational and Environmental Health Directorate, Radiofrequency Radiation Division, Brooks AFB TX, Technical Report AL/OE-TR-1996-0037. 1996.
- Lagendijk JJ, Van Rhoon GC, Hornsleth SN, et al. ESHO quality assurance guidelines for regional hyperthermia. Int J Hyperthermia. 1998;14(2):125–133.
- Wust P. Thermotherapy in Oncology: UNI-MED Verlag AG; 2016.
- Minnaar CA, Kotzen JA, Ayeni OA, et al. The effect of modulated electro-hyperthermia on local disease control in HIV-positive and -negative cervical cancer women in South Africa: Early results from a phase III randomised controlled trial. PLoS One. 2019;14(6):e0217894.
- Minnaar CA, Kotzen JA, Naidoo T, et al. Analysis of the effects of mEHT on the treatment-related toxicity and quality of life of HIV-positive cervical cancer patients. Int J Hyperthermia. 2020;37(1):263–272.
- Kim S, Lee JH, Cha J, et al. Beneficial effects of modulated electro-hyperthermia during neoadjuvant treatment for locally advanced rectal cancer. Int J Hyperthermia. 2021;38(1):144–151.
- Wust P, Stein U, Ghadjar P. Non-thermal membrane effects of electromagnetic fields and therapeutic applications in oncology. Int J Hyperthermia. 2021;38(1):715–731.
- Kok HP, Beck M, Loke DR, et al. Locoregional peritoneal hyperthermia to enhance the effectiveness of chemotherapy in patients with peritoneal carcinomatosis: a simulation study comparing different locoregional heating systems. Int J Hyperthermia. 2020;37(1):76–88.
- Chi MS, Yang KL, Chang YC, et al. Comparing the effectiveness of combined external beam radiation and hyperthermia versus external beam radiation alone in treating patients with painful bony metastases: a phase 3 prospective, randomized, controlled trial. Int J Radiat Oncol Biol Phys. 2018;100(1):78–87.