
Abstract
Objective
This study investigated the effect of various histotripsy dosages on tumor cell kill and associated bleeding in two murine brain tumor models (glioma [Gl261] and lung metastasis [LL/2-Luc2]).
Methods and materials
GL261 or LL/2-Luc2 cells were cultured and implanted into the brains of C57BL/6 mice. Histotripsy (1-cycle pulses, 5 Hz PRF, 30 MPa-P) was performed using a 1 MHz transducer for five different dosages for each cell line: 5, 20 or 200 pulses per location (PPL) at a single treatment point, or 5 or 10–20 PPL at multiple treatment points. MRI, bioluminescence imaging and histology were used to assess tumor ablation and treatment effects within 4–6 h post-treatment.
Results
All treatment groups resulted in a reduction of BLI intensity for the LL/2-Luc2 tumors, with significant signal reductions for the multi-point groups. The average pre-/post-treatment BLI flux (photons/s, ×108) for the different treatment groups were: 4.39/2.19 (5 PPL single-point), 5.49/1.80 (20 PPL single-point), 3.86/1.73 (200 PPL single-point), 2.44/1.11 (5 PPL multi-point) and 5.85/0.80 (10 PPL multi-point). MRI and H&E staining showed increased tumor damage and hemorrhagic effects with increasing histotripsy dose for both GL261 and LL/2-Luc2 tumors, but the increase in tumor damage was diminished beyond 10–20 PPL for single-point treatments and outweighed by increased hemorrhage. In general, hemorrhage was confined to be within 1 mm of the treatment boundary for all groups.
Conclusions
Our results suggest that a lower number of histotripsy pulses at fewer focal locations can achieve substantial tumor kill while minimizing hemorrhage.
1. Introduction
Brain tumors are one of the most common forms of cancer in the US, with an incidence rate of approximately 131 per 100,000 people [Citation1]. Glioblastoma (GBM) is one of the most aggressive forms of primary brain cancer, with a median survival time of 6–12 months after diagnosis [Citation2]. In addition, the incidence rate of brain metastases is much higher than that of primary brain tumors [Citation3]. Of all brain metastases, lung cancer accounts for approximately 20% of all such cases [Citation3,Citation4]. The current standard-of-care (SOC) treatment for primary and metastatic brain tumors is craniotomy-based surgical resection, which is a highly invasive surgery that creates surgical trauma and retraction-based injury to the surrounding cerebral parenchyma [Citation5]. Radiation therapy has significant limitations due to the safety limit of the cumulative radiation dose, lack of effectiveness, latency to tumor death, lack of immediate tumor cell kill and risk of radiation-induced edema and necrosis, especially in children [Citation6,Citation7]. Additionally, drug-based chemotherapeutics have shown limited effect due to the impermeability and heterogeneity of the blood-brain barrier, particularly at the borders of the tumor [Citation8,Citation9]. Currently, there is no technology that leads to immediate tumor kill without requiring the penetration of intervening brain tissue. Histotripsy bridges this clinical gap with a methodology of tumor treatment and liquefaction which leads to tumor kill, obviating the need for damaging the intervening brain tissue.
Transcranial MR-guided focused ultrasound (tcMRgFUS) has been investigated for noninvasive treatment of brain tumors [Citation10,Citation11] and has gained interest in the clinical field due to its ability to thermally ablate brain tissue through an intact skull with MRI guidance. tcMRgFUS has been FDA-approved for the treatment of essential tremors [Citation12–14] and tremor-dominant Parkinson’s Disease [Citation15,Citation16]. However, despite clinical advances, tcMRgFUS is limited to deep-brain targets (>2 cm from the skull surface) due to the risk of skull overheating [Citation17–19]. This greatly reduces the percentage of brain tumors that tcMRgFUS can treat, as most malignant gliomas occur in the untreatable part of the cortex within 2 cm from the skull surface [Citation20]. Additionally, the treatment time with tcMRgFUS for large tumors is long to avoid off-target thermal absorption by surrounding tissue. This may make large tumors impractical to treat with tcMRgFUS.
More recently, transcranial histotripsy has been investigated for noninvasive brain tumor treatment. Histotripsy is a noninvasive focused ultrasound technique that uses short, high-intensity ultrasound pulses to mechanically ablate surrounding tissue via cavitation [Citation21,Citation22]. By using microsecond-length pulses and a very low duty cycle (<0.1%), transcranial histotripsy can minimize skull heating to greatly expand the number of potential treatment locations and volumes in the brain [Citation23]. Histotripsy has recently been shown to effectively ablate in vivo murine [Citation24] and porcine [Citation11] brain tissue through intact skulls. As a noninvasive surgical technique, histotripsy has the potential to safely and effectively remove tumor burden to achieve survival benefit demonstrated by complete surgical resection [Citation25–28] without the risk of surgical trauma. Therefore, this study aimed to investigate the effect of various levels of histotripsy dose on tumor cell kill and associated bleeding in two murine brain tumor models (GBM (GL261) and lung metastasis (LL/2-Luc2)).
The GL261 tumor model is a widely used orthotopic, immunocompetent murine glioma model for immune and other brain cancer studies. The LL/2-Luc2 cell line is a widely used lung metastasis model for studying metastatic cancer. Both models require direct tumor implantation into the brain, have rapid tumor growth and are hypervascular. A low-frequency (1 MHz) histotripsy transducer was used to preserve the dynamics and size of the cavitation cloud generated and associated histotripsy parameters compared to those of the human system (700 kHz), so that translation to larger animal models and future clinical applications can be simplified. One-cycle ultrasound pulses with a pressure 5–10% above the intrinsic threshold (i.e., microtripsy) [Citation29] were used to maximize the treatment accuracy. Post-treatment tumor damage and associated bleeding and edema were evaluated with MRI, bioluminescence imaging and acute histology.
2. Materials and methods
2.1. Animals
All animal protocols were approved by the University of Michigan Institutional Animal Care Use Committee (IACUC). Thirty-nine female C57BL/6 (Jackson Labs; ∼20 g) were used for this study. GL261 or luciferase-expressing LL/2-Luc2 cells (ATCC) were grown in Dulbecco’s Modified Eagle Medium (DMEM, Gibco) supplemented with 10% fetal bovine serum and 1% Pen-strep and incubated in a 5% CO2 chamber held at 37 °C. Media was changed every 2–5 days to maintain linear cell growth. On the day of tumor implantations, 100,000 cells were suspended in 1 µl plain DMEM and kept on ice until implants.
Tumor implantation protocols were the same for both GL261 and LL/2-Luc2 cells. Mice were initially anesthetized with 5% isoflurane and 1% oxygen and maintained at 2% isoflurane and 1% oxygen for the remainder of the procedure. After fur removal and skin sterilization, a 1 cm anterior–posterior incision was cut and a small area of periosteum was removed to expose the skull. A 1 mm burr hole was drilled into the skull approximately 2 mm lateral and 1 mm posterior to the bregma in the right brain hemisphere. A stereotactic rodent brain injection system was used for tumor implantations. The syringe and needle system (10 µl, Hamilton) was positioned 4 mm deep relative to the brain surface and was extracted 0.5 mm to create a pocket for the cell injection. 0.5 µl of the cell suspension was injected over 1 min and the needle was extracted slightly. The rest of the cell suspension (0.5 µl) was injected over 1 min and the needle was extracted from the brain 7 min later in 0.5 mm increments until the needle cleared the surface of the brain. The injection site was plugged with bone wax and the incision was secured with skin glue. Mice were administered carprofen (5 mg/kg SQ) and placed in a recovery chamber for 20 min following the procedure.
2.2. Tumor monitoring
Tumor growth was monitored on the day before histotripsy treatment to ensure adequate tumor growth via a small animal 7 T MRI scanner (Varian, Inc., Palo Alto, CA, USA) using T1-weighted gadolinium-enhanced scans (TR/TE = 500/8 ms, flip angle = 90°/180°, slice thickness = 1 mm, FOV = 25.6 × 25.6 mm, matrix size = 128 × 128, scan time = 4 min) (data not shown). Mice with GL261 tumors (n = 20) were treated 10–15 days after implantations (tumor volume = 3.80 ± 2.58 mm3). Mice with LL/2-Luc/2 tumors (n = 19) were treated 6–9 days after implantations due to the faster growth of these tumors (tumor volume = 4.38 ± 1.55 mm3).
Mice with LL/2-Luc2 tumors underwent pre- and post-treatment bioluminescence imaging (BLI) with an in vivo imaging system (IVIS Lumina, Perkin Elmer) before and after treatment to confirm tumor growth and quantitatively assess treatment efficacy. D-luciferin (Perkin Elmer, emission wavelength = 562 nm) at 150 mg/kg was delivered to the mice via I.P. injection approximately 10 min prior to imaging. Total flux (p/s) was calculated in Living Image Software (Perkin Elmer) from a square ROI drawn around the tumor region of each mouse. GL261 tumors were not assessed with BLI due to low signals at the time of treatment (<600 counts).
2.3. Histotripsy treatment
Histotripsy treatment was performed using a custom-built 1 MHz, 8-element transducer with a focal distance of 32.5 mm and an aperture of 54 mm (f # = 0.6). Histotripsy treatment consisted of 1-cycle pulses at a peak negative pressure of ∼30 MPa and pulse repetition frequency (PRF) of 5 Hz. Mice (n = 40) were randomly assigned to five treatment groups within each cell type: single-point or multi-point treatments with 5 or 20 pulses per focal location (PPL) (n = 4 per group), and single-point overdose treatments with 200 PPL (n = 4 per group) (). Focal locations refer to the position of the transducer focus during treatment. The number of pulses and focal locations was varied, as the tumor kill and associated bleeding were expected to vary with different PPL and targeted treatment volumes. 5, 20 and 200 PPL were chosen for the single-point treatments to achieve low, intermediate and high histotripsy dosages. Two hundred PPL was excluded from the multi-point treatment groups due to the concerns of excessive bleeding at high overdose. Similarly, 10 PPL instead of 20 PPL was chosen for the higher multi-point dosage for the LL/2-Luc2 tumors due to the concerns for excessive bleeding as these tumors are highly vascular.
Table 1. Histotripsy treatment groups.
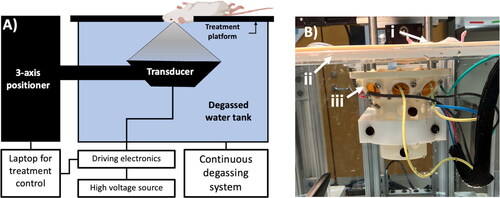
On the day of treatment, mice underwent pre-treatment MRI to obtain T2-weighted MRI scans for treatment planning. Mice were then placed on a treatment platform secured at the top of a warm degassed water tank (% dissolved oxygen <10%) such that only the shaved head was submerged in water (). The transducer was attached to a three-axis motor positioner controlled by a custom-written MATLAB (Natick, MA, USA) script and targeted the tumor via a stereotactic targeting system as described by Choi et al. [Citation30]. Single-point treatments consisted of one focal location in the center of the tumor. Multi-point treatments consisted of 7–18 focal locations, starting in the center of the tumor and spiralling outwards with 0.25 mm between each location for a total of 54–140 total pulses. The entire tumor area of the target slice was targeted; therefore, the total number of focal locations for the multi-point treatments depended on the size of the tumor. Following histotripsy, mice underwent post-treatment MRI to assess targeting accuracy and acute effects.
Figure 1. (A) Schematic and (B) Photo of the experimental setup. The anesthetized mouse (i) was placed on the treatment platform (ii) which was secured to the degassed water tank such that only the mouse head was submerged in the water. The tank was continuously degassed throughout the experiment with a degassing system comprising a vacuum pump and membrane filter. The eight-element transducer (iii) was aligned with the center of the tumor via a three-axis motor positioning system, which was controlled by MATLAB. The transducer driving electronics were powered by a high-voltage source.
2.4. Histology
All animals were euthanized via CO2 asphyxiation within 4–6 h post-treatment. The skull was partially opened along the midline and the brain and skull were submerged in 10% formalin for 24–48 h. Fixed brains were then extracted from the skull, embedded in paraffin blocks and cut into 6 µm sections parallel to the direction of ultrasound propagation. Tissue embedding and H&E staining were completed at the University of Michigan Tissue & Molecular Pathology Shared Resource core (iLab, University of Michigan, Ann Arbor, MI, USA). Residual tumor and ablation regions were measured from H&E images in MATLAB by manually drawing masks around each region of interest. The ablation area was divided by the ablation area + residual tumor area and multiplied by 100 to calculate the percentage of tumor ablated. The H&E slice that depicted the largest area of tumor and ablation was used for these measurements as well as for measuring the distance between any ischemic neurons and the boundary of the treatment region. All histology measurements were done in MATLAB and verified by a board-certified pathologist (SP).
2.5. MRI
Tumor and ablation volumes were measured from pre- and post-treatment T2-weighted MRI images using MATLAB (TR/TE = 2000/45 ms, flip angle = 90°/180°, slice thickness = 1 mm, FOV = 25.6 × 25.6 mm, Matrix size = 128 × 128, scan time = 4 min). Manual masks were drawn around the region of interest on each slice. The mean area was multiplied by the number of slices and slice thickness to calculate the total volume.
2.6. Statistics
An unpaired t-test with Welch’s correction was used to compare the post-treatment tumor ablation volumes and areas between cell lines for both MRI T2-weighted images and H&E images, respectively. One-way ANOVA tests and pair-wise comparisons were used to compare ablation volumes and areas between treatment groups. The normality of data was tested with the Shapiro–Wilk test. Paired two-tailed t-tests were used to compare pre-and post-treatment BLI data. A p-value of <.05 was used to determine significance. All statistical analyses were performed using Prism 9 (GraphPad).
3. Results
3.1. Tumor ablation
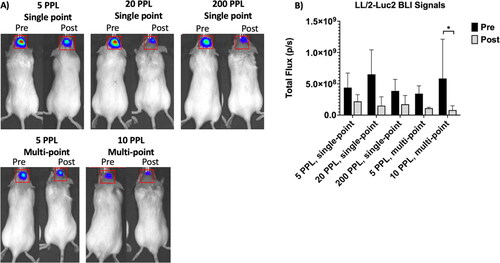
Overall, the average BLI flux decreased by approximately a factor of two following histotripsy ablation for all parameters tested (). The average percent reduction in BLI flux was 44.7 ± 21.2%, 78.1 ± 20.4% and 54.3 ± 24.5% for single-point 5 PPL (5 pulses), 20 PPL (20 pulses) and single-point 200 PPL (200 pulses) respectively, compared to 54.0 ± 14.4% and 68.9 ± 25.1% for multi-point 5 PPL (total 55–75 pulses) and 10 PPL (total 100–210 pulses), respectively. The multi-point 10 PPL group resulted in significantly reduced post-treatment BLI signals compared to pre-treatment (p = .02), while the other groups trended toward reduced signals post-treatment (p = .20, .10, .15 and .33 for single-point 5 PPL, single-point 20 PPL, single-point 200 PPL and multi-point 5 PPL, respectively). The percent change in BLI signal was not significantly different between treatment groups (p > .05). Due to mistargeting, 2 out of 40 mice underwent an additional round of histotripsy treatment on the same day with the same treatment parameters. No observable complications in acute appearance or behavior were observed in any mice after histotripsy treatment.
Figure 2. Representative pre- and post-treatment BLI images for all (A) Treatment groups and (B) pre- and post-treatment flux (p/s) for all treatment groups. BLI signals were reduced after histotripsy treatment for all treatment levels, with a significant reduction in the 10 PPL multi-point treatment group.
Tumor ablation was assessed histologically with H&E staining for both GL261 glioma and LL/2-Luc2 lung metastasis (). For all treatment groups, bleeding was observed but confined to within or near the treatment region (<1 mm from the treatment boundary) in H&E histology. H&E showed a general trend in increased percentage tumor ablation with increased dose for GL261 treatment groups as follows: 28.5 ± 7.82% (single-point 5 PPL, 5 pulses), 52.0 ± 5.74% (single-point 20 PPL, 20 pulses), 40.7 ± 10.48% (single-point 200 PPL, 200 pulses), 41.7 ± 9.16% (multi-point 5 PPL, 40–90 pulses) and 93.4 ± 10.5% (multi-point 20 PPL, 140–240 pulses), although the increase was small when greater than a total of 20 pulses was delivered. Percent tumor ablation was not significantly different between cell lines for the same treatment parameter group (p > .05). For GL261 tumors, multi-point 20 PPL (140–240 total pulses) resulted in significantly more percent tumor ablation as measured from histology compared to all other treatment groups (p = .002). There was no significant difference in the percent tumor ablation between all other treatment groups.
Figure 3. Proportion of tumor ablation (A) and residual tumor (T) at different dosages for GL261 (top) and LL/2-Luc2 (bottom) tumors. Tumor ablation generally increased with increasing dose (total number of histotripsy pulses applied) for both cell lines. All scale bars = 1 mm.
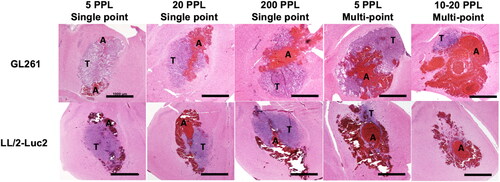
For LL/2-Luc2 tumors, H&E showed a general trend in increased percentage tumor ablation with increased dose for LL/2-Luc2 treatment groups: 46.4 ± 7.11% (single-point 5 PPL, 5 pulses), 59.1 ± 9.04% (single-point 20 PPL, 20 pulses), 57.6 ± 14.6% (single-point 200 PPL, 200 pulses), 64.1 ± 5.56% (multi-point 5 PPL, 55–75 pulses) and 68.1 ± 1.52% (multi-point 10 PPL, 100–210 pulses), although the increase was small when greater than a total of 20 pulses was delivered (). The multi-point 10 PPL, 100–210 total pulses resulted in significantly more tumor ablation than single-point 5 pulses (p = .03). There was no significant difference in the percent tumor ablation between all other treatment groups.
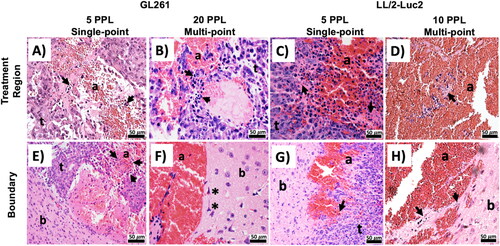
For both the low (e.g., single-point 5 pulses) and high (e.g., multi-point 20 PPL, 140–240 pulses) doses for GL261 tumors, tumor ablation was shown by areas of fractionated and apoptotic nuclei surrounded by red blood cells, which contrasted with the viable mitotic tumor cells in the surrounding untreated regions (). The tumor ablation region was well confined for the low levels of treatment dose (single-point 5 PPL and 20 PPL). At the treatment boundary, there were defined regions of ablated, tumor and normal brain tissue (). For high levels of treatment dose (single-point 200 PPL and multi-point 10–20 PPL), some ischemic neurons were found within 50–100 μm of the observed treatment boundary in H&E stained slides (). Similar patterns of tumor ablation were seen with the LL/2-Luc2 tumors.
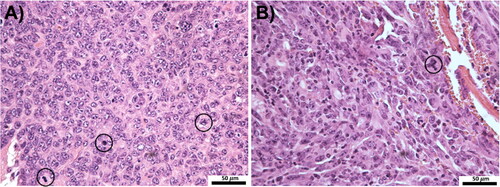
Figure 4. GL261 and LL/2-Luc2 tumor ablation at the (A–D) treatment region and (E–H) boundary for low (5 PPL, single-point) and high (10–20 PPL, multi-point) dosages. Both dosages for both cell lines showed fractionated and apoptotic tumor nuclei (arrows) surrounded by red blood cells at the ablation (a) regions with viable nuclei in the untreated tumor (t) regions. Surrounding brain (b) is for the most part unremarkable; high dosages show occasional ischemic neurons immediately adjacent to the tumor (asterisks).
Untreated control GL261 and LL/2-luc2 tumors showed solid, dense cellular growth with no evidence of spontaneous tumor hemorrhage or necrosis (). Both tumors had large, atypical nuclei with prominent mitotic activity, consistent with high-grade malignant neoplasms. GL261 tumors tended to grow in a more circumscribed pattern after tumor implantation, while LL/2-Luc2 tumors showed more aggressive growth with infiltrating tumor cells surrounding the perivascular spaces and infiltrating adjacent parenchyma.
Figure 5. (A) H&E staining (40×) for untreated GL261 and (B) LL/2-Luc2 tumors. Both tumors show solid, dense, hypercellular growth with large, atypical nuclei and prominent mitotic activity (circles). GL261 tumors tend to grow in more circumscribed pattern, while LL/2-Luc2 tumors show more aggressive growth with tumor islands infiltrating surrounding parenchyma and perivascular spaces.
3.2. Treatment associated cerebral tissue injuries
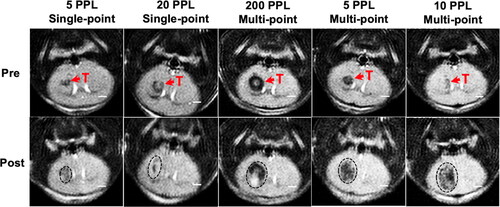
Hemorrhage associated with histotripsy tumor ablation was assessed for each treatment group with T2-weighted MRI. For GL261 tumors, the pre-treatment tumor was depicted as a hyperintense zone while the post-treatment region appeared as a hypointense region surrounding a hyperintense core (). For LL/2-luc2 tumors, the tumor appeared as a hypointense zone on T2-weighted images before treatment (). Histotripsy ablation region on post-treatment T2-weighted MRI was depicted by a larger hypointense region compared to the initial hypointense region of the initial tumor ( and ). The hypo-intensity of the pre-treatment tumor was thought to be due to the high vascularity of the LL/2-Luc2 tumors, as demonstrated on histology to contain more densely packed cells and have more red blood cells (), making the residual tumor difficult to distinguish from the histotripsy treatment region on MRI.
Figure 6. Representative pre- and post-treatment T2-weight MRI for GL261 tumors. Each column represents one mouse. The tumor (T) is represented by a hyperintense region in the pre- and post-treatment images, and the ablation zone (black outline) is represented by a hypointense region with a hyperintense core in the post-treatment images. The ablation volume increased with increasing dosage. All scale bars = 2 mm.
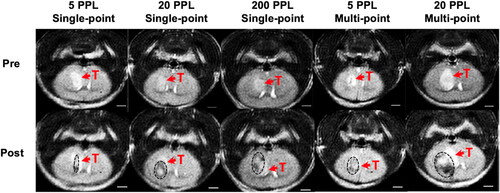
Figure 7. Representative pre- and post-treatment T2-weight MRI for LL/2-luc2 tumors. Each column represents one mouse. The tumor (T) is represented by a hypointense region in the pre-treatment images, and the ablation zone (black outline) is represented by a larger hypointense region in the post-treatment images. Ablation regions increased with dosage. All scale bars = 2 mm.
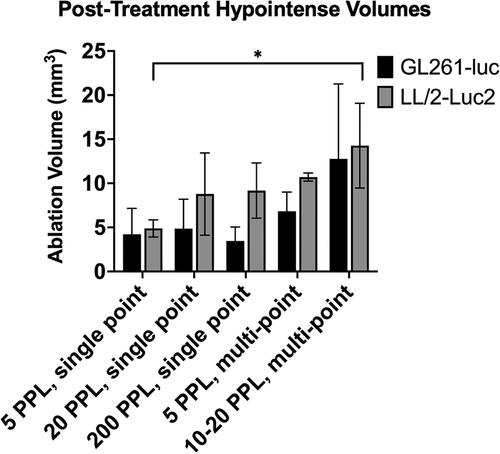
Post-treatment hypointense volumes were measured from T2-weighted MRI for both tumor types to assess the bleeding levels associated with histotripsy (). Treatments of GL261 tumors resulted in 4.22 ± 2.95, 4.86 ± 3.33, 3.47 ± 1.58, 6.83 ± 2.17 and 12.77 ± 8.51 mm3 post-treatment hypointense volumes for single-point 5 pulses, single-point 20 pulses, single-point 200 pulses, multi-point 5 PPL (40–90) pulses and multi-point 20 PPL (140–240) pulses, respectively. Treatments of LL/2-luc2 tumors resulted in 4.89 ± 0.98, 8.78 ± 4.66, 9.17 ± 3.13, 10.71 ± 0.47 and 14.28 ± 4.80 mm3 post-treatment hypointense volumes for single-point 5 pulses, single-point 20 pulses, single-point 200 pulses, multi-point 5 PPL (55–75 pulses) and multi-point 10 PPL (100–210 pulses), respectively. Both cell lines trended toward higher hypointense volumes with an increasing number of total pulses delivered to the tumor region, with a significant increase between single-point 5 pulses and multi-point 5 PPL (55–75) pulses for the LL/2-luc2 tumors (p = .022).
Figure 8. Post-treatment hypointense volumes measured from T2-weighted MRI. Hypointense volumes generally increased with increasing dosage for both cell lines, with a significant increase between single-point 5 PPL treatment and multi-point 10 PPL treatment for LL/2-Luc2 tumors.
4. Discussion
This study was the first to investigate the effect of the number of pulses and number of focal locations on transcranial tumor ablation in primary and metastatic murine brain tumor models. In this study, treatments with a lower number of total pulses (10–20) were effective at killing substantial tumor cells (40–80% BLI reduction and >50% percentage tumor ablation) while minimizing surrounding bleeding and cellular injury. A higher number of pulses (>50 total pulses) for both cell lines resulted in substantially larger amounts of hemorrhage without proportionally increased tumor kill. Additionally, single-point high-dose treatments (200 pulses) did not result in significantly higher tumor cell kill than single-point treatments with 5 or 20 pulses or multi-point treatments with lower PPL. This suggests that for larger tumors, a treatment regime of multiple focal locations with a low to intermediate histotripsy dosage for each location and small spacing is more effective than one single-point treatment with a very high dose.
In the present study, a combination of the small animal model and highly vascular tumors may have exacerbated the effect of hemorrhage due to histotripsy treatment. Transcranial histotripsy treatment has been safely delivered to normal brains in larger healthy animal models (i.e., pigs) without extensive bleeding, even with the administration of anticoagulants [Citation11,Citation31]. Histotripsy has been also used in treating porcine liver, kidney and prostate administered with anticoagulant without causing extensive bleeding [Citation32–34]. Additionally, recent work in our lab has shown that histotripsy treatment in normal murine brains leads to minor localized bleeding that resolves within the first 7 days.
In this study, it was necessary to quantify post-treatment success differently between the GL261 and LL/2-Luc2 tumors. While GL261 glioma tumors appear as hyperintense on T2-weighted MRI, LLC lung metastases are hypointense on MRI. As a result, the hypointense histotripsy ablation can be easily visualized and separated from the residual GL261 tumor on T2-weighted MRI, but the hypointense histotripsy ablation cannot be distinguished from the hypointense LL/2-Luc2 tumor on post-treatment T2-weighted MRI. The hyperintense core that was observed in the center of the histotripsy treatment region was likely due to red blood cells being disrupted by histotripsy in the ablation center, resulting in an extracellular diluted density of iron products and therefore a relatively prolonged T2* relaxation [Citation24,Citation35]. As erythrolysis takes place, the iron within the blood loses its ability to causes susceptibility which causes the low signal on T2 weighted sequences. The hyperintense core of red blood cells disrupted by histotripsy has been confirmed with histology by Choi et al. [Citation23]. Multiple MRI sequences [e.g., dynamic contrast-enhanced (DCE) MRI, diffusion-weighted imaging (DWI), FLAIR] may need to be used and combined to differentiate histotripsy ablation or hemorrhage zone from the residual tumor. Thus, future transcranial MR-guided histotripsy of brain tumors will involve specialized MRI sequences to differentiate the tumor kill from associated brain injuries including hemorrhage.
A 1 MHz transducer was used in this study to keep the operating frequency close to the human system (700 kHz). As such, the dynamics and size of the cavitation generated and associated histotripsy parameters were largely preserved to simplify future translation to larger animal models and clinical applications. However, by using a relatively low frequency, the transducer focal zone was large for the treatment of the small murine brain tumor model. The cavitation zone generated by a single focal zone (∼3 mm axial, 1 mm lateral) was comparable to the entirety of the tumor. Therefore, the multi-point treatments (10–12 locations with 0.25 mm spacing) did not produce a significantly larger ablation volume compared to the single-point treatments. This may be why we did not observe a significant BLI signal reduction using the multi-point treatments compared to the single-point treatments for the LL/2-Luc2 tumors. The large focal zone is likely also responsible for the large bleeding area observed in this study. For future studies, we plan to construct a higher-frequency transducer with a smaller focal zone to increase the precision and accuracy of our treatments.
This study had a few limitations. In addition to the sample size being relatively small, our study did not include any form of real-time treatment monitoring. The targeting was achieved with a stereotactic approach based on the MRI fiducial markers in the treatment bed and pre-treatment MRI scans. The treatment accuracy was validated using immediate post-treatment MRI, typically showing the ablation zone covering the tumor on MRI. However, the lack of real-time monitoring is expected to reduce the safety and treatment accuracy of our experiments. Although the variation in initial tumor volume for the GL261 tumors among mice was large, this was not expected to influence our results as the majority (17–20) of tumors were within 1.1–4.2 mm3 in volume at the time of treatment, and the three larger tumors were distributed to different treatment groups.
This study is a limited acute experiment, which cannot be used to address the long-term implication of the hemorrhage and any other side effects. Future survival studies will be needed to evaluate the long-term safety and effect of hemorrhage induced by transcranial histotripsy. Histotripsy-induced mechanical homogenization may help drug delivery as well as the removal of liquefied components. We plan to investigate the combination of low histotripsy doses with drug delivery (e.g., chemotherapy drugs) for the treatment of brain tumors. Although more work is needed to further optimize histotripsy treatment in the brain, this study suggests that a relatively low histotripsy dose can be effective for tumor cell killing while minimizing associated hemorrhage in the treatment of highly vascular brain tumors.
Disclosure statement
Dr Xu and the University of Michigan have conflicts of interest with HistoSonics.
Data availability statement
The datasets used and/or analyzed for the current study are available from the corresponding author upon reasonable request.
Additional information
Funding
References
- Davis FG, McCarthy BJ. Current epidemiological trends and surveillance issues in brain tumors. Expert Rev Anticancer Ther. 2001;1(3):395–401. doi: 10.1586/14737140.1.3.395.
- Urbańska K, Sokołowska J, Szmidt M, et al. Glioblastoma multiforme – an overview. Contemp Oncol (Pozn). 2014;18(5):307–312. doi: 10.5114/wo.2014.40559.
- Arvold ND, Lee EQ, Mehta MP, et al. Updates in the management of brain metastases. Neuro Oncol. 2016;18(8):1043–1065. doi: 10.1093/neuonc/now127.
- Achrol AS, Rennert RC, Andres C, et al. Brain metastases. Nat Rev Dis Primers. 2019;5(1):5.
- Brandes AA. State-of-the-art treatment of high-grade brain tumors. Semin Oncol. 2003;30(6 Suppl 19):4–9. doi: 10.1053/j.seminoncol.2003.11.028.
- Denunzio NJ, Yock TI. Modern radiotherapy for pediatric brain tumors. Cancers (Basel). 2020;12(6):1533. doi: 10.3390/cancers12061533.
- Ron E, Modan B, Boice JD, et al. Tumors of the brain and nervous system after radiotherapy in childhood. N Engl J Med. 1988;319(16):1033–1039. doi: 10.1056/NEJM198810203191601.
- Swanson KR, Alvord EC, Murray JD. Quantifying efficacy of chemotherapy of brain tumors with homogenous and heterogenous drug delivery. Acta Biotheor. 2002;50(4):223–237. doi: 10.1023/a:1022644031905.
- Vries NAD, Beijnen JH, Boogerd W, et al. Expert review of neurotherapeutics blood–brain barrier and chemotherapeutic treatment of brain tumors. Expert Rev. Neurother. 2014;6:1199–1209.
- Lu N, Hall TL, Choi D, et al. Transcranial MR-Guided histotripsy system. IEEE Trans Ultrason Ferroelectr Freq Control. 2021;68(9):2917–2929. doi: 10.1109/TUFFC.2021.3068113.
- Lu N, Gupta D, Daou BJ, et al. Transcranial magnetic resonance-guided histotripsy for brain surgery: pre-clinical investigation. Ultrasound Med Biol. 2022;48(1):98–110. doi: 10.1016/j.ultrasmedbio.2021.09.008.
- Federau C, Goubran M, Rosenberg J, et al. Transcranial MRI-guided high-intensity focused ultrasound for treatment of essential tremor: a pilot study on the correlation between lesion size, lesion location, thermal dose, and clinical outcome. J Magn Reson Imaging. 2018;48(1):58–65. doi: 10.1002/jmri.25878.
- Boutet A, Ranjan M, Zhong J, et al. Focused ultrasound thalamotomy location determines clinical benefits in patients with essential tremor. Brain. 2018;141(12):3405–3414. doi: 10.1093/brain/awy278.
- Lipsman N, Schwartz ML, Huang Y, et al. MR-guided focused ultrasound thalamotomy for essential tremor: a proof-of-concept study. Lancet Neurol. 2013;12(5):462–468. doi: 10.1016/S1474-4422(13)70048-6.
- Todd N, Zhang Y, Arcaro M, et al. NeuroImage focused ultrasound induced opening of the blood-brain barrier disrupts inter-hemispheric resting state functional connectivity in the rat brain. Neuroimage. 2018;178:414–422. doi: 10.1016/j.neuroimage.2018.05.063.
- Ji R, Smith M, Niimi Y, et al. Focused ultrasound enhanced intranasal delivery of brain derived neurotrophic factor produces neurorestorative effects in a Parkinson ‘ s disease mouse model. Sci Rep. 2019;9(1):19402. doi: 10.1038/s41598-019-55294-5.
- Connor CW, Hynynen K. Patterns of thermal deposition in the skull during transcranial focused ultrasound surgery. IEEE Trans Biomed Eng. 2004;51(10):1693–1706. doi: 10.1109/TBME.2004.831516.
- Dervishi E, Larrat B, Pernot M, et al. Transcranial high intensity focused ultrasound therapy guided by 7 TESLA MRI in a rat brain tumour model: a feasibility study. Int J Hyperth. 2013;29(6):598–608. doi: 10.3109/02656736.2013.820357.
- Pinton G, Aubry J-F, Bossy E, et al. Attenuation, scattering, and absorption of ultrasound in the skull bone. Med Phys. 2012;39(1):299–307. doi: 10.1118/1.3668316.
- Remer S, Murphy ME. The challenges of long-term treatment outcomes in adults with malignant gliomas. Clin J Oncol Nurs. 2004;8(4):368–376. doi: 10.1188/04.CJON.368-376.
- Xu Z, Ludomirsky A, Eun LY, et al. Controlled ultrasound tissue erosion. IEEE Trans Ultrason Ferroelectr Freq Control. 2004;51(6):726–736. doi: 10.1109/tuffc.2004.1308731.
- Khokhlova VA, Fowlkes JB, Roberts WW, et al. Histotripsy methods in mechanical disintegration of tissue: towards clinical applications. Int J Hyperth. 2015;31(2):145–162. doi: 10.3109/02656736.2015.1007538.
- Sukovich J, Xu Z, Kim Y, et al. Targeted lesion generation through the skull without aberration correction using histotripsy. IEEE Trans Ultrason Ferroelectr Freq Control. 2016;63(5):671–682. doi: 10.1109/TUFFC.2016.2531504.
- Choi SW, Duclos S, Camelo-Piragua S, et al. Histotripsy treatment of murine brain and glioma: temporal profile of MRI and histological characteristics post-treatment. Ultrasound Med. Biol. 2023;49(8):1882–1891.
- McGirt MJ, Chaichana KL, Gathinji M, et al. Independent association of extent of resection with survival in patients with malignant brain astrocytoma. J Neurosurg. 2009;110(1):156–162. doi: 10.3171/2008.4.17536.
- Molinaro AM, Hervey-Jumper S, Morshed RA, et al. Association of maximal extent of resection of contrast-enhanced and non-contrast-enhanced tumor with survival within molecular subgroups of patients with newly diagnosed glioblastoma. JAMA Oncol. 2020;6(4):495–503. doi: 10.1001/jamaoncol.2019.6143.
- Stummer W, van den Bent MJ, Westphal M. Cytoreductive surgery of glioblastoma as the key to successful adjuvant therapies: new arguments in an old discussion. Acta Neurochir. 2011;153(6):1211–1218. doi: 10.1007/s00701-011-1001-x.
- Marko NF, Weil RJ, Schroeder JL, et al. Extent of resection of glioblastoma revisited: personalized survival modeling facilitates more accurate survival prediction and supports a maximum-safe-resection approach to surgery. J Clin Oncol. 2014;32(8):774–782. doi: 10.1200/JCO.2013.51.8886.
- Lin K-W, Kim Y, Maxwell AD, et al. Histotripsy beyond the intrinsic cavitation threshold using very short ultrasound pulses: microtripsy. IEEE Trans Ultrason Ferroelectr Freq Control. 2014;61(2):251–265. doi: 10.1109/TUFFC.2014.6722611.
- Choi SW, Gerhardson TI, Duclos SE, et al. Stereotactic transcranial focused ultrasound targeting system for murine brain models. IEEE Trans Ultrason Ferroelectr Freq Control. 2021;68(1):154–163. doi: 10.1109/TUFFC.2020.3012303.
- Gerhardson T, Sukovich JR, Pandey AS, et al. Effect of frequency and focal spacing on transcranial histotripsy clot liquefaction, using electronic focal steering. Ultrasound Med Biol. 2017;43(10):2302–2317. doi: 10.1016/j.ultrasmedbio.2017.06.010.
- Zhang J, Wu S, Liu Y, et al. Disruption of prostate microvasculature by combining microbubble-enhanced ultrasound and prothrombin. PLoS One. 2016;11(9):e0162398. doi: 10.1371/journal.pone.0162398.
- Mauch SC, Zlevor AM, Knott EA, et al. Hepatic and renal histotripsy in an anticoagulated porcine model. J Vasc Interv Radiol. 2023;34(3):386–394.e2. doi: 10.1016/j.jvir.2022.11.034.
- Vlaisavljevich E, Owens G, Lundt J, et al. Non-invasive liver ablation using histotripsy: preclinical safety study in an in vivo procine model. Ultrasound Med Biol. 2017;43(6):1237–1251. doi: 10.1016/j.ultrasmedbio.2017.01.016.
- Novakovic N, Wilseck ZM, Chenevert TL, et al. Assessing early erythrolysis and the relationship to perihematomal iron overload and white matter survival in human intracerebral hemorrhage. CNS Neurosci Ther. 2021;27(10):1118–1126. doi: 10.1111/cns.13693.