
 ?Mathematical formulae have been encoded as MathML and are displayed in this HTML version using MathJax in order to improve their display. Uncheck the box to turn MathJax off. This feature requires Javascript. Click on a formula to zoom.
Abstract
Background
A method for periprocedural contrast agent-free visualization of uterine fibroid perfusion could potentially shorten magnetic resonance-guided high intensity focused ultrasound (MR-HIFU) treatment times and improve outcomes. Our goal was to test feasibility of perfusion fraction mapping by intravoxel incoherent motion (IVIM) modeling using diffusion-weighted MRI as method for visual evaluation of MR-HIFU treatment progression.
Methods
Conventional and T2-corrected IVIM-derived perfusion fraction maps were retrospectively calculated by applying two fitting methods to diffusion-weighted MRI data (b = 0, 50, 100, 200, 400, 600 and 800 s/mm2 at 1.5 T) from forty-four premenopausal women who underwent MR-HIFU ablation treatment of uterine fibroids. Contrast in perfusion fraction maps between areas with low perfusion fraction and surrounding tissue in the target uterine fibroid immediately following MR-HIFU treatment was evaluated. Additionally, the Dice similarity coefficient (DSC) was calculated between delineated areas with low IVIM-derived perfusion fraction and hypoperfusion based on CE-T1w.
Results
Average perfusion fraction ranged between 0.068 and 0.083 in areas with low perfusion fraction based on visual assessment, and between 0.256 and 0.335 in surrounding tissues (all p < 0.001). DSCs ranged from 0.714 to 0.734 between areas with low perfusion fraction and the CE-T1w derived non-perfused areas, with excellent intraobserver reliability of the delineated areas (ICC 0.97).
Conclusion
The MR-HIFU treatment effect in uterine fibroids can be visualized using IVIM perfusion fraction mapping, in moderate concordance with contrast enhanced MRI. IVIM perfusion fraction mapping has therefore the potential to serve as a contrast agent-free imaging method to visualize the MR-HIFU treatment progression in uterine fibroids.
Introduction
Uterine fibroids, also known as leiomyomas, are benign smooth muscle tumors that develop in the myometrium. They affect around 75% of women during their lifetime and cause symptoms in 25% of patients, including menorrhagia, pelvic pain, pelvic or urinary obstruction, infertility and pregnancy loss [Citation1–3]. The high incidence combined with the relatively high cost of the standard surgical treatment (myomectomy or hysterectomy) results in a large socioeconomic burden estimated at 5.9–34.4 billion dollars annually in the United States [Citation4]. As a noninvasive alternative, MR-guided high-intensity focused ultrasound (MR-HIFU) therapy offers a uterus-sparing and potentially less costly treatment option for symptomatic uterine fibroids [Citation5–9]. During MR-HIFU treatments, acoustic energy is focused to selectively ablate target tissue by heat-induced coagulative necrosis. The treatment is conducted by moving the focal point over the target volume and performing a series of so-called sonications, single exposures of focused ultrasound energy. In the months following successful uterine fibroid MR-HIFU treatment, the treated fibroid typically shrinks, resulting in a reduction in symptoms [Citation10].
The amount of fibroid shrinkage and subsequent symptom relief has been shown to be related to the post-procedural non-perfused volume ratio (NPVR), i.e. the non-perfused volume (NPV) divided by the initial volume of the target fibroid [Citation5]. Due to its relatively strong relation with long-term clinical outcomes, the NPVR is broadly considered to be the primary technical outcome parameter in MR-HIFU treatments of uterine fibroids. Treatments with high post-treatment NPVRs result generally in relatively large fibroid volume reduction and symptom relief [Citation5, Citation11]. In current clinical practice, a contrast-enhanced (CE) T1w scan is acquired at the end of the procedure to determine the NPV. The need for a contrast agent to assess the NPV hinders repeated intra-procedural monitoring of treatment progression. Because sonications are usually not performed directly after contrast agent injection due to potential increased toxicity and thermometry disturbance [Citation11, Citation12], CE-T1w scans cannot easily be used for safe intraprocedural monitoring of treatment progression. The absence of a method for intraprocedural monitoring in clinical practice leads occasionally to unsuccessful and unnecessary lengthy MR-HIFU treatments. Without imaging guidance of treatment progression, the treating physician guesses when the MR-HIFU treatment session should be terminated. Premature and overdue cessations of treatment lead occasionally to poor clinical outcomes and unnecessary lengthy procedures, respectively. Improvements in treatment time and outcomes may be achieved when intraprocedural monitoring of treatment is available.
Various methods have been proposed to enable contrast agent-free visualization of the NPV [Citation13], including techniques based on DWI analysis using apparent diffusion coefficient (ADC) [Citation14–16], a deep learning-based DWI-to-CE-T1w image translator [Citation17], and intravoxel incoherent motion (IVIM) models [Citation18, Citation19].
Previous studies have characterized uterine fibroid tissue types using parameters from IVIM modeling including perfusion fraction () [Citation18–20]. Furthermore, perfusion fraction has been proposed as a potential biomarker for contrast agent-free visualization of fibroid perfusion [Citation19, Citation21]. However, studies directly comparing perfusion fraction maps with CE-T1w are scarce and have been performed in a limited number of uterine fibroid patients [Citation22].
In addition, T2-correction in IVIM characterization of uterine fibroids was advocated by Qu et al. [Citation19]. The authors observed significant changes in IVIM parameter values after applying T2-correction, mainly in perfusion fraction maps. However, the influence of T2-correction on perfusion fraction has not been investigated in the context of NPV visualization.
Finally, several studies have proposed deep learning-based fitting in IVIM modeling as an alternative to conventional least-squares fitting. Deep learning-based fitting has been shown to result in visually improved IVIM parametric maps and potentially faster fitting times [Citation23, Citation24], both of which are beneficial for visual intra-procedural evaluation of perfusion fraction maps.
The primary goal of this study was to evaluate perfusion fraction mapping as a method for visualizing the NPV as seen on CE-T1w scans in a study population containing paired DWI and CE-T1w scans. Second, perfusion fraction maps generated by conventional least-squares fitting were compared with those obtained by deep learning-based fitting, both with T2-corrected and uncorrected IVIM-models.
Materials and methods
This retrospective study included prospectively acquired data from the MASS1 and MASS2 studies, which were designed to evaluate multiparametric MRI for screening of patient eligibility for MR-HIFU treatment, and MR-HIFU treatment outcomes, respectively [Citation14, Citation25]. Signed informed consent was obtained, and the local medical research ethics committee approved the current retrospective study.
Study population and MRI data
The study population consisted of a subset of 44 patients of whom all required MRI data was available (). Patients were enrolled between June 2017 and January 2019 at Isala Hospital in Zwolle, the Netherlands. All patients underwent MR-HIFU treatment for symptomatic UF(s), and MRI data was acquired at screening and during the MR-HIFU procedure. The intended application and timeline of contrast agent-free imaging of the treatment progression during MR-HIFU treatments of uterine fibroids is described and visualized in our previous publication [Citation17]. Inclusion and exclusion criteria of the data source studies (MASS1 & MASS2) are described in Slotman et al. [Citation17].
Table 1. Study sample characteristics.
Scans and treatment procedures were performed on a 1.5-T MR-scanner (Achieva, Philips Healthcare), equipped with a clinical MR-HIFU system (Sonalleve, V1, Profound Medical) during treatment. DWI, T2-mapping, and CE-T1w scans were acquired at screening and at the end of the HIFU procedure when the patient was still on the treatment table. Axial DWI images were acquired with a fat-suppressed multi-slice single-shot spin echo-echo planar imaging (SE-EPI) sequence. The most important scan parameter settings were: TR/TE = 1352 ms/65 ms, acquired voxel size: 2.50 × 4.36 × 6.00 mm3, reconstructed voxel size: 0.89 × 0.90 × 6.00 mm3, reconstructed FOV = 300 × 300 mm2, number of slices = 15, EPI factor = 51, fat suppression with a spectral attenuated inversion recovery prepulse (SPAIR), SENSE parallel imaging with SENSE factor 2, read out bandwidth = 33.6 Hz/pixel, number of signal averages (NSA) = 3, phase encoding direction: anterior-posterior, scan duration: 3 min and 14 s, at different strengths of diffusion weighting corresponding to b-values of 0, 50, 100, 200, 400, 600 and 800 s/mm2, measured with three diffusion weighting gradients with phase-oblique, frequency-oblique, and slice-oblique directions. T2-maps, required for applying T2-correction in IVIM modeling, were calculated on the MR console using data acquired with an axial multi-spin-echo sequence (TR/TE = 2000 ms/0–240 ms, number of echoes: 12 with 20 ms echo-spacing, acquired voxel size: 2.50 × 2.81 × 7.00 mm3, reconstructed voxel size: 1.76 × 1.76 × 7.00 mm3, phase encoding direction: right-left), and an image orientation and position identical to DWI. T2-maps were resampled using linear interpolation to the DWI coordinate system. Coronal CE-T1w image data was acquired using a fat-suppressed 3-D spoiled gradient-echo sequence (TR/TE/FA = 5.4 ms/2.6 ms/45°, acquired voxel size: 1.49 × 1.58 × 3.00 mm3, reconstructed voxel size: 0.49 × 0.49 × 1.50 mm3), number of slices: 90.
IVIM models
An uncorrected and a T2-corrected IVIM model were used in this study. Analyses of the uncorrected IVIM model were based on the model originally introduced by Le Bihan [Citation26, Citation27]. The following uncorrected IVIM model was fitted to the DWI data:
(1)
(1)
where
is the signal intensity at diffusion weighting
(s/mm2),
the signal intensity at
= 0 s/mm2,
the diffusion coefficient,
the pseudo-diffusion (perfusion) coefficient, and
the blood volume fraction. EquationEquation (1)
(1)
(1) models the signal decay due to intravoxel incoherent motion of water molecules by two exponential terms, including one that accounts for the slow signal loss due to water diffusion in tissue and one for the fast signal loss due to pseudo-diffusion of blood in the assumed randomly oriented microcapillary network. Hence, parameter
describes the blood signal fraction and may be correlated with the degree of perfusion in tissue, assuming a randomly oriented capillary network.
The use of T2-correction in IVIM modeling of uterine fibroid has been advocated in the literature when large differences in T2 relaxivity between compartments are expected [Citation19]. At 1.5 T, the T2 relaxation time of arterial blood is approximately five times higher than of fibroid tissue (254 ± 26 ms vs. 47.9 ± 4.6 ms [Citation28, Citation29]). To estimate the relative volume fraction, rather than signal fraction, of both compartments more accurately, EquationEq. (1)(1)
(1) can be extended by incorporating correction for differences in T2:
(2)
(2)
Here, ,
and
are the T2-corrected counterparts of
,
and
.
Fitting of IVIM models
First, the IVIM models from EquationEqs. (1)(1)
(1) and Equation(2)
(2)
(2) were fitted to the DWI data using the nonlinear least-squares optimization implementation of SciPy 1.0 [Citation30]. In EquationEq. (2)
(2)
(2) , the values from the T2-parametric map served as T2tissue, and T2blood was fixed at 290 ms, in accordance with Qu et al. [Citation19]. We investigated the influence of T2blood on
(Appendix A). Initial estimates for voxelwise fitting were found by fitting EquationEqs. (1)
(1)
(1) and Equation(2)
(2)
(2) to the spatially averaged DWI and T2 values within a circular region-of-interest (ROI) in the center of the dominant target uterine fibroid treated with MR-HIFU. Furthermore,
and
were fixed during voxelwise fitting to these initial estimates to increase fitting stability, as perfusion fraction is the parameter under investigation in this study. As is shown in Appendix B, when in a reasonable range (substantially higher than
and
) the exact value of
and
does not play an important role in
and
estimation.
Secondly, the fitting of EquationEqs. (1)(1)
(1) and Equation(2)
(2)
(2) was repeated using a self-supervised deep learning-based neural net [Citation23]. A neural network consisting of 7 fully connected layers was trained on voxels sampled from the target fibroid of the first five consecutive patients. A mean-squared error loss, Adam optimizer and batch size of 64 voxels was used. Perfusion fraction (
or
) and diffusion coefficient (
or
) were constrained between 0 to 1 and 0 to 3·10−3 respectively. This was implemented by adding an additional exponential loss function (ReLu activation to the power of three) for these parameters when their value went outside the desired range. A power of three was chosen to penalize larger out-of-bounds predictions harder but was arbitrary to some degree. After training, IVIM parameter maps were reconstructed by voxelwise prediction of parameters from DWI data using the trained neural net. It has been suggested that neural net fitting could lead to less noisy and more detailed parameter maps, important factors for intraprocedural application of IVIM perfusion maps [Citation23, Citation24].
By combining the least squares (LQ) and neural net (NN) fitting methods with both IVIM models, four types of perfusion fraction maps were finally calculated: ,
,
and
maps (i.e. T2-uncorrected + LQ, T2-uncorrected + NN, T2-corrected + LQ, and T2-corrected + NN, respectively).
Evaluation of IVIM perfusion fraction maps
Contrast evaluations
For perfusion fraction maps to be used as a method for evaluating MR-HIFU treatment, they should be able to distinguish between ablated and surrounding tissue in uterine fibroids. As ablated tissue is characterized by the absence of perfusion, low perfusion fraction on post-HIFU perfusion fraction maps could reflect the treated volume. In this study, we refer to the area with low perfusion fraction within uterine fibroids as the IVIM apparent non-perfused volume (NPVIVIM).
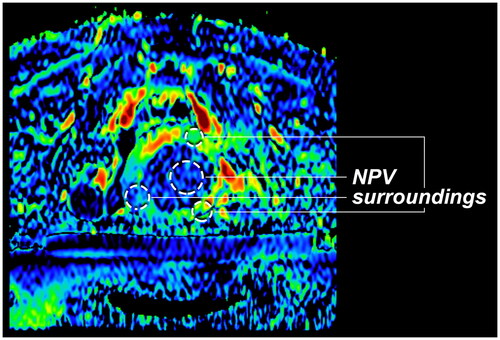
In the perfusion fraction maps, per patient a circular region of interest (ROI) was drawn in the center of NPVIVIM in the target uterine fibroid and three ROIs in surrounding tissue by an experienced clinical researcher (). The average perfusion fraction measured in both ROIs were compared to assess the contrast between the NPVIVIM and surrounding tissue. In addition, the ROIs were used to calculate the contrast-to-noise ratio (CNR) between the NPVIVIM and surrounding tissue in all patients. The CNR was calculated using EquationEq. (3)(3)
(3) .
(3)
(3)
Figure 1. Example ROI placement for intensity and CNR analysis between the IVIM-based non-perfused volume (NPV) and surrounding tissue. This example shows an -map calculated with least-squares fitting without T2-correction.
NPV delineation analysis
As the intended goal of this method is intraprocedural visual monitoring of the NPV in concordance with contrast enhanced scans, an NPV delineation analysis was performed. The NPVIVIM and the reference NPV from paired CE-T1w scans (NPVref) were manually delineated in random order for all perfusion fraction types, on the axial center slice of the target fibroid by an experienced clinical researcher. The NPVref were resampled to match the perfusion fraction maps. To assess the agreement between NPVIVIM and NPVref, the Dice similarity coefficient (DSC) between the two NPV delineations was calculated. Secondly, areas of NPVIVIM delineations were compared between the different perfusion fraction types and the NPVref areas. Finally, the intraobserver reliability was assessed to test the reliability of the NPVIVIM delineations. The observer repeated the NPVIVIM delineations for all patients in the maps with at least six months in between delineations of the same patient. DSC was calculated between the two delineations, and NPVIVIM areas were compared.
Statistical analysis
Contrast evaluations
Perfusion fraction was compared between the NPVIVIM ROI and surroundings ROI within the four perfusion fraction subtypes. Significant contrast was defined as a statistical difference between areas with low perfusion fraction and surroundings, calculated with a paired two-sample t-test for normally distributed samples, and a Wilcoxon signed-rank test for not normally distributed samples. Normality was assessed using QQ-plots and eyeball tests. A one-way ANOVA analysis was used to test whether CNRs differed significantly between the four perfusion fraction subtypes. A 5% significance level was used for all tests.
NPV delineation analysis
Areas of NPVIVIM on the four perfusion fraction map types and NPVref were reported. Agreement between NPVIVIM and NPVref was estimated using Bland-Altman plots. Intraobserver reliability of NPVIVIM delineations was analyzed by calculating the single fixed rater Intraclass Correlation Coefficient (ICC) between the repeated delineations.
Results
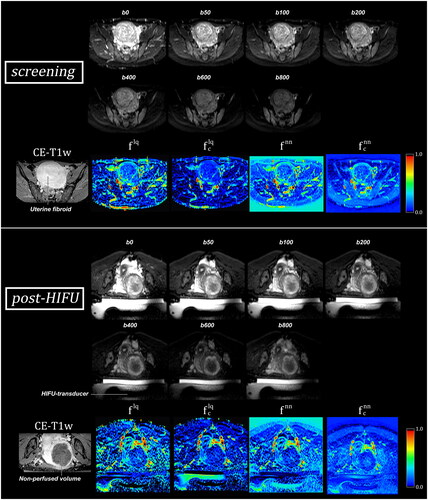
A representative patient before and after a successful MR-HIFU treatment of a symptomatic uterine fibroid of 236 cm3 is shown in . Based on the CE-T1w scan, the fibroid’s perfusion has been eliminated, as the NPVref covers the complete fibroid. This seems also apparent on the post-HIFU perfusion fraction maps, as values within the fibroid are lower than screening. The dark area on perfusion fraction maps is referred to in this study as the NPVIVIM.
Figure 2. Diffusion weighted imaging (DWI) b-value images (first two rows) and IVIM perfusion fraction maps (lower rows) of a uterine fibroid before and after MR-HIFU treatment, generated using conventional least squares () and neural net (
) fitting techniques, and a T2-uncorrected (
) and T2-corrected (
) IVIM model. Based on the contrast enhanced-T1w (CE-T1w) scan, the fibroid’s perfusion has been successfully eliminated in this patient. This seems to be accurately reflected on the post-HIFU perfusion fraction maps, as perfusion fraction is decreased within the fibroid in comparison to screening. The HIFU-transducer, which is located in an oil tank, is visible in the post-HIFU DWI and perfusion fraction maps and marked in the post-HIFU b0 DWI image. During treatment, the patient lies prone on a membrane on top of the transducer.
Contrast evaluations
In NPVIVIM, the average perfusion fractions over patients were: = 0.092 (± 0.084),
= 0.058 (± 0.098),
= 0.080 (± 0.083), and
= 0.091 (± 0.076). This was significantly lower (all p < 0.001) compared to the surrounding perfused volume, with perfusion fraction values of
= 0.367 (± 0.121),
= 0.244 (± 0.101),
= 0.314 (± 0.101), and
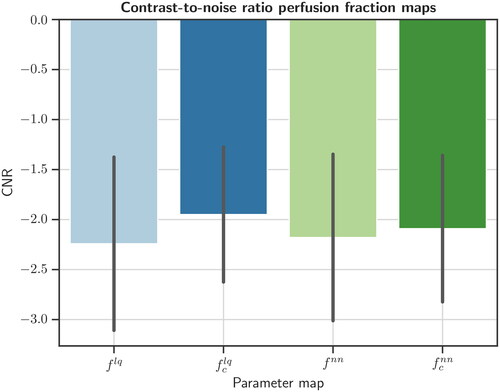
= 0.280 (± 0.089) (). Average CNRs were
= −2.24 (± 0.87),
= −1.95 (± 0.68),
= −2.18 (± 0.83), and
= −2.09 (± 0.73). CNRs did not differ significantly between the four perfusion fraction types (p = 0.37) ().
Figure 3. Mean perfusion fraction (/
) in IVIM perfusion fraction maps, between the area with low perfusion fraction in the treated fibroid and surrounding tissue, after an MR-HIFU treatment. All four types of IVIM perfusion fraction maps showed a significant difference in perfusion fraction between low-value area and surrounding tissue.
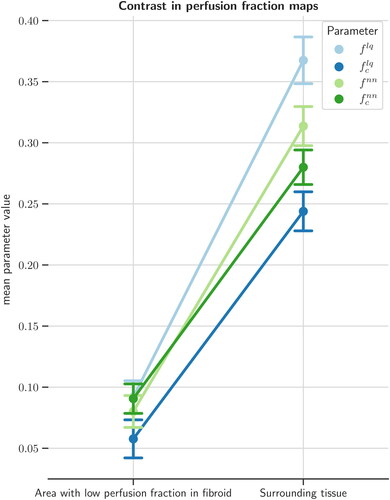
Figure 4. Contrast-to-noise (CNR) analysis between the low-value area in the treated fibroid and surrounding tissue in IVIM perfusion fraction (/
) maps. The CNR was not significantly different for any of the perfusion fraction map combinations.
= least squares,
= neural net,
= T2 corrected.
NPV delineation analysis
DSC values between the NPVIVIM and the CE-T1w derived NPVref segmentations were 0.724 (), 0.734 (
), 0.714 (
), and 0.722 (
) (). The average area of the NPVref was 21.0 ± 17.2 cm2. This was significantly different from the NPVIVIM retrieved from
-maps (Citation25.Citation4 ± 16.5 cm2, p = 0.028) and
-maps (25.0 ± 18.2 cm2, p = 0.047), and followed a trend toward significance for NPVIVIM retrieved from
-maps (Citation24.Citation3 ± 17.9 cm2, p = 0.074) and
-maps (Citation23.Citation1 ± 17.4 cm2, p = 0.288). The 95% limits of agreement between the NPVIVIM and NPVref areas ranged between −16.67 and 22.06 cm2 (). Narrowest 95% limits of agreement range between NPVref and NPVIVIM was found in
-maps (−13.49 to 20.00 cm2).
Figure 5. Bland-Altman plot of areas with low perfusion fraction (/
) measured on perfusion fraction maps and non-perfused areas on reference contrast enhanced T1-weighted scans, immediately after MR-HIFU treatments of uterine fibroids.
= least squares,
= neural net,
= T2 corrected.
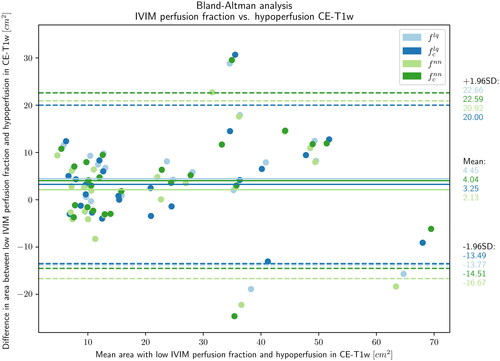
Table 2. Dice similarity coefficient between perfusion fraction maps and contrast-enhanced T1-weighted MRI.
DSC of the repeated delineations to test intraobserver reliability was 0.912 (± 0.057). Intraobserver reliability of the area measurements was excellent (ICC 0.97 [0.95, 0.98])
Discussion
This study evaluated the use of IVIM perfusion fraction ( or
) for contrast agent-free monitoring of the MR-HIFU treatment of uterine fibroids. Least squares- and neural net-based fitting techniques were used to fit conventional and T2-corrected IVIM models to post-HIFU DWI in a clinical cohort of patients treated with MR-HIFU. Quantitative analyses showed a DSC of 0.714 to 0.734 for areas with low perfusion fraction and NPV in CE-T1w. Although this DSC is not considered excellent, it may be sufficient to decide intraprocedurally whether or not to terminate the MR-HIFU, at the cost of a couple of minutes scan and processing time. In the intended application of intraprocedural monitoring of treatment progression, the main application of IVIM perfusion fraction maps would be to detect whether a sufficient NPVR is reached (>80%), as opposed to the exact delineation of the NPV on CE-T1w after treatment.
We found minimal differences between the different types of perfusion fraction maps. From our contrast and NPV analyses, no superior method (least squares vs. neural net) or IVIM model (EquationEq. (1)(1)
(1) vs EquationEq. (2)
(2)
(2) ) was found. Based on the DSC analysis, we found no clear preference for the T2-corrected IVIM model for visual assessment of the NPVIVIM. In addition, T2-correction generally lowers the perfusion fraction value, decreasing the contrast between the non-perfused and perfused tissues in the perfusion fraction maps, as subtly visible from the slopes in . Taken together, our study does not indicate that applying T2-correction outweigh the extra scanning time of the required T2-mapping scan, when clinically applying IVIM-derived perfusion fraction mapping for the goal of contrast agent-free visual treatment monitoring in MR-HIFU ablations of uterine fibroids.
With regards to visual interpretability, -maps seemed to be the most visually appealing, based on unstructured visual observations during the course of this study. Specifically, the parameter maps look more detailed and less noisy, although this observation is not reflected in the CNR analysis. For the intended clinical application of perfusion fraction maps, parameter maps with sufficient visual quality are needed so that they can be adequately interpreted by the treating physician during the procedure. Structured analysis with radiologists on interpretability were not performed in this study and are needed to confirm these first observations. Looking at the visual differences between the neural nets trained with an uncorrected and a T2-corrected IVIM model, the neural net trained with a T2-corrected IVIM model may have learned to use the additional information from the T2-maps to gain overall robustness. Another notable feature of the parameter maps calculated with the neural nets is the unrealistic air perfusion fraction values above zero (). This can be explained by the fact that the training set only consisted of voxels spatially sampled from target tissue (i.e. uterine fibroid tissue), and as it was not fed with air voxels during training, the neural net was not able to calculate air voxels correctly. This may explain why the neural net gives inaccurate values of perfusion fraction in air, and possibly non-fibroid tissue in general. This implies that the neural net-based perfusion fraction maps values may not be accurate outside the uterine fibroid region. This effect could also have impacted our CNR analysis of
and
(), as non-fibroid tissue could be present in surrounding tissue ROIs. To train a more generalizable neural net for predicting IVIM parameters, it should be trained on a more diverse dataset of DWI voxels.
Another important finding is that NPV could be difficult to find on IVIM perfusion fraction maps when the target fibroid was small. Due to the relatively poor spatial resolution and low CNR in the IVIM perfusion fraction maps, it was difficult to discriminate areas of low perfusion in such fibroids. It is therefore important to note that the DSCs reported in this study were obtained from patients in whom a non-perfused volume could be distinguished from the surrounding viable tissue. The DWI protocol used in this study resulted in IVIM parameter maps that seemed most appropriate for relatively large uterine fibroids. Whether this is a limitation remains to be seen, as patients with large fibroids are most likely to benefit from intraprocedural monitoring, as those MR-HIFU treatments typically take a longer time to complete.
Previous studies have also investigated IVIM perfusion fraction mapping to visualize uterine fibroid perfusion in the context of MR-HIFU treatments. Ikink et al. and Andrews et al. investigated IVIM parameter maps in relation to different uterine fibroid subtypes [Citation18, Citation20]. Qu et al. stated that perfusion fraction could possibly serve as a noncontrast biomarker of uterine fibroid perfusion, and advocated the importance of T2-correction [Citation19]. Also in that study, the was substantially lower compared to the uncorrected parameter
. This can be explained by the fact that T2 relaxation time for arterial blood is about five times higher than for uterine fibroids. This means that blood/perfusion has a higher relative contribution to signal than volume in uterine fibroids. While
expresses signal fraction, with
volume fraction is estimated. It may be questioned whether a more realistic estimate of the perfusion fraction is important for visual discrimination of low- and well-perfused tissue on IVIM
-maps in the context of intraprocedural monitoring of MR-HIFU treatments. As T2-correction will generally lower the contrast between well- and low-perfused tissue, the interpretability may be reduced. Na Tang et al. [Citation21] investigated IVIM in 36 adenomyosis patients treated with MR-HIFU and also found a significantly lower
in the ablation area after treatment compared to screening. They reported a sensitivity and specificity of
of 94.4%. Lastly, Jiang et al. evaluated IVIM for predicting early HIFU efficacy and found an association between high pretreatment
and poor early HIFU outcomes [Citation22].
IVIM perfusion fraction mapping has the potential to provide contrast agent-free visualization of the MR-HIFU treatment effect in uterine fibroids. However, intraprocedural validation between sonications should still be performed before clinical implementation, as diffusion processes can be substantially influenced by treatment time and local temperature. This includes changes in water mobility and DWI signal as a function of temperature. The current IVIM-maps were not derived from DWI acquired between sonications, and temperature may still be elevated immediately after a sonication. Moreover, delayed biological effects such as edema and apoptosis could influence the appearance of parameter maps over time [Citation13, Citation31].
An alternative approach for the contrast agent-free visualization of the NPV in MR-HIFU treatments of uterine fibroids might be T2-mapping. In a study from Morochnik et al. [Citation32], T2-mapping was evaluated in five patients undergoing MR-HIFU treatment of desmoid tumors. The authors found that T2-mapping could be used to visualize changes in desmoid tumor tissue during MR-HIFU treatments, in good agreement with postprocedural CE-T1w-based NPVs. Future studies should investigate whether T2-mapping can also be applied in contrast agent-free NPV visualization in uterine fibroids, and how it compares to IVIM-derived perfusion fraction mapping. Possibly, a multimodal approach incorporating multiple contrast-free biomarkers would fetch more diagnostic value than single parameter approaches. Because T2-mapping and IVIM-derived perfusion fraction mapping as methods to visualize the NPV are based on different principles (i.e. change in tissue T2 and in capillary flow, respectively), both methods may potentially be best applied synergistically.
In addition, further exploration of T2-mapping as screening method for MR-HIFU treatments of uterine fibroids could be beneficial. In a study by Sainio et al., it has been shown that T2-mapping could play a role during screening in predicting the post-HIFU NPV-ratio [Citation33].
Our study has several limitations that should be considered when interpreting its results. Firstly, this was a retrospective, single-center study using equipment from a single vendor, and may therefore have limited generalizability to other hospitals and equipment from other vendors. Second, DSC analyses were performed by a single clinical researcher in 2D on the mid axial slice of the target uterine fibroid. If an NPV was present outside the mid axial slice, it was not included in our analysis. However, the intraobserver reliability was excellent which validates the results of this researcher in the current study. Ideally, multiple observers including HIFU-radiologists would have been included in the DSC analyses. Another limitation is the fact that T2tissue values were taken from the parametric T2-map during voxelwise fitting of EquationEq. (2)(2)
(2) . While these T2-map voxels contain both tissue and blood compartments, the parametric values of the T2-map do not represent T2tissue solely, which entails an error in T2-correction. Future studies should ideally perform multi-center, prospective 3D evaluation of IVIM perfusion fraction maps in visualization of the post-HIFU treatment effect using intraprocedural DWI.
In conclusion, IVIM perfusion fraction maps show the potential to serve as contrast agent-free alternative to visualize the MR-HIFU treatment effect in uterine fibroids, and appears particularly useful in relatively large uterine fibroids. Apart from visual appearance, no substantial differences were found between parameter maps calculated with conventional non-linear least-squares fitting and neural net-based fitting. Prospective intra- and postprocedural validation needs to be performed before this method can be applied clinically.
Disclaimers
No disclaimers.
Supplemental Material
Download Zip (1.2 MB)Disclosure statement
No potential conflict of interest was reported by the authors.
Data availability statement
The clinical, imaging and treatment data is not publicly available, as the study participants did not give consent to share their data publicly with third parties.
References
- Baird DD, Dunson DB, Hill MC, et al. High cumulative incidence of uterine leiomyoma in black and white women: ultrasound evidence. Am J Obstet Gynecol. 2003;188(1):1–10. doi:10.1067/MOB.2003.99.
- Yang Q, Ciebiera M, Bariani MV, et al. Comprehensive review of uterine fibroids: developmental origin, pathogenesis, and treatment. Endocr Rev. 2022;43(4):678–719. Aug doi: 10.1210/endrev/bnab039.
- Stewart EA. Uterine fibroids. Lancet. 2001;357(9252):293–298. doi: 10.1016/S0140-6736(00)03622-9.
- Cardozo ER, Clark AD, Banks NK, et al. The estimated annual cost of uterine leiomyomata in the United States. Am J Obstet Gynecol. 2012;206(3):211.e1–211.e9. doi: 10.1016/j.ajog.2011.12.002.
- Verpalen IM, Anneveldt KJ, Nijholt IM, et al. Magnetic resonance-high intensity focused ultrasound (MR-HIFU) therapy of symptomatic uterine fibroids with unrestrictive treatment protocols: a systematic review and meta-analysis. Eur J Radiol. 2019;120:108700. doi: 10.1016/j.ejrad.2019.108700.
- Fennessy FM, Tempany CM, McDannold NJ, et al. Uterine leiomyomas: MR imaging-guided focused ultrasound surgery – Results of different treatment protocols. Radiology. 2007;243(3):885–893. doi: 10.1148/radiol.2433060267.
- Park MJ, Kim YS, Rhim H, et al. Safety and therapeutic efficacy of complete or near-complete ablation of symptomatic uterine fibroid tumors by MR imaging-guided high-intensity focused US therapy. J Vasc Interv Radiol. 2014;25(2):231–239. doi: 10.1016/j.jvir.2013.11.011.
- Al Hilli MM, Stewart EA. Magnetic resonance-guided focused ultrasound surgery. Semin Reprod Med. 2010;28(3):242–249. doi: 10.1055/s-0030-1251481.
- Stewart EA, Gostout B, Rabinovici J, et al. Sustained relief of leiomyoma symptoms by using focused ultrasound surgery. Obstet Gynecol. 2007;110(2 Pt 1):279–287. doi: 10.1097/01.AOG.0000275283.39475.f6.
- Verpalen IM, de Boer JP, Linstra M, et al. The focused ultrasound myoma outcome study (FUMOS); a retrospective cohort study on long-term outcomes of MR-HIFU therapy. Eur Radiol. 2020;30(5):2473–2482. doi: 10.1007/s00330-019-06641-7.
- Zheng S, Rong Y, Zhu H, et al. Role of magnetic resonance-high intensity focused ultrasound (MR-HIFU) in uterine fibroids management: an updated systematic review and meta-analysis. Wideochir Inne Tech Maloinwazyjne. 2022;17(1):83–94. doi: 10.5114/wiitm.2021.109760.
- Hijnen NM, Elevelt A, Pikkemaat J, et al. The magnetic susceptibility effect of gadolinium-based contrast agents on PRFS-based MR thermometry during thermal interventions. J Ther Ultrasound. 2013;1(1):8. doi: 10.1186/2050-5736-1-8.
- Hectors SJCG, Jacobs I, Moonen CTW, et al. MRI methods for the evaluation of high intensity focused ultrasound tumor treatment: current status and future needs. Magn Reson Med. 2016;75(1):302–317. doi: 10.1002/mrm.25758.
- Verpalen IM. Diffusion-weighted imaging to monitor treatment progression of magnetic resonance guided focused ultrasound fibroid ablation. Improving treatment efficacy of MR-HIFU fibroid ablation, Thesis, 2021, p. 131–148.
- Liao D, Xiao Z, Lv F, et al. Non-contrast enhanced MRI for assessment of uterine fibroids’ early response to ultrasound-guided high-intensity focused ultrasound thermal ablation. Eur J Radiol. 2020;122:108670. doi: 10.1016/j.ejrad.2019.108670.
- Pilatou MC, Stewart EA, Maier SE, et al. MRI-based thermal dosimetry and diffusion-weighted imaging of MRI-Guided focused ultrasound thermal ablation of uterine fibroids. J Magn Reson Imaging. 2009;29(2):404–411. doi: 10.1002/JMRI.21688.
- Slotman DJ, Bartels LW, Zijlstra A, et al. Diffusion-weighted MRI with deep learning for visualizing treatment results of MR-guided HIFU ablation of uterine fibroids. Eur Radiol. 2022;33(6):4178–4188. doi: 10.1007/s00330-022-09294-1.
- Ikink ME, et al. IntraVoxel incoherent motion MRI for the characterization of uterine fibroids before MR-guided high-intensity focused ultrasound ablation. in Proceedings of the Joint Annual Meeting International Society for Magnetic Resonance in Medicine – European Society for Magnetic Resonance in Medicine and Biology, May 2014, p. 3693.
- Qu F, Hor P-H, Fischer J, et al. Tissue characterization of uterine fibroids with an intravoxel incoherent motion model: the need for T2 correction. J Magn Reson Imaging. 2018;48(4):994–1001. doi: 10.1002/JMRI.25988.
- Andrews S, Yuan Q, Bailey A, et al. Multiparametric MRI characterization of funaki types of uterine fibroids considered for MR-guided high-intensity focused ultrasound (MR-HIFU) therapy. Acad Radiol. 2019;26(4):e9–e17. Apr doi: 10.1016/j.acra.2018.05.012.
- Tang N, Gu J, Yin X, et al. Evaluation value of intravoxel incoherent motion diffusion-weighted imaging on early efficacy of magnetic resonance-guided high-intensity focused ultrasound ablation for uterine adenomyoma. J. Shanghai Jiaotong Univ. (Sci.). 2022;27(2):226–230. doi: 10.1007/s12204-022-2405-x.
- Jiang Y, Qin S, Wang Y, et al. Intravoxel incoherent motion diffusion-weighted MRI for predicting the efficacy of high-intensity focused ultrasound ablation for uterine fibroids. Front Oncol. 2023;13:1178649. doi: 10.3389/fonc.2023.1178649.
- Barbieri S, Gurney-Champion OJ, Klaassen R, et al. Deep learning how to fit an intravoxel incoherent motion model to diffusion-weighted MRI. Magn Reson Med. 2020;83(1):312–321. doi: 10.1002/mrm.27910.
- Kaandorp MPT, Barbieri S, Klaassen R, et al. Improved unsupervised physics-informed deep learning for intravoxel incoherent motion modeling and evaluation in pancreatic cancer patients. Magn Reson Med. 2021;86(4):2250–2265. https://arxiv.org/abs/2011.01689v2. doi: 10.1002/mrm.28852.
- Verpalen IM, Anneveldt KJ, Vos PC, et al. Use of multiparametric MRI to characterize uterine fibroid tissue types. Magn Reson Mater Phy. 2020;33(5):689–700. doi: 10.1007/s10334-020-00841-9.
- Le Bihan D, Breton E, Lallemand D, et al. MR imaging of intravoxel incoherent motions: application to diffusion and perfusion in neurologic disorders. Radiology. 1986;161(2):401–407. doi: 10.1148/radiology.161.2.3763909.
- Le Bihan D, Breton E, Lallemand D, et al. Separation of diffusion and perfusion in intravoxel incoherent motion MR imaging. Radiology. 1988;168(2):497–505. doi: 10.1148/radiology.168.2.3393671.
- Zhu L, Lu W, Wang F, et al. Study of T2 mapping in quantifying and discriminating uterine lesions under different magnetic field strengths: 1.5 T vs. 3.0 T. BMC Med Imaging. 2023;23(1):1. doi: 10.1186/s12880-022-00960-w.
- Barth M, Moser E. Proton NMR relaxation times of human blood samples at 1.5 T and implications for functional MRI. Cell. Mol. Biol. (Noisy-Le-Grand). 1997;43(5):783–791.
- Virtanen P, Gommers R, Oliphant TE, et al. SciPy 1.0–fundamental algorithms for scientific computing in python. Nat Method. 2019;17(3):261–272. doi: 10.1038/s41592-019-0686-2.
- Dewey WC. Arrhenius relationships from the molecule and cell to the clinic. Int J Hyperthermia. 1994;10(4):457–483. doi: 10.3109/02656739409009351.
- Morochnik S, Ozhinsky E, Rieke V, et al. T2 mapping as a predictor of nonperfused volume in MRgFUS treatment of desmoid tumors. Int J Hyperthermia. 2019;36(1):1272–1277. doi: 10.1080/02656736.2019.1698773.
- Sainio T, Saunavaara J, Komar G, et al. Feasibility of T2 relaxation time in predicting the technical outcome of MR-guided high-intensity focused ultrasound treatment of uterine fibroids. Int J Hyperthermia. 2021;38(1):1384–1393. doi: 10.1080/02656736.2021.1976850.
Appendices
Appendix A. Influence of T2blood on IVIM-derived perfusion fraction.
Appendix B. Influence of fixing and
on IVIM-derived perfusion fraction.