
ABSTRACT
Introduction
Fifteen percent of individuals who sustain a concussion develop persistent concussion symptoms (PCS). Recent literature has demonstrated atrophy of the frontal, parietal, and cerebellar regions following acute concussive injury. The frontoparietal-cerebellar network is essential for the performance of visuomotor transformation tasks requiring cognitive-motor integration (CMI), important for daily function.
Purpose
We investigated cortical and subcortical structural differences and how these differences are associated with CMI performance in those with PCS versus healthy controls.
Methods
Twenty-six age-matched female participants (13 PCS, 13 healthy) completed four visuomotor tasks. Additionally, MR-images were analyzed for cortical thickness and volume, and cerebellar lobule volume.
Results
No statistically significant group differences were found in CMI performance. However, those with PCS demonstrated a significantly thicker and larger precuneus, and significantly smaller cerebellar lobules (VIIIa, VIIIb, X) compared to controls. When groups were combined, volumes of both the cerebellar lobules and cortical regions were associated with CMI task performance.
Conclusion
The lack of behavioral differences combined with the structural differences may reflect a compensatory mechanism for those with PCS. In addition, this study highlights the effectiveness of CMI tasks in estimating the structural integrity of the frontoparietal-cerebellar network and is among the first to demonstrate structural correlates of PCS.
Introduction
Concussions, a form of mild traumatic brain injury, affect an estimated 1.6–3.8 million Americans each year (Citation1). Of these, 10–15% will develop post-concussion syndrome (PCS) (Citation2,Citation3), in which symptoms persist beyond the typical recovery period (Citation4–7). These persistent symptoms can lead to long-term disability, costing approximately $17 billion dollars each year in direct expenses and lost income (Citation8). Therefore, it is important to better understand the underlying effects of PCS in order to improve recovery. The etiology of persistent symptoms is poorly understood. However, it is believed that PCS has both psychological and biological aspects (Citation9–11). Biologically, it has been suggested that axonal damage, sustained in the initial injury, leads to impaired neurotransmission and speed of processing (Citation12,Citation13). Cerebral atrophy is known to occur after traumatic brain injury involving diffuse axonal injury (DAI) (Citation14). Therefore, since axonal injury is also the suggested etiology of concussion and PCS, structural changes may also occur after mild brain injuries or concussions. Studies investigating both acute and subacute concussive injuries have found cortical thinning in those who sustained a concussion compared to healthy controls (Citation15–17). Specifically, this was found within the frontal lobe (dorsolateral prefrontal cortex, DLPFC; precentral region, M1) and parietal lobe (inferior parietal lobe, IPL). Similarly, longitudinal studies, over the course of a year following mild traumatic brain injury (mTBI), have also demonstrated cortical thinning and cortical volume loss in the frontal and parietal lobes (Citation18,Citation19). For example, a study by Zhou et al. (Citation18) demonstrated a decrease in the volume of the right precuneus in working-aged adults (22 men, 6 women) who had sustained a head injury, but not in healthy controls. These studies establish that frontoparietal regions are sensitive to structural changes after concussion. However, this was investigated in those with acute and subacute concussion, or those who recovered from the initial injury. Zivanovic et al. (Citation20) investigated cortical thickness in symptomatic youth who had a history of concussion compared to orthopedic controls, and found no differences between groups in thickness or volume. To our knowledge, there is an absence of the literature investigating potential anatomical changes in those suffering from persistent symptoms and PCS in female adults.
There is similarly a lack of research examining volume differences in subcortical regions, especially the cerebellum, a structure crucial to many aspects of daily living. Studies on moderate-to-severe brain injury have found cerebellar atrophy, even when it was not the location of focal injury (Citation21). In the same way, animal models on mTBI have also noted this decrease in cerebellar volume following injury (Citation22,Citation23). Yet, the effect of concussion on cerebellar volume is infrequently investigated in humans. One study noted no volume differences in any subcortical regions, including cerebellar lobules; however, this study only included males who sustained their concussion within the past three months (Citation16). A study by Ross et al. (Citation24) looked specifically at those with persistent concussive symptoms and found that, when compared to controls, those with PCS had greater atrophy over the course of a year in overall cerebellum volume. In addition, this atrophy correlated with poorer vocational outcomes in those with persistent symptoms. However, participants in this study included both males and females.
These human and animal model findings suggest that regions of the frontal and parietal lobe, as well as the cerebellum, are commonly affected following concussion. Therefore, it is reasonable to assume that behavioral tasks requiring these regions for performance would also be affected by the injury. As such, behavioral performance might demonstrate an indirect measure of the structural integrity of the underlying brain network. The frontoparietal-cerebellar network is essential for the visuomotor transformation required for reaching (Citation25–27), such as in cognitive-motor integration (CMI) tasks, in which a rule is used to align the required motor output and the guiding visual information (Citation28,Citation29). Previous studies from our laboratory have demonstrated deficits in CMI performance in those with a history of sport-related concussion including children and adolescents (Citation30), university-aged athletes (Citation31), and elite athletes (Citation32). Here, we seek to extend these findings to individuals with PCS, given the neurophysiological and behavioral findings in those with concussion history. The primary objective of this study was to investigate cortical volume and thickness differences as well as cerebellar volume differences in females suffering from PCS compared to healthy controls. Second, we aim to examine if these structural differences are associated with performance on a CMI task. We hypothesize that those with PCS will demonstrate behavioral deficits on a CMI task and exhibit structural deterioration in frontal, parietal, and cerebellar regions compared to healthy controls. As an exploratory measure, we examined whether or not changes to cerebellar and cortical regions of interest were related.
Materials and methods
Participants
Twenty-six female participants between the ages of 18–60 were included in this study; 13 with PCS and 13 age-matched (±1 year) healthy controls (average age = 30 ± 10.8). Thirteen participants had PCS, defined as 3 or more symptoms persisting for greater than 1 month after a concussive head injury (Citation6). PCS participants were included if their symptoms had persisted for 6 months or longer at the time of data collection (mean = 36 months). Thirteen age-matched controls (±1 year) were recruited with no self-reported history of concussion. A self-reported concussion was considered a concussive incident if there was either a diagnosis by a medical physician, or the date and mechanism of injury was recalled (Citation33). None of the participants had been diagnosed with a neurological disease, sustained their head injury due to a motor vehicle accident, or were deemed unsafe to undergo MR imaging. All participants were right-handed, with no injury (other than PCS) that would prevent them from participating in physical activity or sport. Upon examination of MR images, it was confirmed that none of the participants included in the study had any gross morphological abnormalities. Information about the concussive injury, including the number of previous concussions, and length of time since the concussion, was collected through a questionnaire.
This study was approved by York University research ethics committee, and all participants provided informed written consent.
Procedure
All participants completed a symptom evaluation, a computerized CMI task involving four visuomotor transformation conditions, and structural T1-weighted MR imaging.
Symptom evaluation
Symptoms were scored using the symptom evaluation embedded within the Sport Concussion Assessment Tool, 3rd Edition (SCAT3) (Citation33). The symptom inventory consists of 22 commonly reported symptoms that were self-rated on a 7-point Likert scale from 0 (no issue) to 6 (severe). Both the number of symptoms and the sum of all reported symptoms (the symptom severity score) were calculated, with a higher score reflecting worse symptom reporting.
Visuomotor task
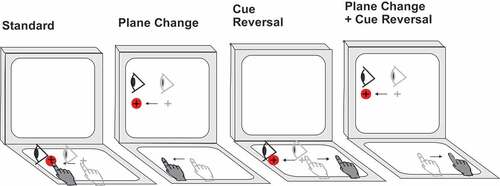
Participants completed four computer-based visuomotor transformation tasks that required reaching movements on a touch screen. These four conditions included one standard and three nonstandard (vision and action decoupled) conditions, which require cognitive-motor integration. Task conditions were presented on a 10.1” ASUS Transformer Book tablet connected to a 15” external monitor to allow for a screen in both the horizontal and vertical planes. Participants sat comfortably at a desk, with the monitor placed 70 cm from the tablet to ensure a consistent visual angle. All reaching movements were made on the tablet, which was placed at a 15° angle tilted upward toward the participant to allow for comfortable movements. In each condition, the participant was instructed to slide their index finger of their right (dominant) hand along the touch screen tablet in order to displace a cursor from a central target to one of the four peripheral targets (up, down, left, or right relative to center) as quickly and as accurately as possible. Participants guided a crosshair cursor, viewed on a black background, to the yellow central (or home) target, which changed to green when entered. After a 4000 ms center hold time, a red peripheral target was presented and the central target disappeared, which served as the ‘Go’ signal for the participant to initiate movement. Once the cursor reached and remained in the peripheral target for 500 ms, it disappeared, signaling the end of the trial. The next trial began with the presentation of the central target after an inter-trial interval of 2000 ms. Peripheral targets on the tablet were located 55 mm from the center target, with target diameters of 10 mm. In order to ensure smooth movement of the finger during the task, participants wore a capacitive-touch glove on their right hand.
Participants completed four conditions in a randomized block design. The four conditions were as follows: (i) the standard condition, in participants both looked at and moved on the tablet, thereby directly interacting with the targets; (ii) plane-change (PC), in which participants looked at the vertical monitor screen while moving on the horizontal tablet screen, requiring sensorimotor recalibration (CMI); (iii) cue reversal (CR), in which participants looked and moved on the tablet but the cursor feedback was rotated 180°, requiring explicit strategic control (CMI); and (iv) plane change with cue reversal (PC+CR), in which the prior two conditions were combined, thus requiring two levels of visual-motor decoupling (CMI). Four trials in each of the four directions were completed per condition for a total of 64 trials per participant (4 directions × 4 trials × 4 conditions). Eye movements were not measured during this experiment, however participants were instructed to look toward the target. Participants were provided a practice of 2 trials in each of the four directions prior to each condition to ensure familiarity of the task in order to obtain the greatest ability of each participant (see ).
Figure 1. Schematic drawing of the four visuomotor conditions.
Data processing
Custom-written (C++) acquisition software sampled the finger’s X-Y screen position at 55 Hz. Custom analysis software (Matlab, Mathworks Inc.) was used to process individual movement paths with a fourth-order (dual pass) low-pass Butterworth filter at 10 Hz. Filtered paths were used to generate a computerized velocity profile of each trial’s movement. Movement onsets and ballistic movement offsets (the initial movement prior to path corrections) were scored at 10% peak velocity, while total movement offsets (i.e. including path corrections) were scored as the final time point at which movement decreased back down to 10% peak velocity once the finger position was within the peripheral target. These profiles were then verified by visual inspection, and manually corrected if necessary. Trials were considered errors if the finger/cursor left the center target prior to the required center hold time (<4000 ms), reaction time was less than 150 ms or more than 8000 ms, or total movement time was more than 10000 ms. Trials in which the first ballistic movement exited the boundaries of the center target in the wrong direction (greater than 90° from a straight line to target) were coded as direction reversal errors, eliminated from further evaluation, and analyzed as a separate variable. The number of sub-movements, or corrective movements, was verified by visual inspection. These were defined as a decelerated movement followed by an accelerated movement throughout the movement trajectory. Both the first author researcher and a blinded researcher manually inspected and counted sub-movements, and the final measure was determined as the average between the scorers. The scored data were then processed to compute both movement timing and execution outcome measures. Trials in which one of the variables was greater than 2 standard deviations from the individual’s mean score were excluded from further analysis. The mean number of correct trials across all conditions was 15.15 ± 3.44 for the control group and 14.19 ± 3.15 for the PCS group. There was no statistical difference between the number of retained trials (T-Test, ρ = 0.14).
The kinematic variables for movement timing were as follows: 1) Reaction Time (RT), the time interval (milliseconds) between the central target disappearance and movement onset; 2) Total Movement Time (TMT), the time between movement onset and full movement offset (milliseconds); and 3) Peak Velocity (PV), the maximum velocity obtained during the movement (millimeter/millisecond). Kinematic variables for movement execution were: 1) Full Path Length (FPL), the total distance (resultant of the x and y trajectories) traveled between movement onset and offset (millimeters); 2) Absolute Error (AE, accuracy), the average distance from the individual ballistic movement endpoints (∑ x/n, ∑ y/n) to the actual target location (millimeters); 3) Variable Error (VE, precision), calculated as the distance between the individual ballistic movement endpoints (σ2) from their mean movement (millimeters); 4) The Percentage of Equal Trials (%Equal), determined by the percentage of correct trials in which the initial ballistic movement was equal to that of the full movement, resulting in one smooth movement; 5) Percent Sub-Movements (%SubMvt), the percent of correct trials in which sub-movements were present; 6) Number of Sub-Movements (#SubMvt), calculated as the average number of sub-movements per each correct trial; and 7) Direction Reversal errors (DR), the percent of total trials in which a direction reversal error occurred.
In order to minimize the number of variables for analyses, a composite score was calculated using a ‘simple averaging’ approach (Citation34). For each of the included variables, a z-score was calculated (using the control participants’ mean and standard deviation) and summed in order to create a timing, trajectory, and sub-movement composite score for each condition. For ease of interpretation, each composite score was transformed (based on a mean of 50 and a standard deviation of 10), with a higher score indicating worse performance. Each transformed score was tested for internal validity using Cronbach’s Alpha. This was then averaged across conditions for an overall measure of validity. The timing score consisted of three items: RT, TMT, and the inversed PV (PV z-score * −1) (α = 0.79). The trajectory composite score consisted of three items (AE, VE, FPL; α = 0.54), and the sub-movement composite score consists of two items (%Submvt, #Submvt; α = 0.77). Group analysis (PCS vs healthy control) was completed on each composite score for every condition (standard, PC, CR, PC+CR).
Behavioral data analysis
All data were checked for normal distribution (Shapiro-Wilk’s test) and homogeneity of variance (Levene’s test). Since the behavioral data were skewed, non-parametric tests were used. This was due to the homogeneity of variance, in that those with PCS demonstrated significantly greater variability compared to healthy controls on a number of behavioral measures. Statistical significance levels were set a-priori to p < 0.05. Statistical analyses were performed using SPSS statistical software (SPSS 24, IBM Corp).
The Mann-Whitney U-test was run to test the main effect of group (PCS, healthy control) on SCAT3 scores, and corrected for multiple comparisons using Holm-Bonferroni, thus significance was determined using a corrected value. Furthermore, the Mann-Whitney U-test was used to analyze composite scores between groups (PCS, healthy control) for each visuomotor task condition.
Imaging acquisition
MRI data were acquired using a 3 Tesla Siemens Tim Trio scanner at York University using a 32-channel head coil. High-resolution whole-brain T1-weighted images were obtained using 3D magnetization prepared rapid acquisition gradient echo (MP-RAGE; TR = 2300 ms, TE = 2.62 ms, slice thickness = 1.0 mm, voxel size = 1.0 mm3, FOV = 256 mm2, flip angle = 9°). A total of 192 sagittal slices were obtained, with no gap.
Imaging analysis: cortical volume & thickness
Cortical reconstruction and volumetric segmentation were performed using FreeSurfer imaging analysis software suite (Version 6.0, http://www.surfer.nmr.mgh.harvard.edu) (Citation35). Briefly, the processing steps included motion correction, removal of non-brain tissue, intensity normalization, tessellation of the gray matter white matter boundary, topology correction, registration to a spherical atlas, parcellation of the cerebral cortex, and calculation of cortical volume and thickness measures. The resulting parcellation was visually inspected and manually corrected, if required. The distance between the white and pial surfaces was used to determine the thickness at each cortical location (Citation36). The procedures for the calculation of cortical thickness have been validated against histological analysis and manual measurement (Citation37,Citation38). The gray matter volume was computed as the area of a vertex times the thickness. The morphometric procedures of FreeSurfer have demonstrated good test-retest reliability across scanner manufacturers and field strengths (Citation39).
The total intracranial volume (TIV) was calculated using the Oxford Center for Functional Magnetic Resonance Imaging of the Brain (FMRIB) Software Library (FSL, v5.0) (Citation40), which has been found to be a robust measure of total brain volume (Citation41,Citation42). First, the non-brain tissue is removed from the image using the brain extraction tool (BET) (Citation43) and is registered to a standard space (MNI152) using FMRIB’s Linear Image Registration Tool (FLIRT) (Citation44). Segmentation is completed using FMRIB’s Automated Segmentation Tool (FAST) (Citation45). The non-normalized (i.e. in subject space) total intracranial volume is calculated as total gray matter, white matter, and cerebrospinal fluid.
Global cortical thickness was compared between groups using Freesurfer (version 6.0). A z-distribution Monte Carlo simulation with 5,000 permutations was then applied to correct for multiple comparisons using a cluster-forming threshold of p < 0.01 (Citation46,Citation47).
In addition, the volume and thickness of cortical regions of interest were examined. These regions were determined a-priori and known to be involved in the frontoparietal network for visually guided reaching (Citation28,Citation48,Citation49). Regions in the parietal lobe included the right and left superior parietal lobe (SPL), inferior parietal lobe (IPL), and precuneus. In the frontal lobe, regions of interest included the right and left precentral, superior frontal, rostral middle frontal (rMFG), and caudal middle frontal (cMFG) regions. Finally, the cuneus, which is a region within the occipital lobe, was also investigated. Both the thickness and volume were extracted from each subject using the Desikan-Killiany cortical parcellation atlas (Citation50). The cortical parcellation of the FreeSurfer template was mapped back onto the individual subject and adjusted for small variations. The values of each individual subject’s thickness and volume of the aforementioned regions were then extracted and structural volumes were corrected for TIV using a proportion method.
Statistical analysis was then conducted using IBM SPSS Statistics (version 24). Data were checked for normality (Shapiro-Wilk’s) and homogeneity of variance (Levene’s). Non-parametric tests (Mann–Whitney U) were used to compare regional thickness and volume between groups (PCS, healthy control) due to violations of normality.
Imaging analysis: cerebellar volume & thickness
The cerebellum (including brainstem) was extracted using the Spatially Unbiased Atlas Template (SUIT) toolbox within the Statistical Parametric Mapping software (SPM12; http://www.fil.ion.ucl.ac.uk/spm/, installed in MATLAB version 2014, Natick, Massachusetts, The MathWorks, Inc), and left in subject space (Citation51). Total cerebellum volume (including total white matter and gray matter) was calculated using the Oxford Center for Functional Magnetic Resonance Imaging of the Brain (FMRIB) Software Library (FSL, v5.0) (Citation40). A ratio of cerebellum volume to brain size was then calculated as a proportion of the TIV (to account for differences in brain sizes between participants). The cerebellum was further parcellated into 28 lobules using SUIT-cerebellum within SPM12 (Citation52). The volume of each lobule was then corrected for TIV using a proportion method.
Total cerebellum volume and cerebellar lobule volumes (calculated as a proportion of total TIV) were analyzed using IBM SPSS statistics (version 24). Data were checked for normal distribution (Shapiro Wilks’) and homogeneity of variance (Levene’s). Due to the violations of normality, non-parametric tests (Mann–Whitney U) were used to compare the total cerebellum volume as well as cerebellar lobule volumes between groups (PCS, healthy controls).
Correlation analysis
Correlation analyses were run on collapsed group data. Data points that were greater than 3 standard deviations from the total group mean were considered outliers and removed from further analysis. Due to violations of normality, non-parametric correlation analyses (Spearman’s Rho) with bootstrapping (1000 samples) were used to investigate the associations between cortical thickness and cortical volume of each region of interest and both the number and severity of symptoms reported. Similarly, Spearman’s correlation analysis was run to explore the relationship between cortical thickness and volume to the composite performance scores (timing, trajectory, sub-movement) of each visuomotor task. The association between total cerebellum volume to both the number and severity of symptoms, as well as to each composite performance score was analyzed using Spearman’s Rho non-parametric correlation analysis. In addition, a Spearman’s correlation was run to investigate the relationship between the volumes of cerebellar lobules (in which a statistically significant group difference was found) and the number and severity of symptoms reported, as well as each composite performance score. Finally, the relationship between the volumes of each cortical region of interest and the volumes of cerebellar lobules in which there were significant group differences was analyzed using Spearman’s correlation analysis using IBM SPSS Statistics (version 24).
Results
Symptom evaluation
Those with PCS demonstrated a significantly greater number (Mdn = 11.0, U = 13.5, p < 0.001, r = 0.72) and severity (Mdn = 21.0, U = 16.0, p < 0.001, r = 0.64) of reported symptoms compared to healthy controls (Mdn = 2.0, Mdn = 2.0 respectively), thus confirming the PCS classification.
Visuomotor task
There were no statistically significant differences between groups on any of the composite performance scores (timing, trajectory, sub-movement) in any of the conditions of the visuomotor task (p > 0.05). When looking at median scores, we observed that the composite timing score in those with PCS had a higher score (and therefore worse performance) on each condition (). Similarly, for the sub-movement composite score those with PCS performed worse on each condition, except in the PC+CR condition. With the trajectory composite score, those with PCS had better performance (indicated by a lower median score) on the CMI conditions.
Table 1. Median scores between groups (PCS, healthy control) on kinematic variables of each visuomotor task condition.
Structural imaging
Cortical thickness & volume
There were no statistically significant differences between groups in whole-brain cortical thickness. When looking at the thickness of cortical regions of interest, the Mann-Whitney U-test revealed a statistically significant difference between PCS and healthy controls in the cortical thickness of both the left (U = 39.0, p = 0.02, r = 0.46) and right precuneus (U = 46.0, p = 0.048, r = 0.39). In both hemispheres, those with PCS demonstrated a significantly greater median thickness (left, Mdn = 2.59 mm; right Mdn = 2.63 mm) than controls (left, Mdn = 2.48 mm; right Mdn = 2.52 mm). No other statistically significant differences between groups were noted for measures of thickness.
The Mann-Whitney U-test was used to test the difference in cortical volume between groups (PCS, healthy control). A statistically significant difference between groups was found in the left precuneus (U = 39.0, p = 0.02, r = 0.46). Specifically, those with PCS had a significantly larger volume (Mdn = 0.0089 mm3) than healthy controls (Mdn = 0.0083 mm3). No other regions demonstrated a statistically significant difference between groups.
Cerebellum parcellation
The Mann-Whitney U-test revealed no statistically significant differences in the proportion of total cerebellum volume between those with PCS (Mdn = 0.216 mm3) and healthy controls (Mdn = 0.221 mm3; U = 52.0, p = 0.096).
When looking at the 28 lobules, the Mann-Whitney U-test found that those with PCS had a significantly smaller volume of left VIIIa (Mdn = 0.0052 mm3) compared to healthy controls (Mdn = 0.0057 mm3; U = 6.0, p = 0.048, r = 0.39). In addition, there was a statistically significant difference in volume percentage of the left VIIIb (U = 44.0, p = 0.038, r = 0.41), with those with PCS having a smaller volume (Mdn = 0.0043 mm3) compared to controls (Mdn = 0.0047 mm3). Similarly, compared to controls, those with PCS had a statistically smaller volume of both the right (U = 41.0, p = 0.026, r = 0.44; Mdn = 0.00081 mm3, Mdn = 0.00076 mm3 respectively) and left lobule X (U = 43.0, p = 0.033, r = 0.42; Mdn = 0.00034 mm3, Mdn = 0.00031 mm3 respectively).
Correlation analysis
provides a summary of significant correlations between brain and behavior.
Table 2. Correlation significance summary matrix for all relationships analyzed in the study. Light/dark red shading indicates positive correlations significant at the ρ = 0.05 /0.01 level, light/dark blue shading indicates negative correlations significant at the ρ = 0.05 /0.01 level, green/white shading indicates no significant difference at α = 0.05. For cortical structural correlationsCitation1,Citation17), lower left boxes indicate volume, upper right boxes indicate thickness. Only cerebellar lobules that showed significant group differences are included (Citation21,Citation24–)
. *:plane change condition, **:cue reversal condition, †:plane change & cue reversal condition. Tangerine cells with dark borders show correlations with behavioral performance.
Relationship between cortical regions of interest & symptoms
Spearman’s Rho correlation analysis revealed no significant associations between either the number or severity of symptoms reported and cortical thickness of any region (p > 0.05).
When looking at cortical volume, Spearman’s correlation demonstrated a statistically significant relationship between the volume of the left precuneus and the number of symptoms reported (rs = 0.412, p = 0.037, ), in that as the volume increased the number of reported symptoms also increased. There was no significant association between this region and the total severity of symptoms reported. Similarly, no other cortical regions demonstrated a significant correlation with either the number or severity of symptoms (p > 0.05).
Relationship between cortical regions of interest & visuomotor task performance
When looking at cortical thickness, Spearman’s correlation revealed no statistically significant relationship to any composite scores in either the standard condition or the PC condition. In the CR condition, there was a statistically significant association between the sub-movement score and the thickness of the left IPL (rs = −0.465, p = 0.026), such that as thickness increased the composite score decreased (denoting improved performance). Finally, in the PC+CR condition, significant associations were found between cortical thickness and timing, trajectory, and sub-movement scores. Specifically, the timing score was correlated with the thickness of the right IPL (rs = −0.424, p = 0.039), and similarly, the sub-movement score was also correlated with the right IPL (rs = −0.515, p = 0.010). Finally, the trajectory score was correlated with the thickness of the left precuneus (rs = −0.547, p = 0.006). In all regions, an increase in thickness was associated with a decrease in composite score, and thus improved performance.
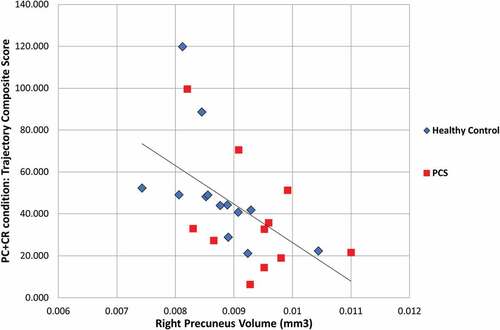
Spearman’s correlation was used to determine the association between the visuomotor composite scores and the volume of each of the cortical regions of interest. The correlation analysis demonstrated no statistically significant associations between any regional volume and composite scores of the standard condition. In the PC condition, significant associations were found between the sub-movement composite score and volume of the left (rs = −0.433, p = 0.031) and right SPL (rs = −0.4234, p = 0.035), and the left (rs = −0.4334, p = 0.031) and right (rs = −0.4234, p = 0.035) superior frontal region. In each region, it was found that as volume increased the sub-movement score decreased, which denotes improved performance. In the CR condition, Spearman’s correlation demonstrated only one significant association; the trajectory score was correlated with the right rMFG (rs = −0.4264, p = 0.043). Once again, as volume increased the trajectory score decreased. Finally, in the PC+CR condition, significant correlations were found between the composite trajectory score and the volume of the right IPL (rs = −0.4924, p = 0.015), the left rMFG (rs = −0.4294p = 0.037), and both the left (rs = −0.4054, p = 0.049) and right precuneus (rs = −0.6294, p = 0.001; ). Similarly, the sub-movement composite score was also associated with the volume of the right precuneus (rs = −0.5284, p = 0.008). In each case, an increase in volume was associated with a decrease in the composite score (and thus improved performance).
Figure 2. Relationship between the volume of the right precuneus and trajectory performance on the plane change + cue reversal condition.
Relationship between cerebellum lobule volumes & symptoms
Spearman’s correlation analysis revealed no statistically significant associations between the total cerebellum volume and either the number or severity of reported symptoms (p > 0.05). When looking at the lobules which differed significantly between groups (left VIIIa, left VIIIb, left X, right X), it was noted that the volume of the left VIIIa lobule was significantly correlated with both the number (rs = −0.4254, p = 0.030) and severity of symptoms (rs = −0.3934, p = 0.047). In both cases, the increase in the number or severity of symptoms was associated with a decrease in volume. No other statistically significant associations were found.
Relationship between cerebellum lobule volumes&visuomotor task performance
Spearman’s correlation analysis demonstrated no statistically significant associations between the total cerebellum volume and any of the performance composite scores (timing, trajectory, sub-movement) from any of the conditions of the visuomotor transformation task.
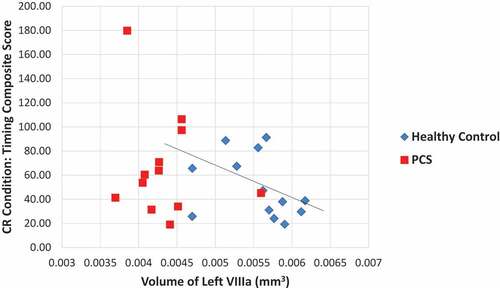
In the same way, no statistically significant correlations were noted between the cerebellar lobules and the composite scores in the standard condition. In the PC condition, Spearman’s correlation analysis revealed a statistically significant relationship between the timing composite score and volume of the left VIIIa lobule (rs = −0.4044, p = 0.045), in that as volume increased the timing score decreased (denoting improved performance). Likewise, in the CR condition, there was a significant correlation between the timing composite score and the left lobule VIIIa (rs = −0.4234, p = 0.044, ), where again as volume increased the timing score decreased. In this condition there was also a significant relationship between the composite trajectory score and the volume of the left lobules X (rs = 0.4384, p = 0.037). However, in this case as volume increased the trajectory score also increased (signifying worse performance). Finally, in the PC+CR condition, there were no statistically significant associations found.
Figure 3. Relationship between the volume of the left VIIIa lobule and timing performance on the cue reversal condition.
Relationship between cerebellum lobules & cortical regions of interest
Spearman’s correlation analysis was run on the total cerebellum volume and the volume of each of the cortical regions of interest. No statistically significant associations were found (p > 0.05).
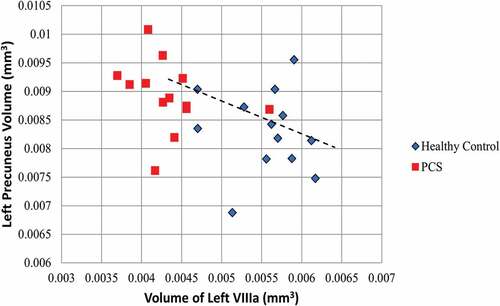
To investigate the relationship between the volume of the cerebellum lobules (left VIIIa, left VIIIb, left X, right X) and the volume of each of the cortical regions of interest, a Spearman’s Rho correlation analysis was used. A statistically significant association was revealed between the volume of the left lobule VIIIa and the left precuneus (rs = −0.4584, p = 0.018, ). Likewise, the volume of the left lobule VIIIb was significantly correlated with the volume of both the left (rs = −0.455, p = 0.020) and right precuneus (rs = −0.405, p = 0.040). In each case as the volume of cerebellar lobule (VIIIa, VIIIb) decreased, the volume of the precuneus increased. No other regions were found to be significantly associated.
Figure 4. Relationship between the volume of the left VIIIa lobule and the volume of the left precuneus.
Discussion
The results demonstrate that those with PCS have significantly thicker and larger gray matter volume of the precuneus when compared to healthy age-matched controls. In addition, those with PCS have a significantly smaller volume in cerebellar lobules including the left VIIIa, left VIIIb, left X, and right X. The volume of both the precuneus and the left lobule VIIIa are also both significantly associated with the number of self-reported symptoms. Furthermore, there was a significant relationship between the volume of the left lobule VIII (VIIIa and VIIIb) and the precuneus, where a smaller cerebellar lobule was associated with a larger precuneus volume. When looking at performance on the visuomotor tasks, there were no significant differences between the females with PCS and healthy controls. However, for the sub-movement composite score those with PCS performed worse on each condition, except in the PC+CR condition. With the trajectory composite score, those with PCS had better performance (indicated by a lower median score) on the CMI conditions. Thus, these findings may reflect a shift in the speed-accuracy tradeoff, in that those in the PCS group appear to have favored a more cautious slower-but-more-accurate strategy over speed. In addition, there was a significant correlation between the volume of the left lobule VIIIa and performance on tasks requiring CMI, such that as volume decreased, task performance decreased. Finally, performance on CMI tasks were also associated with both the volume and thickness of cortical regions of interest including both frontal (rMFG, superior frontal) and parietal regions (IPL, SPL, precuneus), across both groups.
Cortical regions of interest
No cortical regions demonstrated cortical thinning or decreased volume in those with PCS compared to controls. In contrast, those with PCS had a both a thicker and larger volume of the precuneus, a region located in the medial parietal cortex. These results do not support our initial hypothesis, in which we speculated that there would be a decrease in gray matter structure. However, previous research, in which cortical atrophy was noted, was conducted on acute, sub-acute, or asymptomatic individuals, and thus may not reflect the underlying neuropathology of those with persistent symptoms. A few studies have also found evidence of increased cortical volume or thickness following head-related injury (Citation53–55). Ware et al. (Citation55) found increased cortical thickness in acute pediatric concussion injury when compared to an orthopedic injury group. Specifically, this was seen in the left parietal region, including the precuneus. Comparably, Wang et al. (Citation54) looked at motor vehicle collision survivors who had sustained an mTBI compared to those who had not and found an initial increase in cortical thickness in both the left rMFG and right precuneus. While the thickness of the rMFG decreased over the 3 months following injury, the thickness of the precuneus did not. Furthermore, the precuneus thickness was positively correlated with the number of days of reduced daily activity, as well as the number of post-traumatic stress symptoms. It is possible then, that the increased thickness we found in our study is related to psychological distress or mental health, which is a large factor of post-concussion syndrome.
When looking at the literature of structural changes due to mental health the results are conflicting. Some studies have noted reductions in gray matter volume in those with depression (Citation56), while others have found a positive association between cortical thickness and the severity of depressive symptoms reported (Citation57). Brül et al. (Citation58) found a significantly greater cortical thickness in the right frontal and parietal lobes, including the DLPFC, SPL, IPL, and precuneus, in those with social anxiety disorder compared to healthy controls. The authors suggest this could reflect potential compensatory effects and deregulated networks. Because we did not assess for mental health factors or psychological distress, we cannot draw conclusions on whether the results of our study reflect differences in thickness due to the concussive injury itself or the psychological consequences associated with the injury. Yet, as suggested by Brül et al. (Citation58), the cortical thickness seen in our results may reflect a compensatory mechanism, which could be due to both the psychological effects and the physiological effects arising from the concussion itself.
Research has suggested that compensatory mechanisms also occur after brain injury. In a study on moderate-to-severe brain injury, an association was found between increased cortical thickness within the frontal, parietal, and temporal regions and slower reaction time on a working memory task (Citation59). In addition, fMRI results in this study found decreased activation within the frontal regions with greater activation in the posterior parietal regions compared to orthopedic injury controls, suggesting a greater reliance on posterior regions for task performance. Greater activity within brain regions outside of the core task regions has also been found following concussion (Citation60–64). For instance, Chen et al. (Citation63) looked at male athletes with persistent symptoms following concussion compared to healthy controls on a verbal memory task. They found that while the two groups did not differ on behavioral performance, those with persistent symptoms had differing brain activation during the task. Specifically, those with concussion had significantly decreased activation in the DLPFC, with a subsequent increase of activation in posterior frontal and parietal regions. This would suggest compensation by the brain in order to have normal behavioral performance.
In our study, we also found a lack of behavioral differences between groups, therefore, the increase in thickness and volume of the precuneus may reflect compensation by the brain for adequate behavioral performance, resulting in structural changes within this region. Further research that is longitudinal in nature is needed in order to test this theory.
Cerebellum volumes between groups
In addition to structural differences in the cortex, volume differences between those with PCS and healthy controls were also found within the cerebellum. Those with PCS had a significantly smaller volume of the left VIIIa, left VIIIb, left X, and right X lobules. Ross et al. (Citation24) had previously looked at subcortical structural changes in those with persistent symptoms following concussion, and found that over a course of a year these individuals had significantly greater atrophy of the cerebellum compared to controls. In our results, while we did not see a global difference of cerebellum volume compared to controls, we did find significantly smaller lobules, which were not investigated by this previous study.
Lobule X, also referred to as the flocculonodular lobe, is the vestibular area of the cerebellum (Citation27,Citation65,Citation66). This lobule receives inputs directly from the vestibular nerve (cranial nerve 8) and indirectly from the vestibular nuclei, and sends output directly to the vestibular nuclei. The medial aspect of the flocculonodular lobe is involved in controlling axial musculature, while the lateral component is involved in eye pursuit and the vestibulo-ocular reflex (VOR). This reflex allows for the compensatory counter-rotation of the eyes during head movement (Citation27,Citation65,Citation66) and has been found to be abnormal following concussion (Citation67,Citation68). Additionally, an abnormal VOR reflex has been associated with a significantly longer recovery following injury (Citation68). However, VOR function was not measured in this study and thus, conclusions on this possible relationship cannot be drawn from these data.
Lobules VIIIa and VIIIb are located in the inferior posterior cerebellum and are considered part of the cortico-cerebellar motor loop (Citation69,Citation70). It has been suggested that there are two motor representations of the body in the cerebellum, the first located in the anterior lobe, and the second in lobule VIII (Citation71–73). Imaging studies have found that lobule VIII is functionally connected to sensory and motor cortical areas, including the primary motor cortex (M1), primary somatosensory cortex (S1), and the premotor cortex (PMC) (Citation71,Citation74). In addition, activation of both VIIIa and VIIIb has been found during basic sensorimotor tasks and, in particular, hand-reaching tasks (Citation69,Citation71). Anatomically, the posterior lobe of the cerebellum receives fibers from the cortical association areas, including prefrontal (PFC) and posterior parietal cortex (PPC) (Citation72). Specifically, it is the lateral cerebellar hemisphere which is reciprocally and indirectly connected to the cortex, with inputs mostly from the parietal lobe, and outputs terminating in PMC and M1 (Citation66). The majority of these cerebro-cerebellar pathways are contralateral; however, 10–30% of these projections are ipsilateral. As such, the right cerebellar hemisphere is associated with language, while the left is associated with visuospatial performance (Citation69,Citation72). This may explain our findings, in which only the left, and not the right, lobules VIIIa and VIIIb demonstrated differences between groups.
Lastly, Meabon et al. (Citation23) investigated the effects of mild blast injuries on the cerebellum in murine models and found that the ventral areas of the cerebellum were most vulnerable to injury resulting in significantly greater Purkinje cell loss in these regions. Specifically, these vulnerable ventral regions included lobules VII through to X. Therefore, the results from the present study, in which lobules VIII and X demonstrated decreased volume in those with PCS compared to controls, supports these findings.
Cerebellum lobules & visuomotor task performance
In addition to group differences, it was found that the VIIIa lobule in the left cerebellar hemisphere was significantly correlated to the number and severity of symptoms reported, as well as timing scores in visuomotor tasks requiring CMI. This finding is unsurprising given this lobule’s role in the cortico-cerebellar motor loop that is activated with sensorimotor tasks, including reaching tasks (Citation69,Citation71). In addition, it is known that the left hemisphere is associated with visuospatial tasks, which is an important component of our visually guided reaching tasks (Citation69,Citation72). Further, the cerebellum plays a large role in movement timing (Citation75), with the medial region of the cerebellar hemispheres associated with the implementation of a timed response and the lateral cerebellar hemisphere involved with the operations of the timing process (Citation76). Lesions to the cerebellar hemispheres result in deficits in motor planning, delays in movement onset, and irregularities in timing (Citation66). The results of our study add to these findings, with the volume of lobule VIIIa related to timing performance on visuomotor reaching tasks.
Cortical regions of interest, cerebellar volumes, & visuomotor task performance
We observed that the thickness and volume of cortical regions was significantly correlated with performance on CMI-based tasks. An improved execution of movement, demonstrated through improved performance on both the trajectory and sub-movement composite scores, was associated with an increased volume or thickness of cortical regions. These findings reflect the general relationship between cortical regions required to perform nonstandard visuomotor tasks and behavioral execution on these tasks. Specifically, the PC task was significantly associated with the SPL and the superior frontal region, the CR task was associated with the IPL and right rMFG, while the PC+CR task was associated with the IPL, rMFG, and precuneus.
The association between performance on the PC visuomotor condition and the thickness of the SPL and superior frontal regions is supported by the literature. The PC condition requires implicit sensorimotor recalibration due to the dissociation between the plane of vision and the plane of action (Citation77,Citation78). Both the SPL and the superior frontal regions are integral in nonstandard reaching actions which require this spatial recalibration (Citation25,Citation29). During reaching movements, the SPL is responsible for the proprioceptive guidance of movement, or knowing where the arm is located in space (Citation25,Citation27). This is demonstrated in patients with optic ataxia (lesion of the SPL) as they are unable to reach toward objects efficiently. When performing nonstandard visuomotor tasks requiring sensorimotor recalibration, Granek et al. (Citation79,Citation80) found that those with SPL damage required increased reliance on visual guidance due to the decrease in proprioceptive feedback. Further, on a comparable task paradigm to ours, Hawkins et al. (Citation81) found a change in neural discharge within the SPL in the PC condition, but not the CR condition, highlighting the importance of this structure in nonstandard mapping, specifically when sensorimotor recalibration is required. Our results also found that performance on the PC condition was associated with the superior frontal region, which includes the dorsal pre-motor (PMd) and medial motor areas (supplementary motor area, SMA; cingulate motor area, CMA). Medial motor areas are responsible for internally guided behavior, as well as planning and remembering motor sequences, while the PMd is an important link between the non-spatial aspects of sensory cues and the motor response (Citation27,Citation29). The PMd has been shown to play an important role in the selection of an action based on nonstandard visuomotormapping (Citation82). Interestingly, one of the largest inputs to the PMd is the SPL, and thus these regions play a role in tasks requiring implicit nonstandard mapping (Citation25,Citation83).
In comparison, performance on the CR task was associated with the IPL and the rMFG. While this also requires nonstandard mapping, in contrast to the implicit rules required for performance on the PC task, the CR condition requires an explicit rule for successful performance (Citation77,Citation78). That is, one must use strategic control in order to dissociate vision from action. The prefrontal cortex is essential for this strategic control and goal-directed behavior as these regions use rules in order to interpret the sensory inputs and associate them with the appropriate motor action (Citation27,Citation84). This “top-down” processing is especially important when multiple responses are possible as it establishes the mappings required to perform the task and guides the appropriate response. The prefrontal cortex does this through the implementation of attentional templates, rules, and goals (Citation84). In particular, the rMFG, which includes both the DLPFC and the ventrolateral pre-frontal cortex (VLPFC), is important for the strategic control required in our task. These regions have reciprocal connections with visual and motor regions including the cerebellum, PMC, and IPL (Citation84). Unlike the SPL, which is essential for spatial guidance using proprioceptive cues, the IPL is responsible for spatial attention, or devoting attentional resources to a specific region in space (Citation85,Citation86). A lesion of the IPL leads to hemispatial neglect and deficits in the ability to direct attention to portions of extrapersonal space (Citation85). The IPL is not only anatomically connected to prefrontal regions but also to the cerebellum and PMC (Citation27,Citation87). Previous work in our laboratory has also demonstrated that these regions are important for nonstandard mapping requiring strategic control (Citation88,Citation89). Increased activation of both the IPL and the rMFG regions was noted in a comparable feedback reversal task. It is not surprising then that we observed relationships between structural measures in these regions and performance on the CMI task requiring explicit rule-based control.
Finally, the performance on the PC+CR task was associated with the volume and thickness of the IPL, rMFG, and precuneus. The PC+CR task requires two levels of decoupling, both the implicit sensorimotor recalibration (hand in one spatial location, visual guidance in another) and the explicit strategic control (incorporating a rule, e.g., move hand rightward to direct cursor leftward). Therefore, as previously mentioned, the relationship between this task and both the IPL and rMFG is in agreement with current literature (Citation84,Citation85) and the previous findings from our laboratory (Citation88,Citation89). The precuneus, which is located in the medial parietal cortex, is reciprocally connected with both the lateral parietal regions (SPL, IPL) and frontal regions (DLPFC, PMC, medial motor areas) (Citation90). While the exact role of the precuneus is still relatively unknown, it is believed to be a crucial aspect of the neural network specialized for visually guided movement (Citation90). In particular, the precuneus is activated during shifting of attention, as opposed to sustained attention in the IPL. Furthermore, it plays a role in creating an internal representation of movement, such as with visual rotation (Citation90). The role of the precuneus in visuomotor transformation tasks has previously been demonstrated in our laboratory. In a recent study, Gorbet et al. (Citation91) found that activation of this region was able to discriminate between tasks requiring CMI and standard reaching tasks.
Interestingly, our results found a statistically significant correlation between the volume of the precuneus and the volume of the cerebellar lobule VIII (both VIIIa and VIIIb). Specifically, a decreased volume of these cerebellar lobules was associated with an increased volume of the precuneus. Churchill et al. (Citation92) found that the precuneus and posterior cerebellum were able to distinguish those who had a more severe history of concussion, including those who had a history of multiple concussions and a longer recovery from the most recent injury. Furthermore, those who had a more severe concussive history demonstrated hypoconnectivity between the precuneus and the cerebellum, with both regions showing hyperconnectivity with associated prefrontal and motor regions. The authors speculate that this change in functional connectivity reflects a compensatory mechanism for adequate behavioral performance (Citation92).
Thus, we suggest that the structural changes seen in the precuneus in the present study may underlie the successful performance of our complex visuomotor task in the face of our observed cerebellar atrophy in those with PCS, which in the healthy brain is crucial for this type of skill.
Limitations & future studies
Our study is one of the first studies to investigate structural differences in those with PCS compared to healthy controls, specifically within the lobules of the cerebellum; however, it is not without limitations. First, because this study is cross-sectional in design, a causal link between the injury and structural changes cannot be made. However, a number of previous longitudinal studies have found structural changes due to concussion, and thus it seems likely to be the underlying cause of the structural differences found in our study. Due to the controversial findings of structural changes due to psychological factors, it would be important to repeat this study investigating this aspect in order to understand how mental health affects both structure and performance on the behavioral task. Second, with 13 individuals in each group, the sample size is a limitation. Finally, repeating this study with a greater sample size and with men would make the results more generalizable, and explore potential sex-related differences in response to concussion. Current studies in our laboratory are incorporating functional MRI in order to better understand if behavioral compensation is resulting in structural changes.
Conclusion
In summary, we found that those with PCS had a significantly larger volume and thickness of the precuneus. In addition, within the cerebellum, those with PCS had a significantly smaller volume of lobules left VIIIa, left VIIIb, and both the left and right lobule X. Furthermore, the volume of lobule VIII was correlated with precuneus volume, and both were correlated with symptom reporting. While there were no behavioral differences between groups on the CMI visuomotor transformation tasks, performance on these tasks was correlated with multiple cortical and cerebellar regions, highlighting the importance of the frontoparietal-cerebellar network for task performance. Finally, the lack of behavioral differences combined with the structural differences in those with PCS may reflect a compensatory mechanism. These findings align with, and thus strengthen, previous literature which found a neurological compensation following injury (Citation60,Citation62,Citation63,Citation92).
Acknowledgments
The authors wish to acknowledge the invaluable MRI technical support provided by Joy Williams. This work was supported by a Canadian Institutes of Health Research projectgrant (LS), and by York Research Chair support from the Vision: Science to Applications
program funded by Canada First Research Excellence Fund (CIHR #125915) (LS).
Disclosure statement
No potential conflict of interest was reported by the author(s).
Additional information
Funding
References
- Centers for Disease Control and Prevention (CDC). Nonfatal traumatic brain injuries from sports and recreation activities — united States, 2001-2005. Morb Mortal Wkly Rep. 2007;56(29):733–37.
- Harmon KG, Drezner JA, Gammons M, Guskiewicz M, Halstead M, Herring SA, Kutcher JS, Pana A, Putukian M, Roberts WO. American medical society for sports medicine position statement: concussion in sport. Br J Sports Med. 2013;47(1):15–26.doi:10.1136/bjsports-2012-091941.
- McCrory P, Meeuwisse W, Dvorak J, Aubry M, Bailes J, Broglio S, Cantu RC, Cassidy D, Echemendia RJ, Castellani RJ, et al. Consensus statement on concussion in sport — the 5th international conference on concussion in sport held in Berlin, october 2016. Br J Sports Med. 2017;51(11):838–47.doi:10.1136/bjsports-2017-097699.
- World Health Organization (WHO). The ICD-10 classification of mental and behavioural disorders. Genève, Switxerland; 1992. 67–68p.
- American Psychiatric Association. Diagnostic and statistical manual of mental disorders. Washington DC: IV-TR; 2000. p. 760–62.
- Tator CH, Davis HS, Dufort PA, Tartaglia MC, Davis KD, Ebraheem A, Hiploylee C. Postconcussion syndrome: demographics and predictors in 221 patients. J Neurosurg. 2016;125(5):1206–16.doi:10.3171/2015.6.JNS15664.
- Hiploylee C, Dufort PA, Davis HS, Wennberg RA, Tartaglia MC, Mikulis D, Hazrati L-N, Tator C. Longitudinal study of postconcussion syndrome: not everyone recovers. J Neurotrauma. 2017;34(8):1511–23.doi:10.1089/neu.2016.4677.
- National Center for Injury Prevention and Control. Report to congress on mild traumatic brain injury in the United States: steps to prevent a serious public health problem. Atlanta, GA: Centers for Disease Control and Prevention; 2003.
- Evans RW. Persistent post-traumatic headache, postconcussion syndrome, and whiplash injuries: the evidence for a non-traumatic basis with an historical review. Headache. 2010;50(4):716–24.doi:10.1111/j.1526-4610.2010.01645.x.
- Ryan LM, Warden DL. Post concussion syndrome. Int Rev Psychiatry. 2003;15(4):310–16.doi:10.1080/09540260310001606692.
- Silverberg ND, Iverson GL. Etiology of the post-concussion syndrome: physiogenesis and psychogenesis revisited. NeuroRehabilitation. 2011;29(4):317–29.doi:10.3233/NRE-2011-0708.
- Bigler ED. Neuropsychology and clinical neuroscience of persistent post-concussive syndrome. J Int Neuropsychol Soc. 2008;14(1):1–22.doi:10.1017/S135561770808017X.
- Giza CC, Hovda DA. The new neurometabloic cascade of concussion. Neurosurgery. 2015;75(Supplement 4):S24–33.doi:10.1227/NEU.0000000000000505.
- Warner MA, Youn TS, Davis T, Chandra A, Marquez de la Plata C, Moore C, Harper C, Madden CJ, Spence J, McColl R, et al. Regionally selective atrophy after traumatic axonal injury. Arch Neurol. 2010;67(11):1336–44.doi:10.1001/archneurol.2010.149.
- Urban K, Riggs L, Wells G, Keightley M, Chen J-K, Ptito A, Fait P, Taha T, Sinopoli KJ. Cortical thickness changes and thier relationship to dual-task performance following mild traumatic brain injury in youth. J Neurotrauma. 2017;34(4):816–23.doi:10.1089/neu.2016.4502.
- Sussman D, Chakravarty MM, Pang EW, Taylor MJ, Dunkley BT, Dunkley BT. Concussion induces focal and widespread neuromorphological changes. Neurosci Lett. 2017;650:52–59.doi:10.1016/j.neulet.2017.04.026.
- Hayes JP, Logue MW, Sadeh N, Spielberg JM, Verfaellie M, Hayes SM, Reagan A, Salat DH, Wolf EJ, McGlinchey RE, et al. Mild traumatic brain injury is associated with reduced cortical thickness in those at risk for Alzheimer’s disease. Brain. 2017;140(3):813–25.doi:10.1093/brain/aww344.
- Zhou Y, Kierans A, Kenul D, Ge Y, Rath J, Reaume J, Grossman RI, Lui YW. Mild traumatic brain injury: longitudinal regional brain volume changes. Radiology. 2013;267(3):880–90.doi:10.1148/radiol.13122542.
- Govindarajan KA, Narayana PA, Hasan KM, Wilde EA, Levin HS, Hunter JV, Miller ER, Patel VKS, Robertson CS, McCarthy JJ. Cortical thickness in mild traumatic brain injury. J Neurotrauma. 2016;33(20):1809–17.doi:10.1089/neu.2015.4253.
- Zivanovic N, Virani S, Rajaram AA, Lebel C, Yeates KO, Brooks BL. Cortical volume and thickness in youth several years after concussion. J Child Neurol. 2021;36(3):186–94.doi:10.1177/0883073820962930.
- Spanos GK, Wilde EA, Bigler ED, Cleavinger HB, Fearing MA, Levin HS, Levin HS, Li X, Hunter JV. Cerebellar atrophy after moderate-tosevere pediatric traumatic brain injury. Am J Neuroradiol. 2007;28(3):537–42.
- Kan E, Ling E, Lu J. Long term manifestation of cerebellar biochemical, histopathological and functional changes after mild and severe fluid percussion injury in rodents. In: Neuroscience Meeting Planner.Society for Neuroscience Conference; 2013 Nov 9-13; San Diego CA.
- Meabon JS, Huber BR, Cross DJ, Richards TL, Minoshima S, Pagulayan KF, Meeker KD, Kraemer BC, Petrie EC, Raskine MA, et al. Repetitive blast exposure in mice and combat veterans causes persistent cerebellar dysfunction. Sci Transl Med. 2016;8(321):1–16.doi:10.1126/scitranslmed.aaa9585.
- Ross DE, Ochs AL, Seabaugh JM, DeMark MF, Shrader CR, Marwitz JH, Havranek MD. Progressive brain atrophy in patients with chronic neuropsychiatric symptoms after mild traumatic brain injury: a preliminary study. Brain Inj. 2012;26(12):1500–09.doi:10.3109/02699052.2012.694570.
- Wise SP, Boussaoud D, Johnson PB, Caminiti R. Premotor and parietal cortex: corticocortical connectivity and combinatorial computations. Annu Rev Neurosci. 1997;20(1):25–42.doi:10.1146/annurev.neuro.20.1.25.
- Sabes PN. The planning and control of reaching movements. Curr Opin Neurobiol. 2000;10(6):740–46.doi:10.1016/S0959-4388(00)00149-5.
- Kandel ER, Schwartz JH, Jessell TM, Siegelbaum SA, Hudspeth A, editors. Principles of Neural Science. 5th ed. New York (NY): McGraw-Hill; 2000.
- Sergio L, Gorbet D, Tippett W, Yan X, Neagu B. When what you see isn’t where you get: cortical mechanisms of vision for complex action. In: Jenkin M, Harris L, editors. Cortical mechanisms of vision. Cambridge (UK): Cambridge University Press; 2009. p. 81–118.
- Wise S, Di Pellegrino G, Boussaoud D. The premotor cortex and nonstandard sensorimotor mapping. Can J Physiol Pharmacol. 1996;74(4):469–82.doi:10.1139/cjpp-74-4-469.
- Dalecki M, Albines D, Macpherson A, Sergio LE. Prolonged cognitive–motor impairments in children and adolescents with a history of concussion. Concussion. 2016;1(3):CNC14.doi:10.2217/cnc-2016-0001.
- Brown J, Dalecki M, Hughes C, Macpherson AK, Sergio LE. Cognitive-motor integration deficits in young adult athletes following concussion. BMC Sports Sci Med Rehabil. 2015;7(25). doi:10.1186/s13102-015-0019-4.
- Hurtubise J, Gorbet D, Hamandi Y, Macpherson A, Sergio L. The effect of concussion history on cognitive-motor integration in elite hockey players. Concussion. 2016;1(3):CNC17.doi:10.2217/cnc-2016-0006.
- McCrory P, Meeuwisse WH, Aubry M, Cantu B, Dvořák J, Echemendia RJ, Engebretsen L, Johnston K, Kutcher JS, Raftery M, et al. Consensus statement on concussion in sport: the 4th international conference on concussion in sport held in Zurich, november 2012. Br J Sports Med. 2013;47(5):250–58.doi:10.1136/bjsports-2013-092313.
- Song M-K, Lin F-C, Ward SE, Fine JP. Composite variables: when and how. Nurs Res. 2013;62(1):45–49.doi:10.1097/NNR.0b013e3182741948.
- Fischl B. FreeSurfer. Neuroimage. 2012;62(2):774–81.doi:10.1016/j.neuroimage.2012.01.021.
- Fischl B, Dale A. Measuring the thickness of the human cerebral cortex from magnetic resonance images. Proc Natl Acad Sci. 2000;97(20):11050–55.doi:10.1073/pnas.200033797.
- Cardinale F, Chinnici G, Bramerio M, Mai R, Sartori I, Cossu M, Lo Russo G, Castana L, Colombo N, Caborni C, et al. Validation of FreeSurfer-estimated brain cortical thickness: comparison with histologic measurements. Neuroinformatics. 2014;12(4):535–42.doi:10.1007/s12021-014-9229-2.
- Rosas HD, Liu AK, Hersch S, Glessner M, Ferrante RJ, Salat DH, van der Kouwe A, Jenkins BG, Dale AM, Fischl B. Regional and progressive thinning of the cortical ribbon in Huntington’s disease. Neurology. 2002;58(5):695–701.doi:10.1212/WNL.58.5.695.
- Han X, Jovicich J, Salat D, van der Kouwe A, Quinn B, Czanner S, Busa E, Pacheco J, Albert M, Killinay R, et al. Reliability of MRI-derived measurements of human cerebral cortical thickness: the effects of field strength, scanner upgrade and manufacturer. Neuroimage. 2006;32(1):180–94.doi:10.1016/j.neuroimage.2006.02.051.
- Jenkinson M, Beckmann CF, Behrens TEJ, Woolrich MW, Smith SM. FSL. Neuroimage. 2012;62(2):782–90.doi:10.1016/j.neuroimage.2011.09.015.
- Tudorascu DL, Karim HT, Maronge JM, Alhilali L, Fakhran S, Aizenstein HJ, Muschelli J, Crainiceanu CM. Reproducibility and bias in healthy brain segmentation: comparison of two popular neuroimaging platforms. Front Neurosci. 2016;10:1–8.doi:10.3389/fnins.2016.00503.
- Pérez ARP Accurate segmentation of brain MR images [ thesis]. Göteborg (Sweden): Chalmers University of Technology; 2010.
- Smith SM. Fast robust automated brain extraction. Hum Brain Mapp. 2002;17(3):143–55.doi:10.1002/hbm.10062.
- Jenkinson M, Bannister P, Brady M, Smith S. Improved optimization for the robust and accurate linear registration and motion correction of brain images. Neuroimage. 2002;17(2):825–41.doi:10.1006/nimg.2002.1132.
- Zhang Y, Smith S, Brady M. Segmentation of brain MR images through a hidden markov random field model and the expectation-maximization algorithm. IEEE Trans Med Imaging. 2001;20(1):45–57.doi:10.1109/42.906424.
- Greve DN, Fischl B. False positive rates in surface-based anatomical analysis. Neuroimage. 2018;171:6–14.doi:10.1016/j.neuroimage.2017.12.072.
- Hagler DJ, Saygin AP, Sereno MI. Smoothing and cluster thresholding for cortical surface-based group analysis of fMRI data. Neuroimage. 2006;33(4):1093–103.doi:10.1016/j.neuroimage.2006.07.036.
- Gorbet DJ, Staines WR, Sergio LE. Brain mechanisms for preparing increasingly complex sensory to motor transformations. Neuroimage. 2004;23(3):1100–11.doi:10.1016/j.neuroimage.2004.07.043.
- Granek JA, Sergio LE. Evidence for distinct brain networks in the control of rule-based motor behavior. J Neurophysiol. 2015;114(2):1298–309.doi:10.1152/jn.00233.2014.
- Desikan RS, Ségonne F, Fischl B, Quinn BT, Dickerson BC, Blacker D, Buckner RL, Dale AM, Maguire RP, Hyman BT, et al. An automated labeling system for subdividing the human cerebral cortex on MRI scans into gyral based regions of interest. Neuroimage. 2006;31(3):968–80.doi:10.1016/j.neuroimage.2006.01.021.
- Diedrichsen J. A spatially unbiased atlas template of the human cerebellum. Neuroimage. 2006;33(1):127–38.doi:10.1016/j.neuroimage.2006.05.056.
- Diedrichsen J, Balsters JH, Flavell J, Cussans E, Ramnani N. A probabilistic MR atlas of the human cerebellum. Neuroimage. 2009;46(1):39–46.doi:10.1016/j.neuroimage.2009.01.045.
- Albaugh MD, Orr C, Nickerson JP, Zweber C, Slauterbeck JR, Hipko S, Gonyea J, Andrews T, Brackenbury JC, Watts R, et al. Postconcussion symptoms are associated with cerebral cortical thickness in healthy collegiate and preparatory school ice hockey players. J Pediatr. 2015;166(2):394–400.doi:10.1016/j.jpeds.2014.10.016.
- Wang X, Xie H, Cotton AS, Tamburrino MB, Brickman KR, Lewis TJ, McLean SA, Liberzon I. Early cortical thickness change after mild traumatic brain injury following motor vehicle collision. J Neurotrauma. 2015;32(7):455–63.doi:10.1089/neu.2014.3492.
- Ware AL, Goodrich-Hunsaker NJ, Lebel C, Shukla A, Wilde EA, Abildskov TJ, Biger ED, Cohen DM, Mihalov LK, Bacevice A, et al. Post-acute cortical thickness in children with mild traumatic brain injury versus orthopedic injury. J Neurotrauma. 2020;37(17):1892–901.doi:10.1089/neu.2019.6850.
- Grieve SM, Korgaonkar MS, Koslow SH, Gordon E, Williams LM. Widespread reductions in gray matter volume in depression. NeuroImage Clin. 2013;3:332–39.doi:10.1016/j.nicl.2013.08.016.
- Szymkowicz SM, McLaren ME, Kirton JW, O’Shea A, Woods AJ, Manini TM, Anton SD, Dotson VM. Depressive symptom severity is associated with increased cortical thickness in older adults. Int J Geriatr Psychiatry. 2016;31(4):325–33.doi:10.1002/gps.4324.
- Brühl AB, Hänggi J, Baur V, Rufer M, Delsignore A, Weidt S, Jäncke L, Herwig U. Increased cortical thickness in a frontoparietal network in social anxiety disorder. Hum Brain Mapp. 2014;35(7):2966–77.doi:10.1002/hbm.22378.
- Wilde EA, Newsome MR, Bigler ED, Pertab J, Merkley TL, Hanten G, Scheibel RS, Li X, Chu Z, Yallampalli R, et al. Brain imaging correlates of verbal working memory in children following traumatic brain injury. Int J Psychophysiol 2011;82:86–96.
- McCrea M, Meier T, Huber D, Ptito A, Bigler E, Debert CT, Manley G, Menon D, Chen J-K, Wall R, et al. Role of advanced neuroimaging, fluid biomarkers and genetic testing in the assessment of sport-related concussion: a systematic review. Br J Sports Med. 2017;51(12):919–29.doi:10.1136/bjsports-2016-097447.
- Esopenko C, Kumar P, Alain C, Chow T, McIntosh A, Strother S, Levine B. Neuroimaging during a working memory task in remote traumatic brain injury: evidence from NHL alumni. In: 20th Annual Meeting of the Cognitive Neuroscience Society; 2013 April; B60. San Francisco, California.
- Chamard E, Lichtenstein JD. A systematic review of neuroimaging findings in children and adolescents with sports-related concussion. Brain Inj. 2018;9052:1–16.
- Chen JK, Johnston KM, Frey S, Petrides M, Worsley K, Ptito A. Functional abnormalities in symptomatic concussed athletes: an fMRI study. Neuroimage. 2004;22(1):68–82.doi:10.1016/j.neuroimage.2003.12.032.
- Chen JK, Johnston KM, Collie A, McCrory P, Ptito A. A validation of the post concussion symptom scale in the assessment of complex concussion using cognitive testing and functional MRI. J Neurol Neurosurg Psychiatry. 2007;78(11):1231–38.doi:10.1136/jnnp.2006.110395.
- Bodranghien F, Bastian A, Casali C, Hallett M, Louis ED, Manto M, Mariën P, Nowak DA, Schmahmann JD, Serrao M, et al. Consensus paper: revisiting the symptoms and signs of cerebellar syndrome. Cerebellum. 2016;15(3):369–91.doi:10.1007/s12311-015-0687-3.
- Roostaei T, Nazeri A, Sahraian MA, Minagar A. The human cerebellum: a review of physiologic neuroanatomy. Neurol Clin. 2014;32(4):859–69.doi:10.1016/j.ncl.2014.07.013.
- Yorke AM, Smith L, Babcock M, Alsalaheen B. Validity and reliability of the vestibular/ocular motor screening and associations with common concussion screening tools. Sports Health. 2017;9(2):174–80.doi:10.1177/1941738116678411.
- Corwin DJ, Wiebe DJ, Zonfrillo MR, Grady MF, Robinson RL, Goodman AM, Master CL. Vestibular deficits following youth concussion. J Pediatr. 2015;166(5):1221–25.doi:10.1016/j.jpeds.2015.01.039.
- Stoodley CJ, Schmahmann JD. Functional topography in the human cerebellum: a meta-analysis of neuroimaging studies. Neuroimage. 2009;44(2):489–501.doi:10.1016/j.neuroimage.2008.08.039.
- Xue A, Kong R, Yang Q, Eldaief MC, Angeli PA, DiNicola LM, Braga RM, Bucker RL, Yeo BTT. The detailed organization of the human cerebellum estimated by intrinsic functional connectivity within the individual. J Neurophysiol. 2021;125(125):358–84.doi:10.1152/jn.00561.2020.
- Stoodley CJ. The cerebellum and cognition: evidence from functional imaging studies. Cerebellum. 2012;11(2):352–65.doi:10.1007/s12311-011-0260-7.
- Stoodley CJ, Schmahmann JD. Evidence for topographic organization in the cerebellum of motor control versus cognitive and affective processing. Cortex. 2010;46(7):831–44.doi:10.1016/j.cortex.2009.11.008.
- Grodd W, Hülsmann E, Lotze M, Wildgruber D, Erb M. Sensorimotor mapping of the human cerebellum: fMRI evidence of somatotopic organization. Hum Brain Mapp. 2001;13(2):55–73.doi:10.1002/hbm.1025.
- Krienen FM, Buckner RL. Segregated fronto-cerebellar circuits revealed by intrinsic functional connectivity. Cereb Cortex. 2009;19(10):2485–97.doi:10.1093/cercor/bhp135.
- Ivry RB, Keele SW. Timing functions of the cerebellum. J Cogn Neurosci. 1989;1(2):136–52.doi:10.1162/jocn.1989.1.2.136.
- Ivry RB, Keele SW, Diener HC. Dissociation of the lateral and medial cerebellum in movement timing and movement execution. Exp Brain Res. 1988;73(1):167–80.doi:10.1007/BF00279670.
- Clower D, Boussaoud D. Selective use of perceptual recalibration versus visuomotor skill acquisition. J Neurophysiol. 2000;84(5):2703–08.doi:10.1152/jn.2000.84.5.2703.
- Redding GM, Wallace B. Adaptive spatial alignment and strategic perceptual-motor control. J Exp Psychol Hum Percept Perform. 1996 Apr;22(2):379–94. doi:10.1037/0096-1523.22.2.379.
- Granek JA, Pisella L, Stemberger J, Vighetto A, Rossetti Y, Sergio L, Balasubramaniam R. Decoupled visually-guided reaching in optic ataxia: differences in motor control between canonical and non-canonical orientations in space. PLoS One. 2013;8(12):e86138.doi:10.1371/journal.pone.0086138.
- Granek JA, Pisella L, Blangero A, Rossetti Y, Sergio LE, Balasubramaniam R. The role of the caudal superior parietal lobule in updating hand location in peripheral vision: further evidence from optic ataxia. PLoS One. 2012;7(10):e46619.doi:10.1371/journal.pone.0046619.
- Hawkins KM, Sayegh P, Yan X, Crawford JD, Sergio LE. Neural actvity in superior parietal cortex during rule-based visual-motor transformations. J Cogn Neurosci. 2013;25(3):436–54.doi:10.1162/jocn_a_00318.
- Sayegh PF, Hawkins KM, Hoffman KL, Sergio LE. Differences in spectral profiles between rostral and caudal premotor cortex when hand-eye actions are decoupled. J Neurophysiol. 2013;110(4):952–63.doi:10.1152/jn.00764.2012.
- Sayegh PF, Gorbet DJ, Hawkins KM, Hoffman KL, Sergio LE. The contribution of different cortical regions to the control of spatially decoupled eye–hand coordination. J Cogn Neurosci. 2017;29(7):1194–211.
- Miller EK, Cohen JD. An integrative theory of prefrontal cortex function. Annu Rev Neurosci. 2001;24(1):167–202.doi:10.1146/annurev.neuro.24.1.167.
- Husain M, Nachev P. Space and the parietal cortex. Trends Cogn Sci. 2007;11(1):30–36.doi:10.1016/j.tics.2006.10.011.
- Huddleston WE, DeYoe EA. The representation of spatial attention in human parietal cortex dynamically modulates with performance. Cereb Cortex. 2008;18(6):1272–80.doi:10.1093/cercor/bhm158.
- Clower DM, West RA, Lynch JC, Strick PL. The inferior parietal lobule is the target of output from the superior colliculus, hippocampus, and cerebellum. J Neurosci. 2001;21(16):6283–91.doi:10.1523/JNEUROSCI.21-16-06283.2001.
- Gorbet DJ, Sergio LE. Don’t watch where you’re going: the neural correlates of decoupling eye and arm movements. Behav Brain Res. 2016;298:229–40.doi:10.1016/j.bbr.2015.11.012.
- Granek JA, Gorbet D, Sergio L. Extensive video-game experience alters cortical networks for complex visuomotor transformations. Cortex. 2010;46(9):1165–77.doi:10.1016/j.cortex.2009.10.009.
- Cavanna AE, Trimble MR. The precuneus: a review of its functional anatomy and behavioural correlates. Brain. 2006;129(Pt 3):564–83.doi:10.1093/brain/awl004.
- Gorbet DJ, Sergio LE. Looking up while reaching out: the neural correlates of making eye and arm movements in different spatial planes. Exp Brain Res. 2019;237(1):57–70.doi:10.1007/s00221-018-5395-z.
- Churchill N, Hutchison MG, Leung G, Graham S, Schweizer TA. Changes in functional connectivity of the brain associated with a history of sport concussion: a preliminary investigation. Brain Inj. 2017;31(1):39–48.doi:10.1080/02699052.2016.1221135.