
ABSTRACT
Although there is substantial rationale for a motor component in the speech of persons with Down syndrome (DS), there presently are no published estimates of the prevalence of subtypes of motor speech disorders in DS. The goal of this research is to provide initial estimates of the prevalence of types of speech disorders and motor speech disorders in adolescents with DS.
Conversational speech samples from a convenience sample of 45 adolescents with DS, ages 10 to 20 years old, were analysed using perceptual and acoustic methods and measures in the Speech Disorders Classification System (SDCS). The SDCS cross-classified participants into five mutually exclusive speech classifications and five mutually exclusive motor speech classifications. For participants meeting criteria for Childhood Dysarthria or for Childhood Dysarthria concurrent with Childhood Apraxia of Speech, the SDCS provided information on participants’ percentile status on five subtypes of dysarthria.
A total of 97.8% of participants met SDCS criteria for Speech Disorders and 97.8% met criteria for Motor Speech Disorders, including Childhood Dysarthria (37.8%), Speech Motor Delay (26.7%), Childhood Dysarthria and Childhood Apraxia of Speech (22.2%), and Childhood Apraxia of Speech (11.1%). Ataxia was the most prevalent dysarthria subtype.
Nearly all participants with DS in the present sample had some type of speech and motor speech disorder, with implications for theory, assessment, prediction, and treatment. Specific to treatment, the present findings are interpreted as support for motor speech disorders as a primary explanatory construct to guide the selection and sequencing of treatment targets for persons with DS.
Abbreviations: CAS: Childhood Apraxia of Speech; CD: Childhood Dysarthria; DS: Down syndrome; NSA: Normal(ized) Speech Acquisition; PSD: Persistent Speech Delay; PSE: Persistent Speech Errors; SD: Speech Delay; SDCS: Speech Disorders Classification System; SE: Speech Errors; SMD: Speech Motor Delay
Motor speech disorders in Down syndrome
The research literature in Down syndrome (DS) includes frequent reference to a ‘motor component’ in the speech of children, youth, and adults with DS. Examples of such findings over the past three decades include Hamilton (Citation1993), who in an early palatography study reported support for motor programming deficits and impaired tongue motility and more recently, Rupela, Velleman, and Andrianopoulos (Citation2016), who interpreted their behavioural findings in a study of seven children with DS as support for concurrent dysarthria and apraxia. Following is a brief sample of the neuroanatomical findings that provide rationale for an initial estimate of the prevalence of motor speech disorders in DS using recently available behavioural methods and measures.
Neuroanatomical studies of adolescents with DS using autopsy findings and more recently using neuroimaging methods have consistently reported smaller cerebellar volumes among other anatomical brain differences (Coppens-Hofman, Maassen, van Schrojenstein Lantman-de Valk, & Snik, Citation2012; Pinter, Eliez, Schmitt, Capone, & Reiss, Citation2001; see Lott, Citation2012 for review). Additional overviews and discussions of the cerebellum in brain networks relevant to speech and prosody disorders in DS include Ackermann (Citation2008), Bayat, Hosseini, Shamsi, and Nami (Citation2016), Breska and Ivry (Citation2016), Chu and Barlow (Citation2016), and Fiez (Citation2016).
The presence of generalized hypotonia in individuals with DS is well-documented in the literature (Lott, Citation2012) and reportedly plays a role in delayed motor skill acquisition; however, a conclusive causal association between hypotonia and delayed motor development in children with DS has not been documented (Vicari, Citation2006). Hypotonia specific to the articulatory system has also been reported (Bunton & Leddy, Citation2011; Coppens-Hofman et al., Citation2012; Limbrock, Castillo-Morales, Hoyer, Stӧver, & Onufer, Citation1993; Stoel-Gammon, Citation2001) and may explain some speech production characteristics of individuals with DS. Features of ataxic or flaccid dysarthria secondary to the observed hypotonia in individuals with DS have been described (Kent & Vorperian, Citation2013). Physiologic findings suggest that individuals with DS have limited tongue movement during vowel production and as a result, a reduction in acoustic vowel space, articulatory working space, and articulatory speed (Bunton & Leddy, Citation2011). But some researchers suggest that the anomalous muscle tone in individuals with DS does not influence the speech musculature sufficiently to alter speech production (Connaghan & Moore, Citation2013).
Classification of motor speech disorders
A primary constraint on research questions about motor speech impairment in DS is the lack of a classification system for childhood motor speech disorders that includes operationalized and standardized perceptual and acoustic measures. The Method section and a Supplement for this research series [Supplementary Data] provide detailed information on methods and measures in the finalized version of a classification system termed the Speech Disorders Classification System (SDCS) developed for research in childhood speech sound disorders (Shriberg, Kwiatkowski, & Mabie, Citation2019). The SDCS, which provides the research framework for the present study, has been used to classify participants’ motor speech status in a number of studies of the genomic and behavioural substrates of persons with speech sound disorders (e.g., Baylis & Shriberg, Citation2018; Eising et al., Citation2018; Laffin et al., Citation2012; Raca et al., Citation2013; Redle et al., Citation2015; Rice et al., Citation2012; Shriberg, Jakielski, & El-Shanti, Citation2008; Shriberg, Paul, Black, & van Santen, Citation2011; Shriberg, Potter, & Strand, Citation2011; Truong et al., Citation2016; Worthey et al., Citation2013).
Statement of purpose
Notwithstanding substantial rationale for some type of motor component in the speech of persons with DS, there presently is no published source that estimates the prevalence of subtypes of motor speech disorders in persons with DS. The research in this report used the SDCS to address the following question:
What are the estimated prevalences of speech disorders and motor speech disorders in adolescents with DS?
Method
Participants
A database of originally 50 conversational speech samples was assembled from one retrospective study and two prospective studies. The assessment protocol in each of the three sites was similar, including a high-quality audio-recorded conversational speech sample. All participants in the three samples used speech as their primary means of communication and were native English speakers, according to parental report. Information about the data collection process at each site are detailed below.
Sample 1
The first of three samples of participants with DS included retrospective data from 29 participants, 10–18 years of age, who had been enrolled in a study of children with neurodevelopmental disorders at the University of Wisconsin-Madison (Abbeduto et al., Citation2003, Citation2008; Keller-Bell & Abbeduto, Citation2007). Participants were assessed in quiet rooms using recruitment procedures and an assessment protocol approved by an institutional review board. Participants had been recruited locally and nationally from support groups and professional associations, from specific urban areas using newspaper advertisements, and through a University participant research registry. The diagnosis of Trisomy 21 was confirmed through parental report, which was also confirmed in a majority of the cases by medical reports. The mother, father, and teacher of each participant were asked to complete the Autism Behavior Checklist (Krug, Arick, & Almond, Citation1980). If 2 of the 3 individuals scored the participant as ‘high’ (above 44), the participant was given a full autism evaluation. None of the participants in the present study met criteria for a diagnosis of autism spectrum disorder. The assessment protocol included a high-quality audio-recorded conversational speech sample in which participants were asked to talk about a series of daily life topics, including friends, families, and school. The analog recordings were digitized using conventional procedures (Flipsen, Tjaden, Weismer, & Karlsson, Citation1996).
Sample 2
A second sample of 17 participants with DS, 10–18 years of age, was prospectively recruited and assessed at the University of Wisconsin-Madison using procedures approved by an institutional review board. The catchment area included participants from local associations, schools, and clinics, and from facilities throughout Wisconsin and northern Illinois. All participants had a diagnosis of DS (Trisomy 21) confirmed by parental report and medical records where possible. Parents or caregivers completed a health and development inventory. Questions about participants’ medical, educational, and psychosocial histories assessed the potential presence of autism or what was formerly termed Pervasive Developmental Disorder. The examiner, a paediatric speech-language pathologist, watched for autistic-like behaviour during the evaluation. The data for one potential participant was excluded from the present analyses due to a history and clinical presentation consistent with Pervasive Developmental Disorder. The assessment protocol, conducted in a quiet room, included a high quality digital audio-recorded conversational speech sample in which participants were asked to talk about a series of daily life topics, including friends, families, and school (Shriberg et al., Citation2010a).
Sample 3
A third cohort included four male participants with DS, ages 13–20 years, prospectively assessed by a paediatric speech-language pathologist in a quiet room at Vanderbilt University Medical Center. The four participants, who were currently participating in other clinical-research projects (Camarata, Yoder, & Camarata, Citation2006; Davis, Camarata, & Camarata, Citation2016), were assessed using the same protocol approved by the local institutional review board as the protocol used with the second cohort of adolescents with DS, including a high quality digital audio-recorded conversational speech sample in which participants were asked to talk about daily life topics.
Preliminary analyses were completed to look for potentially relevant demographic and cognitive-linguistic characteristics of participants in the three samples. Although the descriptive findings for the four participants in the third cohort were consistent with those in the other two groups, only the two larger groups had a sufficient number of participants to test for significant between-group mean differences. The mean ages (in years) of participants in the three cohorts in the order described were 14.5 (SD = 2.0), 12.9 (SD = 2.8), and 15.8 (SD = 3.1), with a non-significant mean difference between the first two cohorts using 95% confidence intervals. The proportion of males in the first cohort (69%) was significantly larger than the proportion in the second cohort (29.4%; Fisher’s Exact test p-value: 0.014).
The mean standardized IQ of participants in the first cohort (41.4, assessed with the Copying, Bead Memory, and Pattern Analysis subtests of the Stanford-Binet Intelligence Scale, 4th edition; Thorndike, Hagen, & Sattler, Citation1986), was significantly lower than the standardized IQ of participants in the second cohort (49.2; effect size: 1.09; confidence interval: 0.45–1.73) assessed with the Kaufman Brief Intelligence Test – Second Edition (KBIT-2; Kaufman & Kaufman, Citation2004). It is unclear whether the significant difference between the two samples is associated with participants or measures. The mean standardized IQ of the four participants in the third cohort assessed with the Leiter International Performance Scale-Revised (Roid & Miller, Citation1997) was 47.5.
Last, a language measure in conversational speech termed Average Words per Utterance, which is highly correlated with Mean Length of Utterance (r > 0.90 in preschool-aged children; Shriberg & Kwiatkowski, Citation1994), was significantly greater for participants in the first cohort (5.0) than participants in the second cohort (3.5; effect size: 0.89; confidence interval: 0.21–1.58). The Average Words per Utterance for participants in the third cohort was 4.6.
To maximize the diversity and statistical power of participants with DS for the prevalence questions proposed, data for the three cohorts were combined to comprise a database of 50 participants. The prevalence analyses to be reported were completed on the 45 participants whose conversational speech samples met requirements for classification of their status on the marker for childhood apraxia of speech (to be described). Specifically, childhood apraxia status could not be determined for five participants (10%) of the original sample due to one or both of two constraints. The first constraint was an insufficient number of utterances, due to low verbal output, limiting prosody-voice analyses and pause opportunities on the apraxia of speech marker. In associated research also using this marker with retrospective data, childhood apraxia status was classifiable for 415 of 448 (93.5%) children with idiopathic Speech Delay (SD: Shriberg, Kwiatkowski, & Mabie, Citation2019) and averaged 95.7% classifiable samples for 312 participants with seven types of complex neurodevelopmental disorders (Shriberg, Strand, Jakielski, & Mabie, Citation2019: the present group of adolescents with DS excluded). In prospective studies, children with this constraint are typically resampled on the same or another day to obtain a sufficient number of pause opportunities to compute a score on the apraxia marker. The second constraint was missing scores on the nonword repetition task used to resolve indeterminate scores on the apraxia marker because the participants had been assessed before the nonword repetition task, that provides part of this information, became available (cf. Shriberg et al., Citation2009). , discussed presently, includes a summary description of the 45 participants with DS.
Table 1. Estimates of the interjudge and intrajudge agreement for phonetic transcription, prosody-voice coding, and acoustic analyses.
Table 2. Description of 45 participants with Down syndrome.
Procedures
Data reduction and reliability estimates
Four research specialists completed narrow phonetic transcription, prosody-voice coding, and/or acoustic analyses on the original 50 conversational speech samples using methods and measures developed for research in speech sound disorders (Mabie & Shriberg, Citation2017; Shriberg et al., Citation2010a, Citation2010b). A fifth person checked the phonetic transcriptions and prosody-voice coding for formatting errors and entered all data into a software suite titled Programs to Examine Phonetic and Phonologic Evaluation Records (PEPPER; Citation2019).
includes estimates of the point-to-point interjudge and intrajudge reliabilities of the perceptual and acoustic data reduction methods obtained from the same randomly selected 10 (20%) participants. The first two sections of include averaged interjudge and intrajudge transcriber agreement estimates for the transcribers who completed narrow phonetic transcription and prosody-voice coding of the 50 conversational samples. The average point-to-point interjudge and intrajudge agreement for the 10 transcription and prosody-voice variables ranged from 74.9% to 94.1%, which is consistent with the range of reliability estimates reported for these variables in research literatures in childhood speech sound disorders (cf. Shriberg et al., Citation2010b). The third section of includes point-to-point interjudge and intrajudge agreement for 12 acoustic variables analysed in the PEPPER environment by the two acoustic analysts. With the exception of the intrajudge agreement estimate of 61% for Appropriate-Not Appropriate pauses used in the classification of childhood apraxia of speech, percentages of agreement for the remaining 11 variables ranged from 78% to 98%, also consistent with the range of reliability estimates reported for these variables in the research literature in paediatric speech sound disorders (cf. Shriberg et al., Citation2010b). The low estimate of intrajudge (but not interjudge) agreement on Appropriate-Not Appropriate pauses in has not been observed in associated research. As reported elsewhere, interjudge and intrajudge agreement estimates for Appropriate-Not Appropriate pauses based on considerably larger sample sizes have averaged in the mid 70% to low 80% range (e.g., Shriberg et al., Citation2017).
Speech and motor speech classifications and measures
The perceptual and acoustic data from the conversational speech samples were used to classify participants into the five SDCS speech classifications and five motor speech classifications (Shriberg, Kwiatkowski, & Mabie, Citation2019). The Appendix, and a Supplement for this research series [Supplementary Data], provide detailed information on classification methods and measures. These documents include descriptions of the speech and motor speech classifications, and for participants meeting classification criteria for dysarthria, the five dysarthria subtypes.
Appendix
The speech classifications described in the Appendix are consistent with contemporary nosology in childhood speech sound disorders (e.g., Bernthal, Bankson, & Flipsen, Citation2009; Bowen, Citation2015; McLeod & Baker; Citation2017; Rvachew & Brosseau-Lapré, Citation2016). Speech sound disorders are divided into Speech Errors (SE) and SD. To accommodate studies that include children with early disorders (e.g., SD) and those with persistent disorders (e.g., PSD), a slash convention (e.g., SD/PSD) is used to aggregate participants younger and older than 9 years of age (Shriberg, Gruber, & Kwiatkowski, Citation1994). Classifications are accomplished by software (PEPPER, Citation2019; see Shriberg et al., Citation2010a for an overview of PEPPER) that standardizes segmental information by age and sex using two reference databases totaling 200 typical speakers 3 to 80 years of age (Potter et al., Citation2012; Scheer-Cohen et al., Citation2013).
Two conventions are used to minimize the number of speech and motor speech classifications in the SDCS. First, in addition to including speakers with no speech errors, the Normal or Normalized Speech Acquisition (NSA) classification includes speakers with age-appropriate distortions, deletions, and substitutions (speakers with such behaviours in conversational speech are coded NSA- in the PEPPER software). Thus, an NSA classification does not necessarily indicate that a speaker makes no speech errors, but rather that his/her speech does not meet criteria for any of the four speech disorder classifications (i.e., NSA is the default classification).
A second convention is that speakers who meet criteria for both SE and SD are assigned the more severe classification, SD. Most speakers with SD also have common clinical distortion errors. Similarly, speakers who meet criteria for Speech Motor Delay (SMD) and one of the other three motor speech disorders described in the Appendix are assigned that classification, rather than SMD.
Notice in the Appendix that the motor speech classification of Childhood Dysarthria (CD) concurrent with Childhood Apraxia of Speech (CAS), abbreviated CD & CAS, is not just a coding procedure to make the motor speech classifications mutually exclusive. Concurrent rather than single deficits in neuromotor execution (dysarthria) and neuromotor planning/programming (apraxia) have significant genomic, neuropathological, and clinical correlates (see, for example, the implications of concurrent dysarthria and apraxia compared to apraxia alone in the FOXP2 and other speech-genetics literatures; e.g., Carrigg, Parry, Baker, Shriberg, & Ballard, Citation2016; Morgan, Fisher, Scheffer, & Hildebrand, Citation2016; Rice et al., Citation2012; Shriberg et al., Citation2008; Worthey et al., Citation2013).
Supplement
The Supplement provides an overview of the methods and measures used to classify each participant’s speech status and their motor speech status. The Supplement includes a graphic (figure S1) that illustrates the classification procedure and rules for classification. The Supplement also includes descriptions of the three measures used for motor speech classification, and copies of two of the three measures. Table S1 is the Precision-Stability Index, which is used to identify and quantify SMD and table S3 is the Dysarthria Index and Dysarthria Subtype Indices, used to identify CD, CD & CAS, and five subtypes of CD. Tables S2 and S4 include the calculations for each of the 32 Precision-Stability Index signs and 34 Dysarthria Index signs completed by the computer program. The Supplement also includes a brief description of the Pause Marker and Pause Marker Index, which, as described elsewhere, are used respectively to identify and quantify the severity of CAS (Shriberg, Kwiatkowski, & Mabie, Citation2019; Shriberg et al., Citation2017; Tilkens et al., Citation2017).
Description of participants
includes a brief summary of characteristics of the 45 participants (from the original group of 50 participants) who met SDCS requirements for cross-classification of their speech and motor speech status. The summary demographic, intelligence, language, and speech statistics for these participants are consistent with those reported in the literature on speech-language disorders in persons with DS. The standard deviations and/or ranges for the intelligence, language, and speech variables indicate a wide range of individual differences in cognitive, language, and speech status. Notably for the present context, some of the current participants had lower than typical speech scores on the Percentage of Consonants Correct (59.3%-93.3%), Percentage of Vowels Correct (77.7%-96.7%), and Percentage of Intelligible Words (50.1%-99%). The reduced intelligibility findings in are the focus of research reported with the present participants in Wilson, Abbeduto, Camarata, and Shriberg (Citation2019).
Results and discussion
is a summary of the cross-classification findings for the 45 participants with DS. The rows in include prevalence findings for NSA at the time of assessment and prevalence findings for the four speech disorder classifications. The speech classifications are arranged vertically in increasing order of clinical severity. The columns in include prevalence findings for the five SDCS motor speech classifications, arranged horizontally in putative increasing order of clinical severity.
Figure 1. Estimates of the prevalence of speech and motor speech disorders in adolescents with Down syndrome.
Speech classifications
As shown in the Totals columns in , 1 (2.2%) of the 45 participants with DS had normal or normalized speech at assessment. A total of 2 (4.4%) of the participants with DS had only the less severe speech disorder, Persistent Speech Errors (PSE). The remaining 42 (93.3%) of participants with DS met SDCS criteria for SD, with the chronological age of all but one participant meeting criteria for Persistent Speech Delay (PSD).
Motor speech classifications
Beginning with the left-most motor speech classification column in , 1 (2.2%) of the 45 participants with DS met SDCS criteria for No Motor Speech Disorder and 12 (26.7%) met SDCS criteria for SMD. The most prevalent motor speech classification was CD. As shown in , 17 (37.8%) of the participants met SDCS classification criteria for CD and an additional 10 participants (22.2%) met SDCS criteria for CD & CAS. Last, 5 (11.1%) of participants with DS met SDCS criteria for CAS.
Dysarthria subtypes
includes group-level findings estimating the prevalence of each of five subtypes of CD in participants with DS. Findings are based on a total of 27 of the 45 (62.2%) participants in the sample who met SDCS criteria for CD or CD & CAS (see ). It is important to underscore that the percentage scores in do not scale severity of involvement. Rather, lower percentage scores on an index indicates more support for that subtype of dysarthria (i.e., fewer signs with typical age-sex performance on the index). The percentile scores in indicate a speaker’s rank-ordered performance on each index relative to a reference database of 442 speakers at increased risk for motor speech disorders described in Mabie and Shriberg (Citation2017, pp. 203–204). The percentile scores standardize potential age and sex differences in the magnitudes of the percentage scores across the five dysarthria indices. As described in the Supplement, subtype scores at or below the 10th percentile are considered positive for that subtype, and the five dysarthria subtypes are not mutually exclusive.
Figure 2. Estimates of the prevalence of five subtypes of dysarthria in adolescents with Down syndrome. The solid filled bars in Figure 2a are the mean percentage score findings for the 27 participants on the five dysarthria subtype indices described in the Supplement. The diagonal filled bars in Figure 2b are the mean percentile score findings for the same speakers on the five indices.
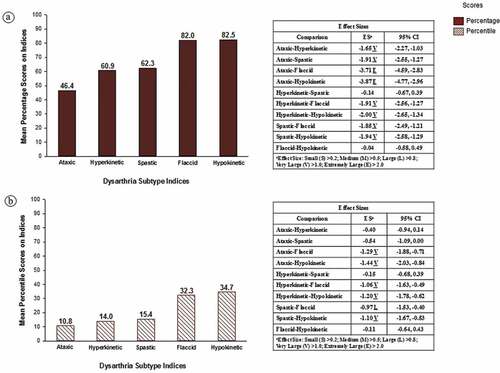
The shapes of the distributions of the averaged percentage scores and the averaged percentile scores in were similar across the five dysarthria subtypes. The descriptive statistics (means) provided the strongest support for the ataxic index, followed by scores on the hyperkinetic and spastic index, with the highest scores (i.e., least support for) flaccid and hypokinetic dysarthria.
These descriptive trends in are supported by the inferential statistics in the tabular data in each panel in . To minimize Type II errors in this relatively low-powered study, inferential statistics are not adjusted for the few family-wise multiple comparisons (see Feise, Citation2002; Nakagawa, Citation2004; Perneger, Citation1998). For the percentage scores in , 8 of the 10 pairwise comparisons yielded statistically significant effect sizes (the confidence intervals did not cross 0.00), with nonsignificant effect-size findings only for the Hyperkinetic-Spastic and Flaccid-Hypokinetic comparisons. For the percentile comparisons in , 6 of the 10 pairwise effect size comparisons were statistically significant with nonsignificant effect-size findings for the Ataxic-Hyperkinetic, Ataxic-Spastic, Hyperkinetic-Spastic, and Flaccid-Hypokinetic comparisons. As shown in the two panels, the magnitudes of the effect sizes ranged from Large (L) to Extremely Large (E), with the largest effect sizes obtained for comparisons of ataxic scores with scores on two of the other four indices. As with the descriptive statistics findings described above, these inferential statistical findings are interpreted to indicate that participants with DS had the most speech, prosody, and voice signs consistent with ataxic dysarthria, the fewest signs consistent with flaccid and hypokinetic dysarthria, with signs intermediate to these findings consistent with hyperkinetic and spastic dysarthria.
Inspection of participant-level data for the grouped data in confirmed that for the participants with DS who met SDCS criteria for CD with or without concurrent CAS, ataxic dysarthria was the most frequent subtype. A total of 21 (77.8%) of the 27 participants who met SDCS criteria for CD or CD & CAS met the ≤ 10th percentile criteria for ataxic dysarthria. However, additional analyses also indicated that 12 (57.1%) of these participants also had dysarthria subtype scores at the 10th percentile or lower on 2 to 5 of the other subtype indices. Participants meeting the ≤10th percentile criteria on more than one index might be classified as having mixed dysarthria. However, the significantly high inter-correlations among scores on several of the CD subtype indices (Shriberg & Mabie, Citation2017), which use the signs and sign weighting described in Duffy (Citation2013), likely contribute to the present CD subtype findings.
Summary
Findings indicate that nearly all of the 45 participants with DS who met criteria for classification using SDCS methods had some type of speech (97.8%) and motor speech (97.8%) disorder. CD was the most common motor speech disorder classification (37.8%), followed by SMD (26.7%), CD & CAS (22.2%) and CAS (11.1%). Among the five subtypes of dysarthria assessed by the Dysarthria Subtype Indices, ataxic dysarthria was significantly most prevalent, but there was support for mixed dysarthrias in over 50% of participants in the present study with CD or CD & CAS.
Conclusions
Methodological considerations that constrain generalizations from the present findings include limitations in sample size and in the sensitivity of the behavioural methods. We note that a primary challenge of translational science is to instrument valid, reliable, and time efficient measures to make them maximally accessible for research and clinical practice. The present SDCS perceptual and acoustic data reduction procedures will require such enhancement. The following conclusions include research and clinical perspectives on the three primary findings of this study.
Most adolescents with Down syndrome in the present study had persistent speech delay, rather than resolved speech delay or only persistent speech errors
As calculated using chronological age, nearly all of the classifiable participants in the present sample of adolescents with DS met SDCS criteria for PSD (93.3%), indicating that they continued to have speech sound deletions and substitutions past 9 years of age. This finding differs from findings for children with idiopathic SD. If speech sound disorder persists in children with the latter classification, it typically is limited to persistent common distortions (i.e., PSE; Shriberg et al., Citation1994). Longitudinal research to track the type and stability of persistent deletion and substitution errors in persons with DS during developmental epochs could be theoretically and clinically informative, using alternative age and developmental status metrics as potential moderating variables (e.g., nonverbal age, language age, motor age). Clinical studies might observe how treatment directed at the deletions/substitutions of SD/PSD versus treatment targeting the common and uncommon speech sound distortions of SE/PSE might increase intelligibility. Greater sensitivity to spatiotemporal differences in distortions (i.e., differences in place, manner, voicing, duration, and force) using contemporary signal processing modalities could be informative for explication and increased clinical efficacy in treatment designs (e.g., Hitchcock, McAllister Byun, Swartz, & Lazarus, Citation2017; McAllister & Ballard, Citation2018; McAllister Byun et al., Citation2017; McAllister Byun & Hitchcock, Citation2012; Preston, Leece, & Maas, Citation2016).
Most adolescents with Down syndrome in the present study had some type of motor speech disorder
The central finding of this study was the high prevalence of motor speech disorders in adolescents with DS. The 97.8% prevalence rate for motor speech disorders in persons with DS in the present sample was the highest prevalence rate among 8 types of complex neurodevelopmental disorders assessed and classified using the same methods (Shriberg, Strand, et al., Citation2019). The high rate of CD & CAS in the present study, indicating that nearly one of every four participants with Trisomy 21 met criteria for CD & CAS, is consistent with CD & CAS in DS reported by Rupela, Velleman, and Andrianopoulous (Citation2016). It is also consistent with studies reporting high rates of CD & CAS in children with certain types of complex neurodevelopmental disorders (Shriberg, Strand, et al., Citation2019), and in case studies of CAS associated with FOXP2 disruptions (Morgan et al., Citation2016). Alternatively, the present findings implicating several motor speech phenotypes in DS could be associated with limitations in the ability of the present behavioural methods to discriminate among subtypes of motor speech disorders. More generally, there are continuing cautions about limitations in the categorical versus dimensional classification assumptions in the Mayo Clinic system on which the present indices of paediatric motor speech disorders were based (e.g., Morgan & Liégeois, Citation2010; Weismer, Citation2006), issues that go beyond the focus of the present paper.
The speech, prosody, and voice signs of individuals with Down syndrome classified as CD were most consistent with ataxic dysarthria
Descriptions of the characteristics of ataxic dysarthria include a ‘scanning pattern of speech, disturbed articulation of both consonants and vowels, and abnormal voice quality’ (Kent et al., Citation2000, p. 1275). Spencer and Slocomb (Citation2007) concluded that impairment of articulation and prosody is central to all descriptions of ataxic dysarthria, noting that ‘… a critical role of feedforward processing by the cerebellum has been established and linked to speech motor control and to aspects of ataxic dysarthria’ (p. 63). Similarly, using fMRI, Urban (Citation2013) described cerebellar activation during speech production. Ogawa, Yoshihashi, Suzuki, Kamei, and Mizutani (Citation2010) proposed that cerebellar dysarthria is characterized by ‘… ataxic speech, and is mainly caused by impairment of the upper cerebellar hemisphere in the distribution of the superior cerebellar artery (SCA)’ (p. 861). The link between the known cerebellar differences in persons with DS paired with the motor speech disorder results and ataxic dysarthria findings further support the role of the cerebellum in speech production and the potential causative role of cerebellar dysfunction in motor speech disorder and intelligibility deficits in DS. The perspective that the cerebellum is involved both in speech motor programming and in articulatory execution is consistent with the high prevalence of CD & CAS in the current study.
Overall, the present findings underscore the contribution of motor speech disorders to the complex of communication challenges for speakers with Down syndrome and highlight the need to consider the role of speech motor control during assessment and management (Namasivayam et al., Citation2013). If characteristics of motor speech disorders are observed at assessment, personalized treatment may require targeted precision and stability goals across multiple subsystems, including respiration, phonation, prosody, resonance, and articulation (McDaniel & Yoder, Citation2016; Miller & Pennington, Citation2011). The present findings are interpreted as support for motor speech disorders as primary explanatory constructs to guide the selection and sequencing of treatment targets within these subsystems for persons with DS.
Supplemental Material
Download PDF (801 KB)Acknowledgments
The authors would like to thank the participants and their families for their participation in this project. Our thanks also to Loredana Bruno, Mary Camarata, Terrie Gibson, Nancy Giles, Sheryl Hall, Selma Karadottir, Heather Karlsson, Heather Mabie, Jane McSweeny, Melissa Murphy, Alison Scheer-Cohen, Susen Schroeder, Christie Tilkens, and David Wilson.
Disclosure Statement
The authors report no declarations of interest.
Supplemental Material
Supplemental data for this article can be accessed on the publisher’s website..
Additional information
Funding
References
- Abbeduto, L., Murphy, M. M., Cawthon, S. W., Richmond, E. K., Weissman, M. D., Karadottir, S., & O’Brien, A. (2003). Receptive language skills of adolescents and young adults with Down or fragile X syndrome. American Journal on Mental Retardation, 108, 149–160.
- Abbeduto, L., Murphy, M. M., Kover, S. T., Giles, N., Karadottir, S., Amman, A., … Nollin, K. (2008). Signaling noncomprehension of language: A comparison of fragile X syndrome and Down syndrome. American Journal on Mental Retardation, 113, 214–230.
- Ackermann, H. (2008). Cerebellar contributions to speech production and speech perception: Psycholinguistic and neurobiological perspectives. Trends in Neurosciences, 31, 265–272.
- Bayat, M., Hosseini, S., Shamsi, F., & Nami, M. (2016). The cognitive face of cerebellum: Implications for extended research. Journal of Advanced Medical Sciences and Applied Technologies, 2, 274–279.
- Baylis, A. L., & Shriberg, L. D. (2018). Estimates of the prevalence of speech and motor speech disorders in youth with 22q11.2 Deletion syndrome. American Journal of Speech- Language Pathology. Advance online publication. doi: 10.1044/2018_AJSLP-18-0037.
- Bernthal, J. E., Bankson, N. W., & Flipsen, P., Jr. (2009). Articulation and phonological disorders. Boston, MA: Allyn & Bacon.
- Bowen, C. (2015). Children’s speech sound disorders (2nd ed.). Chichester: Wiley-Blackwell.
- Breska, A., & Ivry, R. (2016). Taxonomies of timing: Where does the cerebellum fit in? Current Opinion in Behavioral Sciences, 8, 282–288.
- Bunton, K., & Leddy, M. (2011). An evaluation of articulatory working space area in vowel production of adults with Down syndrome. Clinical Linguistics & Phonetics, 25, 321–334.
- Camarata, S., Yoder, P., & Camarata, M. (2006). Simultaneous treatment of grammatical and speech-comprehensibility deficits in children with Down syndrome. Down Syndrome Research and Practice, 11, 9–17.
- Carrigg, B., Parry, L., Baker, E., Shriberg, L. D., & Ballard, K. J. (2016). Cognitive, linguistic, and motor abilities in a multigenerational family with Childhood Apraxia of Speech. Archives of Clinical Neuropsychology, 31, 1006–1025.
- Carrow-Woolfolk, E. (1995). Oral and Written Language Scales (OWLS). Bloomington, MN: Pearson Assessment.
- Chu, S. Y., & Barlow, S. M. (2016). A call for biomechanics to understand hypotonia and speech movement disorders in Down syndrome. In Advances in Communication Disorder (pp. 2–40). Telangana: Avid Science Publications.
- Connaghan, K. P., & Moore, C. A. (2013). Indirect estimates of jaw muscle tension in children with suspected hypertonia, children with suspected hypotonia, and matched controls. Journal of Speech, Language, and Hearing Research, 56, 123–136.
- Coppens-Hofman, M. C., Maassen, B. A., van Schrojenstein Lantman-de Valk, H., & Snik, A. F. (2012). Speech difficulties and poor speech intelligibility in adults with Down syndrome: A review of the literature. Journal of Hearing Science, 2, 9–16.
- Davis, T. N., Camarata, S., & Camarata, M. (2016). Cross modal generalization of receptive and expressive vocabulary in children with Down syndrome. Journal of down Syndrome and Chromosome Abnormalities, 2, 105.
- Duffy, J. R. (2013). Motor speech disorders: Substrates, differential diagnosis, and management (3rd ed.). St. Louis, MO: Mosby.
- Eising, E., Carrion-Castillo, A., Vino, A., Strand, E. A., Jakielski, K. J., Scerri, T. S., … Fisher, S. E. (2018). A set of regulatory genes co-expressed in embryonic human brain is implicated in disrupted speech development. Molecular Psychiatry. Advance online publication. doi: 10.1038/s41380-018-0020-x.
- Feise, R. J. (2002). Do multiple outcome measures require p-value adjustment? BMC Medical Research Methodology, 2, 8.
- Fiez, J. A. (2016). The cerebellum and language: Persistent themes and findings. Brain and Language, 161, 1–3.
- Flipsen, P., Jr, Tjaden, K., Weismer, G., & Karlsson, H. (1996). Acoustic analysis protocol (Technical Report No. 4). Phonology Project, Waisman Center, University of Wisconsin- Madison. Retrieved from Phonology Project website: http://www.waisman.wisc.
- Hamilton, C. (1993). Investigation of the articulatory patterns of young adults with Down’s syndrome using electropalatography. Down Syndrome Research and Practice, 1, 15–28.
- Hitchcock, E. R., McAllister Byun, T., Swartz, M., & Lazarus, R. (2017). Efficacy of electropalatography for treating misarticulation of/r/. American Journal of Speech- Language Pathology, 26, 1141–1158.
- Kaufman, A. S., & Kaufman, N. L. (2004). Kaufman Brief Intelligence Test (2nd ed.). Circle Pines, MN: American Guidance Service.
- Keller-Bell, Y. D., & Abbeduto, L. (2007). Narrative ability of adolescents with fragile X syndrome. The American Journal on Mental Retardation, 112, 289–299.
- Kent, R., & Vorperian, H. (2013). Speech impairment in Down syndrome: A review. Journal of Speech, Language, and Hearing Research, 56, 178–210.
- Kent, R. D., Kent, J. F., Duffy, J. R., Thomas, J. E., Weismer, G., & Stuntebeck, S. (2000). Ataxic dysarthria. Journal of Speech, Language, and Hearing Research, 43, 1275–1289.
- Krug, D. A., Arick, J. R., & Almond, P. J. (1980). Autism screening instrument for educational planning. examiner’s manual. Portland, OR: ASIEP Education.
- Laffin, J. J. S., Raca, G., Jackson, C. A., Strand, E. A., Jakielski, K. J., & Shriberg, L. D. (2012). Novel candidate genes and regions for Childhood Apraxia of Speech (CAS) identified by array comparative genomic hybridization. Genetics in Medicine, 14, 928–936.
- Limbrock, G. J., Castillo-Morales, R., Hoyer, H., Stöver, B., & Onufer, C. N. (1993). The Castillo Morales approach to orofacial pathology in Down syndrome. The International Journal of Orofacial Myology, 19, 30–37.
- Lott, I. T. (2012). Neurological phenotypes for Down syndrome across the life span. Progress in Brain Research, 197, 101–121.
- Mabie, H. L., & Shriberg, L. D. (2017). Speech and motor speech measures and reference data for the Speech Disorders Classification System (SDCS). (Technical Report No. 23). Phonology Project, Waisman Center, University of Wisconsin-Madison. Retrieved from Phonology Project website: http://www.waisman.wisc.edu/phonology/
- McAllister Byun, T., Campbell, H., Carey, H., Liang, W., Park, T. H., & Svirsky, M. (2017). Enhancing intervention for residual rhotic errors via app-delivered biofeedback: A case study. Journal of Speech, Language, and Hearing Research, 60, 1810–1817.
- McAllister Byun, T., & Hitchcock, E. R. (2012). Investigating the use of traditional and spectral biofeedback approaches to intervention for/r/misarticulation. American Journal of Speech-Language Pathology, 21, 207–221.
- McAllister, T., & Ballard, K. J. (2018). Bringing advanced speech processing technology to the clinical management of speech disorders. International Journal of Speech-Language Pathology, 20, 581–582. doi:10.1080/17549507.2018.1510034
- McDaniel, J., & Yoder, P. J. (2016). Pursuing precision in speech-language pathology services for children with Down syndrome. Seminars in Speech and Language, 37, 239–251.
- McLeod, S., & Baker, E. (2017). Children’s speech: An evidence-based approach to assessment and intervention. Boston, MA: Pearson Education.
- Miller, N., & Pennington, L. (2011). Speech therapy for children with dysarthria and cerebral palsy. In M. Roig-Quills & L. Pennington (Eds.), Oro-motor disorders in childhood (pp. 265–283). Barcelona: Viguera.
- Morgan, A., Fisher, S. E., Scheffer, I., & Hildebrand, M. (2016). FOXP2-related speech and language disorders. In R. A. Pagon, M. P. Adam, H. H. Ardinger, S. E. Wallace, A. Amemiya, L. J. Bean, … K. Stephens (Eds.), GeneReviews® Seattle: University of Washington. [internet]. Retrieved from: http://www.ncbi.nlm.nih.gov/books/NBK368474/.
- Morgan, A. T., & Liégeois, F. (2010). Re-thinking diagnostic classification of the dysarthrias: A developmental perspective. Folia Phoniatrica Et Logopaedica., 62, 120–126.
- Nakagawa, S. (2004). A farewell to Bonferroni: The problems of low statistical power and publication bias. Behavioral Ecology, 15, 1044–1045.
- Namasivayam, A. K., Pukonen, M., Goshulak, D., Yu, V. Y., Kadis, D. S., Kroll, R., … De Nil, L. F. (2013). Relationship between speech motor control and speech intelligibility in children with speech sound disorders. Journal of Communication Disorders, 46, 264–280.
- Ogawa, K., Yoshihashi, H., Suzuki, Y., Kamei, S., & Mizutani, T. (2010). Clinical study of the responsible lesion for dysarthria in the cerebellum. Review. Internal Medicine, 49, 861–864.
- Perneger, T. V. (1998). What’s wrong with Bonferroni adjustments? British Medical Journal, 316, 1236.
- Pinter, J. D., Eliez, S., Schmitt, J. E., Capone, G. T., & Reiss, A. L. (2001). Neuroanatomy of Down’s syndrome: A high-resolution MRI study. The American Journal of Psychiatry, 158, 1659–1665.
- Potter, N. L., Hall, S., Karlsson, H. B., Fourakis, M., Lohmeier, H. L., McSweeny, J. L., … Shriberg, L. D. (2012). Reference data for the Madison Speech Assessment Protocol (MSAP): A database of 150 participants 3-to-18 years of age with typical speech. (Technical Report No. 18). Phonology Project, Waisman Center, University of Wisconsin-Madison. Retrieved from Phonology Project website: http://www.waisman.wisc.edu/phonology/
- Preston, J. L., Leece, M. C., & Maas, E. (2016). Intensive treatment with ultrasound visual feedback for speech sound errors in childhood apraxia. Frontiers in Human Neuroscience, 10, 440.
- Programs to Examine Phonetic and Phonologic Evaluation Records [PEPPER: Computer software]. (2019). Madison: Waisman Center, University of Wisconsin–Madison.
- Raca, G., Baas, B. S., Kirmani, S., Laffin, J. J., Jackson, C. A., Strand, E. A., … Shriberg, L. D. (2013). Childhood Apraxia of Speech (CAS) in two patients with 16p11.2 microdeletion syndrome. European Journal of Human Genetics, 21, 455–459.
- Redle, E., Vannest, J., Maloney, T., Tsevat, R. K., Eikenberry, S., Lewis, B., … Holland, S. K. (2015). Functional MRI evidence for fine motor praxis dysfunction in children with persistent speech disorders. Brain Research, 1597, 47–56.
- Rice, G. M., Raca, G., Jakielski, K. J., Laffin, J. J., Iyama-Kurtycz, C., Hartley, S. L., … Shriberg, L. D. (2012). Phenotype of FOXP2 haploinsufficiency in a mother and son. American Journal of Medical Genetics: Part A, 158A, 174–181.
- Roid, G. H., & Miller, L. J. (1997). Leiter International Performance Scale-Revised. Wood Dale, IL: Stoelting Company.
- Rupela, V., Velleman, S. L., & Andrianopoulous, M. V. (2016). Motor speech skills in children with Down syndrome: A descriptive study. International Journal of Speech- Language Pathology, 18, 483–492.
- Rvachew, S., & Brosseau-Lapré, F. (2016). Developmental phonological disorders: Foundations of clinical practice (2nd ed.). San Diego, CA: Plural Publishing.
- Scheer-Cohen, A. R., Holt, A. S., Karlsson, H. B., Mabie, H. L., McSweeny, J. L., Tilkens, C. M., & Shriberg, L. D. (2013). Reference data for the Madison Speech Assessment Protocol (MSAP): A database of fifty 20-to-80 year old participants with typical speech. (Technical Report No. 20). Phonology Project, Waisman Center, University of Wisconsin-Madison. Retrieved from Phonology Project website: http://www.waisman.wisc.edu/phonology/
- Shriberg, L. D. (1993). Four new speech and prosody-voice measures for genetics research and other studies in developmental phonological disorders. Journal of Speech and Hearing Research, 36, 105–140.
- Shriberg, L. D., Austin, D., Lewis, B. A., McSweeny, J. L., & Wilson, D. L. (1997). The Speech Disorders Classification System (SDCS): Extensions and lifespan reference data. Journal of Speech, Language, and Hearing Research, 40, 723–740.
- Shriberg, L. D., Fourakis, M., Hall, S., Karlsson, H. B., Lohmeier, H. L., McSweeny, J., … Wilson, D. L. (2010a). Extensions to the Speech Disorders Classification System (SDCS). Clinical Linguistics & Phonetics, 24, 795–824.
- Shriberg, L. D., Fourakis, M., Hall, S., Karlsson, H. B., Lohmeier, H. L., McSweeny, J., … Wilson, D. L. (2010b). Perceptual and acoustic reliability estimates for the Speech Disorders Classification System (SDCS). Clinical Linguistics & Phonetics, 24, 825–846.
- Shriberg, L. D., Gruber, F. A., & Kwiatkowski, J. (1994). Developmental phonological disorders III: Long-term speech-sound normalization. Journal of Speech and Hearing Research, 37, 1151–1177.
- Shriberg, L. D., Jakielski, K. J., & El-Shanti, H. (2008). Breakpoint localization using array- CGH in three siblings with an unbalanced 4q:16q translocation and Childhood Apraxia of Speech (CAS). American Journal of Medical Genetics: Part A, 146A, 2227–2233.
- Shriberg, L. D., & Kwiatkowski, J. (1994). Developmental phonological disorders. I: A clinical profile. Journal of Speech and Hearing Research, 37, 1100–1126.
- Shriberg, L. D., Kwiatkowski, J., & Mabie, H. L. (2019). Estimates of the prevalence of motor speech disorders in children with idiopathic speech delay. Clinical Linguistics & Phonetics. doi:10.1080/02699206.2019.1595731
- Shriberg, L. D., Lohmeier, H. L., Campbell, T. F., Dollaghan, C. A., Green, J. R., & Moore, C. A. (2009). A nonword repetition task for speakers with misarticulations: The Syllable Repetition Task (SRT). Journal of Speech, Language, and Hearing Research, 52, 1189–1212.
- Shriberg, L. D., & Mabie, H. L. (2017). Speech and motor speech assessment findings in eight complex neurodevelopmental disorders. (Technical Report No. 24). Phonology Project, Waisman Center, University of Wisconsin-Madison. Retrieved from Phonology Project website: http://www.waisman.wisc.edu/phonology/
- Shriberg, L. D., Paul, R., Black, L. M., & van Santen, J. P. (2011). The hypothesis of apraxia of speech in children with Autism Spectrum Disorder. Journal of Autism and Developmental Disorders, 41, 405–426.
- Shriberg, L. D., Potter, N. L., & Strand, E. A. (2011). Prevalence and phenotype of childhood apraxia of speech in youth with galactosemia. Journal of Speech, Language, and Hearing Research, 54, 487–519.
- Shriberg, L. D., Strand, E. A., Fourakis, M., Jakielski, K. J., Hall, S. D., Karlsson, H. B., … Wilson, D. L. (2017). A diagnostic marker to discriminate of Childhood Apraxia of Speech from Speech Delay: I. Development and description of the Pause Marker. Journal of Speech, Language, and Hearing Research, 60, S1096–S1117.
- Shriberg, L. D., Strand, E. A., Jakielski, K. J., & Mabie, H. L. (2019). Estimates of the prevalence of speech and motor speech disorders in persons with complex neurodevelopmental disorders. Clinical Linguistics & Phonetics. doi:10.1080/02699206.2019.1595732
- Spencer, K. A., & Slocomb, D. L. (2007). The neural basis of ataxic dysarthria. Review. Cerebellum, 6, 58–65.
- Stoel-Gammon, C. (2001). Down syndrome phonology: Developmental patterns and intervention strategies. Down Syndrome Research and Practice, 7, 93–100.
- Thorndike, R. L., Hagen, E. P., & Sattler, J. M. (1986). Stanford-Binet Intelligence Scale, 4th edition. Chicago, IL: Riverside.
- Tilkens, C. M., Karlsson, H. B., Fourakis, M., Hall, S. D., Mabie, H. L., McSweeny, J., … Shriberg, L. D. (2017). A diagnostic marker to discriminate childhood apraxia of speech (CAS) from Speech Delay (SD). (Technical Report No. 22). Phonology Project, Waisman Center, University of Wisconsin-Madison. Retrieved from Phonology Project website: http://www.waisman.wisc.edu/phonology/
- Truong, D. T., Shriberg, L. D., Smith, S. D., Chapman, K. L., Scheer-Cohen, A. R., DeMille, M. M. C., … Gruen, J. R. (2016). Multipoint genome-wide linkage scan for nonword repetition in a multigenerational family further supports chromosome 13q as a locus for verbal trait disorders. Human Genetics, 135, 1329–1341.
- Urban, P. P. (2013). Speech motor deficits in cerebellar infarctions. Brain & Language, 127, 323–326.
- Vicari, S. (2006). Motor development and neuropsychological patterns in adolescents with Down syndrome. Behavior Genetics, 36, 355–364.
- Weismer, G. (2006). Philosophy of research in motor speech disorders. Clinical Linguistics & Phonetics, 20, 315–349.
- Wilson, E. M., Abbeduto, L., Camarata, S. M., & Shriberg, L. D. (2019). Speech and motor speech disorders and intelligibility in adolescents with Down syndrome. Clinical Linguistics & Phonetics.
- Worthey, E. A., Raca, G., Laffin, J. J., Wilk, B. M., Harris, J. M., Jakielski, K. J., … Shriberg, L. D. (2013). Whole exome sequencing supports genetic heterogeneity in Childhood Apraxia of Speech. Journal of Neurodevelopmental Disorders, 5, 29.
Appendix: Speech, motor speech, and dysarthria subtype classifications in the Speech Disorders Classification System (SDCS).
Table A1. The five Speech classifications and five Motor Speech classifications in the SDCS are each mutually exclusive. The five dysarthria subtype classifications are not mutually exclusive. That is, a speaker can meet percentile criteria for more than one of the five listed dysarthria subtype classifications (i.e., mixed dysarthria). See Supplement for the procedures and measures used to classify each motor speech disorder.