
Abstract
Objective
Allergic asthma (AA) is common in children. Excess copper is observed in AA patients. It is currently unclear whether copper imbalance can cause cuproptosis in pediatric AA.
Methods
The datasets about pediatric AA (GSE40732 and GSE40888) were obtained from Gene Expression Omnibus (GEO) database. The expression of cuproptosis-related genes (CRGs) and immune cell infiltration in pediatric AA samples were analyzed. Single-cell RNA sequencing (scRNA-seq) data (GSE193816) were used to evaluate the expression patterns of CRGs in AA. The identification of differentially expressed genes within clusters was conducted using weighted gene co-expression network analysis. Subsequently, disease progression and cuproptosis-related models were screened using random forest (RF), support vector machine (SVM), extreme gradient boosting (XGBoost), and general linear model (GLM) algorithms.
Results
Four CRGs were notably increased in pediatric AA samples. CD4+ T cells, macrophages and mast cells exhibited a lower cuproptosis score in AA samples, indicating that these immune cells may be closely associated with cuproptosis in AA development. Co-expression network of CRGs in AA was constructed. AA samples were divided into two cuprotosis clusters. Following construction of four machine-learning models, SVM model exhibited the highest efficacy of prediction in the testing set (AUC = 0.952). SVM model containing five important variables can be used for prediction of AA.
Conclusion
This work provided a machine learning model containing five important variables, which may have good diagnostic efficiency for pediatric AA.
Introduction
Bronchial asthma is one of the most common chronic noninfectious respiratory disease in the world (Citation1). Allergic asthma (AA) is the most important disease type and its incidence rate is increasing year by year (Citation2). There are approximately 334 million people with allergic asthma in the world, and the number of allergic asthma patients may increase by 100 million by 2025 (Citation3). There are many causes of AA in children, among which allergic factors are one of the main causes (Citation4). Most studies have shown that the pathogenesis of AA is closely related to many immune cells, cytokines, biological mediators and genetic factors, including eosinophils, mast cells, Th1/Th2 cytokines, CD4+CD25+ regulatory T cells, GATA3 transcription factor, leptin, endothelin, nerve factors, mucosal immune decline, asthma genes (Citation5,Citation6). In summary, these related cellular molecules play an important role in the pathogenesis of asthma, and an in-depth understanding of them will help provide more effective treatment strategies for AA. In addition, with the significant improvement of the application of machine learning in academic research, the advantages of computer prediction models in the diagnosis and evaluation of various diseases have gradually emerged, such as cardiovascular disease, inflammatory bowel disease, liver disease, tumors and so on (Citation7–10). Therefore, using machine learning technology to build prediction models is of great significance for further accurate identification of AA at the molecular level. Cuproptosis is a newly discovered programmed cell death mode. A recent study has reported that a new form of cell death caused by copper in human cells, which is significantly different from known cell apoptosis, pyroptosis, necroptosis and ferroptosis, namely cuproptosis (Citation11). It is closely related to mitochondrial respiration. Excess copper in cells can be transported to mitochondria through ionic carriers and directly bound to fatty acylated components in the mitochondrial citric acid cycle. It also interferes with iron-sulfur cluster, leading to the aggregation of fatty acylated proteins and the loss of iron-sulfur cluster proteins, thereby inducing protein toxic stress-related cell death (Citation12). Many researches have confirmed that cuproptosis participates in the progression of various diseases, such as hepatocellular carcinoma, rheumatoid arthritis and Alzheimer’s disease (Citation13–15). Interestingly, the concentration of Cu2+ is abnormally elevated in sera of AA patients, suggesting that Cu2+ in AA patients is imbalanced (Citation16). Thus, excess copper may induce cuproptosis in AA development. Analyzing and screening the crucial cuproptosis-related genes to construct a machine learning prediction model is of great significance to clarify whether copper imbalance can cause cuproptosis in pediatric AA, and which can improve the efficiency of diagnosis and evaluation of pediatric AA. This work attempted to screen the crucial cuproptosis-related genes (CRGs) in child AA patients to construct predictive models by using machine learning methods, which can improve the diagnostic accuracy in pediatric AA. Based on GSE40732 dataset, we analyzed the expression of 13 CRGs and immune cells in child AA patients and divided these patients into two cuproptosis-related clusters. Subsequently, we created a prediction model to reveal patients who have different molecular clusters by using multiple machine-learning algorithms. Finally, the predictive model was provided hub genes for the diagnostic accuracy of biomarkers in AA in children.
Materials and methods
Data sources
Two bulk transcriptomic datasets related to pediatric AA (GSE40732 and GSE40888) were retrieved from the Gene Expression Omnibus (GEO) database via the “GEOquery” R package. The GSE40732 dataset (GPL16025 platform) contained 97 AA samples and 97 non-allergic non-asthmatic (NNA) samples, which was served as the test set. The GSE40888 dataset (GPL6244 platform) included 41 AA samples and 64 NNA samples, which was served as the validation set. scRNA-seq data (GSE193816 dataset) was obtained from the GEO database, including 21 samples about AA and allergic non-asthmatic (ANA) patients under 3 conditions (baseline, diluent (saline) and allergen).
Data processing and cuproptosis-related differentially expressed genes screening
To assess the differences in the expression of CRGs between AA and NNA samples, CRGs screening was conducted using the limma package of R software based on the GSE40732 dataset. The comparison of CRGs’ differential expression between AA and NNA samples was carried out using the Wilcoxon sum-rank test.
Processing of scRNA-seq data
The GSE193816 dataset was analyzed by excluding low-quality cells based on unique molecular identifiers (UMI) and total counts criteria. Dimensionality reduction of the scaled data was achieved through Principal Component Analysis (PCA). Sample integration and batch elimination were carried out using the RunHarmony function from the harmony package. Subsequently, cellular visualization was carried out utilizing the Uniform Manifold Approximation Projection (UMAP) technique. Cell types were annotated according to the expression of specific markers associated with each cell type. To calculate module scores and the fraction of enrichment for cuproptosis gene expression in single cell type, the AddModuleScore function was utilized.
Pseudotime analysis
The Monocle 3 R software toolkit was used to reconstruct the cellular differentiation trajectory (Citation17). CR-DEGs were utilized to order cells based on spatiotemporal differentiation. We employed DDRTree, a component of Monocle 3, to conduct Find Variable Features and dimension reduction. Finally, the trajectory was visualized using the “plot_cell_trajectory” function.
Gene set enrichment analysis
Utilizing the limma package, org.Hs.eg.db, and clusterProfiler package, we conducted a single-sample gene set enrichment analysis (ssGSEA) to unveil the specific contribution of CR-DEGs to the development of pediatric AA. We further analyzed and visualized diagnostic genes in this context.
Evaluation of immune cell infiltration
To gain insight into the immune microenvironment in AA, we quantified immune infiltration and related immune function using ssGSEA. Enrichment scores were calculated, which represent immune cell infiltration levels and immune-related pathway activity. The distribution and variation of immune cells were created using the “ggplot2” package, and then visualized in a heatmap.
Unsupervised clustering and PCA
Four different CR-DEGs were subjected to 1000 iterations of the k-algorithm utilizing R software package “ConsensisClusterPlus.” According to unsupervised clustering analysis, 97 pediatric allergic asthma patients were divided into different clusters. The range of cluster numbers, denoted as “k,” was specified from 2 to 9. The optimal “k” was determined through a comprehensive analysis, incorporating both the Cumulative Distribution Function (CDF) and the Area Under the Curve (AUC). Additionally, Principal Component Analysis (PCA) was employed to assess the consistency of molecular subtype distributions. The significance of the four different cuproptosis between different clusters was explored. Subsequently, we performed a Gene Set Variation Analysis (GSVA) using a marker gene set sourced from the MSigDB database (c2.cp.kegg.symbols.gmt).
Construction of weighted co-expression network
Our workflow initiated with building a sample clustering tree to detect and handle potential outliers. Afterwards, we used the Weighted Gene Co-expression Network Analysis (WGCNA) technique to analyze the gene expression data from the training dataset. During this analysis, we transformed the adjacency matrix into the Topological Overlapping Matrix (TOM). Subsequently, we evaluated the modules most strongly correlated with clinical phenotypes to identify genes of interest within those modules. Venn plot was applied to display the most important trait modules to identify significant clinical traits and common trait genes after clustering.
Development and validation of feature model construction using machine learning methods
Machine learning methods for filtering feature model construction and validation were carried out as previous study described (Citation18). Utilizing R software, we constructed machine learning models, including the Random Forest (RF) Tree model, Support Vector Machine (SVM) learning model, Extreme Gradient Boosting (XGBoost) model, General Linear Model (GLM). Recursive feature elimination (RFE) in Random forest algorithm was a supervised machine learning method for sequencing cuproptosis-related genes in children with AA. By estimating predictive performance through ten-fold cross-validation, genes with relative importance > 0.25 were identified as characteristic genes. Diagnostic model with features was built using SVM, XGBoost, GLM and RFE methods. Residual analysis was performed on the data samples and the reverse cumulative distribution of the residuals for the four methods was drew. Receiver Operating Characteristic (ROC) curves were generated for the four methods, and the optimal machine learning feature model was selected based on the reverse cumulative score of residuals and the Area Under the Curve (AUC) value derived from the ROC curve analysis. The best prediction model was plotted on bar charts, calibration curves, and decision curves using packages such as RMS and RMDA. Finally, the ROC curve was used to verify the model on GSE40888 dataset.
Results
Identification of CRGs in AA
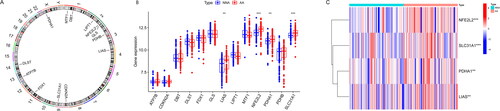
In order to test whether cuproptosis participated in the development of AA, the expression of 13 CRGs in AA patients and NNA individuals was evaluated. The position of the 13 CRGs on chromosome was exhibited in . Among these 13 CRGs, the expression of LIAS, NFE2L2, PDHA1 and SLC31A1 was notably increased in AA patients with respect to NNA individuals. However, the expression of ATP7B, CDKN2A, DBT, DLST, FDX1, GLS, LIPT1, MTF1 and PDHB had no change between AA and NAA samples (). Thus, the abnormally expressed CRGs may be related to the pathogenesis of AA.
Figure 1. The dysregulated CRGs in AA. (A) The location of 13 CRGs on a chromosome. (B) The expression patterns of CR-DEGs. (C) The CRGs boxplot in AA.
The correlation between immunoinfiltration and cuproptosis in AA
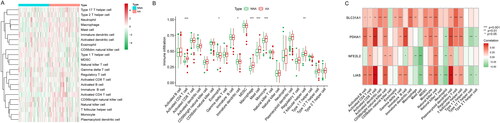
The immune cell infiltration in AA was evaluated by ssGSEA analysis. As shown in and , many immune cell types were abundant in AA samples, such as CD4+ T cells, gamma delta T cells, immature dendritic cells (DCs), macrophages, mast cells, monocytes and T follicular helper cells. Furthermore, the relationship between CR-DEGs (LIAS, NFE2L2, PDHA1 and SLC31A1) and immune cells was shown in . These data indicated that these CR-DEGs may be involved in the immune cell infiltration in AA development.
Figure 2. Immunogene set analysis of immune infiltration patterns in AA and NNA conditions. (A) Heatmap exhibiting the immunogene sets in AA and NNA groups. (B) Boxplot showing the difference in infiltrating immune cells between AA and NNA groups. (C) A correlation heatmap visualizing the relationship between SLC31A1, PDHA1, LIAS, and NFE2L2 and immune cells.
Single-cell dataset analysis
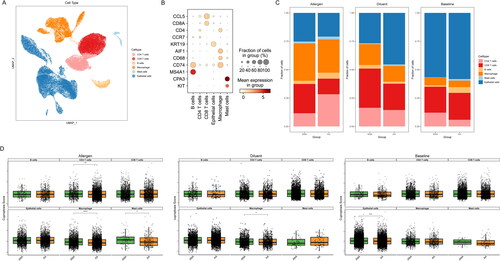
To determine the crucial cell types involved in the development of AA, we analyzed the scRNA-seq data. Clustering analysis of these cells uncovered that there were 6 cell clusters, including B cells (CD74 and MS4A1), CD4+ T cells (CD4 and CCR7), CD8+ T cells (CCL5 and CD8A), macrophages (AIF1 and CD68), mast cells (CPA3 and KIT) and epithelial cells (KRT19) in AA samples (). Furthermore, we evaluated the fraction of cell clusters in AA and ANA groups. Under allergen condition, the fraction of CD4+ T cells was increased in AA samples. The fraction of CD8+ T cells and epithelial was lower in AA samples than that in ANA samples (). The cuproptosis score of these cells was examined. As shown in , CD4+ T cells, macrophages and mast cells exhibited a lower cuproptosis score in AA samples under allergen condition. Under dilute condition, macrophages with lower cuproptosis score was observed in AA samples. Thus, CD4+ T cells, macrophages and mast cells may be closely associated with cuproptosis in AA development.
Figure 3. The correlation between immune cells and cuproptosis in AA. (A) UMAP visualization of cell clusters in AA samples. (B) Bubble chart of cell cluster assignment following UMAP-based visualization of expression. (C) Percentage of various cell clusters in allergen, diluent and baseline samples. (D) The expression of cuproptosis module scores in immune cells.
Cell developmental trajectory
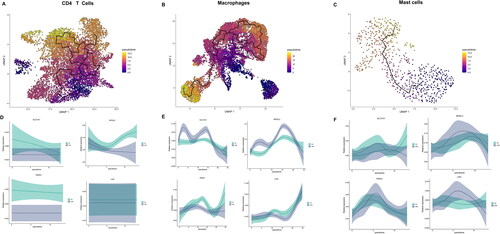
The “monocle 3” package was utilized to analyze the developmental trajectory of CD4+ T cells, macrophages, and mast cells, as illustrated in . The expression of CR-DEGs over time was examined. Notably, the expression of NFE2L2 was increased in CD4+ T cells of AA samples over time. Compared with ANA group, PDHA1 was highly expressed in macrophages of AA group (). Additionally, up-regulation of SLC31A1 and LIAS was observed in mast cells of AA group (). Thus, these genes may participate in the cuproptosis of immune cells.
Figure 4. The developmental trajectory of 3 immune cells. UMAP visualization of the developmental trajectory of CD4+ T cells (A), macrophages (B) and mast cells (C). (D-F) The expression of 4 CRGs in CD4+ T cells (D), macrophages (E) and mast cells (F).
Identification of cuproptosis clusters in AA
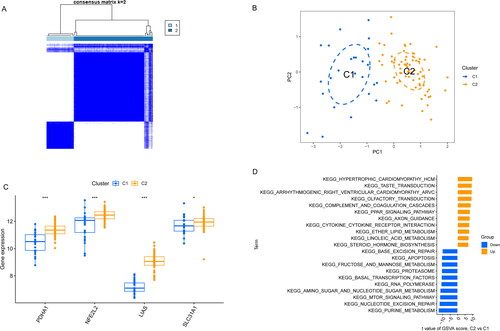
Based on the expression profiles of 13 CRGs, a consensus clustering algorithm was applied to analyze the cuproptosis expression patterns. When k = 2, the cluster numbers were most steady and the results of cluster analysis were most reliable (). Analysis of PCA uncovered that there were significant differences in transcriptome between the two clusters, named C1 cluster and C2 cluster (). Compared with C1 cluster, C2 cluster exhibited the higher expression of LIAS, NFE2L2, PDHA1 and SLC31A1 (). KEGG analysis revealed that C2 cluster was mainly concentrated on hypertrophic cardiomyopathy hcm, taste transduction and arrhythmogenic right ventricular cardiomyopathy arvc. C1 cluster was mainly involved in purine metabolism, mTOR signaling pathway and nucleotide excision repair ().
Figure 5. Identification of molecular clusters related to cuproptosis in AA. (A) Cluster-consensus matrix when k = 2. (B) PCA visualized the distribution of two subtypes (C1 and C2). (C) The expression of 4 CRGs in two clusters. (D) The difference in the activity of signaling pathway between C1 and C2 clusters.
Gene modules screening and co‑expression network construction
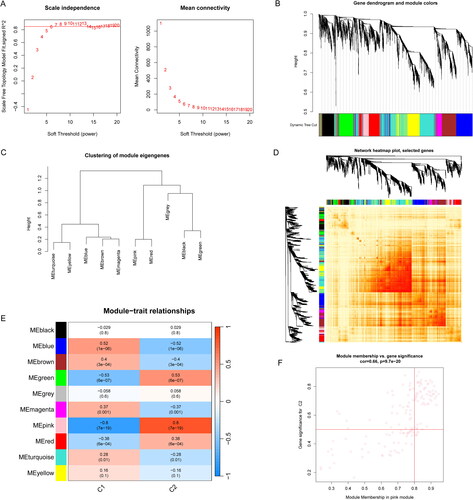
To identify the key gene modules involved in AA, WGCNA algorithm was performed to create co-expression networks and modules. When the soft threshold was 6 and scale-free R2 was equal to 0.9, the co-expressed gene modules were identified (). Eleven distinct co-expression modules with different colors were obtained from the dynamic cutting algorithm (). Moreover, the resemblance and adjacency of module clinical traits was analyzed. The genes that related to AA development was in black module (). The black module was positively associated with disease-related genes (). Additionally, the gene module-related to cuproptosis clusters were analyzed by WGCNA algorithm. When the soft threshold and scale-free R2 were set to 6 and 0.9, respectively, a scale-free network was constructed (). Ten significant modules with different colors were obtained, as shown in . Following the module-clinical traits (C1 and C2) relationship explanation, C1 and C2 clusters were highly associated with the pink module (). Interestingly, the pink module genes were strongly associated with C2 cluster (). Thus, there were 125 disease progression-related genes and 71 DEGs related to cuproptosis clusters.
Figure 6. Co-expression network of CRGs in AA. (A) The option of soft threshold (power). (B) Clustering dendrogram of genes in co-expression modules. Different colors represented distinct co-expression modules. (C) Clustering of module eigengenes. (D) The correlations heatmap among 11 modules. (E) Correlation analysis between module eigengenes and clinical status. A row represented a module. A column indicated a clinical status. (F) Scatter plot between black module and the gene significance for AA.
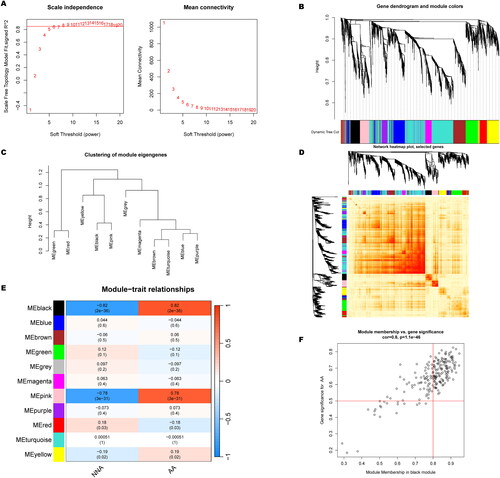
Figure 7. Co-expression network of CRGs in two cuprotosis clusters. (A) The option of soft threshold (power). (B) Clustering dendrogram of genes in co-expression modules. Different colors represented distinct co-expression modules. (C) Clustering of module eigengenes. (D) The correlations heatmap among 10 modules. (E) Correlation analysis between module eigengenes and clinical status. A row represented a module. A column indicated a clinical status. (F) Scatter plot between pink module and the gene significance for Cluster 2.
Identification of cluster‑specific DEGs and biological characteristics
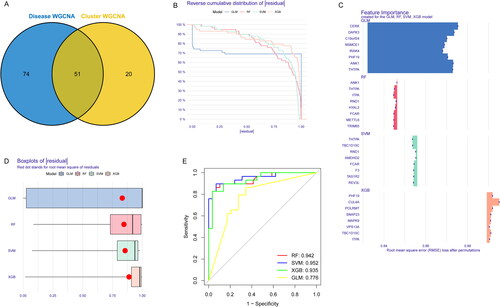
The overlapping genes between cuproptosis clusters and AA, 51 specific DEGs related to curproptosis clusters and AA development were identified (). Based on the expression profiles of 51 DEGs, four validated machine-learning models (GLM, RF, SVM and XGB) were constructed to identify the DEGs with high diagnostic values. GLM machine learning model exhibited a relatively lower residual (). As shown in , the feature importance diagram of each machine learning model was depended on the root mean square error. Moreover, ROC curves for each machine learning algorithm was calculated. SVM machine learning model displayed the highest AUC among these four machine learning models (AUC-RF = 0.942; AUC-SVM = 0.952; AUC-XGB = 0.935; AUC-GLM = 0.776; ).
Figure 8. Construction of RF, SVM, GLM, and XGB machine learning models. (A) The overlapping gene between Disease WGCNA and Cluster WGCNA. (B) The reverse cumulative residual distribution of each machine learning model. (C) The important features in four machine models. (D) The residuals of each machine learning model were presented in boxplots. (E) ROC analysis of four machine models based on fivefold cross-validation in the testing group.
Construction of machine learning models
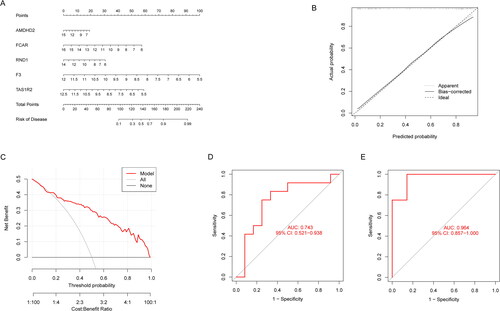
The first step in evaluating the predictive ability of SVM models was to construct a nomogram that can be used for risk assessment of cuporptosis clusters in AA patients (). The predictive accuracy of the nomogram model was evaluated, indicating that the predicted and actual cluster risks of AA were very close (). As a result of DCA, our nomogram was efficient, which might contribute to clinical decision-making (). After that, the GSE40888 dataset related to AA were used to validate our 5-gene prediction model (TAS1R2, F3, FCAR, RND1 and AMDHD2). The ROC curves displayed satisfactory performance in distinguishing between AA patients and NNA individuals, as well as AA and ANA patients, with AUC values of 0.743 and 0.964, respectively (). Hence, it was equally well in distinguishing between AA patients and NNA individuals, AA and ANA patients when using our diagnostic model.
Figure 9. Verification of the 5-gene-based SVM model. (A) Construction of a nomogram for predicting the risk of AA clusters based on the 5-gene-based SVM model. (B-C) The prediction power of Nomogram was evaluated. (D) ROC analysis of the 5-gene-based SVM model between baseline and AA based on fivefold cross-validation in GSE40888 dataset. (E) ROC analysis of the 5-gene-based SVM model between AA and NNA based on fivefold cross-validation in GSE40888.
Discussion
AA is one of the main phenotypes of asthma (Citation19). The group most affected by AA is children. This work analyzed the expression of 13 CRGs in child AA from GSE40732 dataset. There were four genes that were abnormally expressed in pediatric AA patients, including LIAS, NFE2L2, PDHA1 and SLC31A1. SLC31A1 is a member of the copper transporter family. It has an extracellular copper ion binding domain, which is considered the main transporter for copper ions entering cells (Citation20). Many researches have confirmed that SLC31A1 acts as a biomarker for various cancers. Li et al. have found that high copy number level of SLC31A1 is positively associated with the development of breast cancer (Citation21). SLC31A1 silencing causes copper deprivation-induced cell dormancy in pancreatic cancer cells, thereby inhibiting the progression of pancreatic cancer (Citation22). LIAS overexpression elevates the antioxidant levels and reduces inflammation, which alleviates pulmonary injury in mice (Citation23). It has not been reported whether SLC31A1/LIAS affect the development of AA in children. However, NFE2L2 and PDHA1 are closely associated with asthma. For instance, single nucleotide polymorphisms of NFE2L2 interacts significantly with secondhand smoke exposure to increase the risk of pediatric asthma (Citation24). Genotypes of rs2588882 and rs6721961 of NFE2L2 are negatively associated with environmental nitrogen dioxide exposure-induced asthma (Citation25). Wang et al. have found that CD8+ T cells containing PDHA1 and MRPL42 are related with glycolysis, which may be used as specific biomarkers of severe asthma progression (Citation26). This work first demonstrated that LIAS, NFE2L2, PDHA1 and SLC31A1 acted as CR-DEGs in child AA, which may be potential biomarkers for child AA.scRNA-seq analysis revealed that CD4+ T cells, macrophages and mast cells exhibited a higher cuproptosis score in AA samples under allergen condition. These immune cells may be closely associated with cuproptosis. It is well-known that asthma is a chronic inflammatory disease of the airways (Citation27). The spleen is the most important peripheral immune organ in the body, filled with various CD4+ T cell subpopulations, and plays an important role in the pathogenesis of asthma (Citation28). The proportion of CD4+ T cells differentiates into Th1, Th2, Th17, and Treg cells varies continuously with the occurrence and development of asthma (Citation29). Tejwani et al. have found that the expression of FKBP51 in CD4+ T cells induced by dexamethasone is uniquely associated with lose control in obese children with asthma (Citation30). During the development of AA, activation of mast cells mainly rely on IgE-mediated crosslinking of the high affinity receptor for IgE (FcεRI) with allergens (Citation31). Methacholine activates mast cells to release serotonin, which attributes to act on serotonin 2 A receptors to aggravate bronchoconstriction and airway hyperresponsiveness in house dust mite-induced experimental asthma (Citation32). Under different stimulation, macrophages can be polarized into either M1 or M2 phenotypes to affect AA progression (Citation32). This work first revealed that the expression of NFE2L2 was increased in CD4+ T cells in AA samples. PDHA1 was highly expressed in macrophages, SLC31A1 and LIAS were up-regulated in mast cells. Therefore, these immune cells are associated with cuproptosis in AA patients.
According to the expression profiles of DEGs related to cuproptosis and AA, four machine-learning models (RF, SVM, GLM, and XGB) were performed in terms of prediction. SVM model exhibited the highest efficacy of prediction in the testing set (AUC = 0.952). Therefore, SVM model-dependent machine learning containing five important variables (TAS1R2, F3, FCAR, RND1 and AMDHD2) can be used for prediction of AA.
Although machine learning has shown good prospect in medicine, its clinical application still has limitations. These factors mainly include insufficient or unbalanced data in the model dataset, data privacy issues and the lack of available research practices to evaluate the performance of the model. At the same time, the opacity and potential deviation of algorithm decision-making also bring challenges to the application. All these require us to further deepen the research to improve the application. In general, machine learning has the potential to enhance personalized clinical decisions-making, especially in the diagnosis of AA in children. In addition, the clinical community will be able to expand the range of problems they can solve by using machine learning methods, which is expected to bring a more rigorous and convenient future for medicine.
Conclusion
In conclusion, this work first revealed the relationship between cuproptosis and AA in children. This work provided a machine learning model containing five important variables, which may have good diagnostic efficiency for AA in children.
Acknowledgements
The authors are grateful for the help of all colleagues and the public database.
Declaration of competing interest
The authors declare that they were no conflict regarding the publication of this article.
Data availability statement
The datasets analyzed in the current study is available from the GEO (https://www.ncbi.nlm.nih.gov/geo/) database. All these data are available from publicly available databases. This study complies with their data use and distribution rules.
References
- Chetta A, Calzetta L. Bronchial asthma: an update. Minerva Med. 2022;113(1):1–3. doi:10.23736/S0026-4806.21.07958-1.
- Akar-Ghibril N, Casale T, Custovic A, Phipatanakul W. Allergic endotypes and phenotypes of asthma. J Allergy Clin Immunol Pract. 2020;8(2):429–440. doi:10.1016/j.jaip.2019.11.008.
- Enilari O, Sinha S. The global impact of asthma in adult populations. Ann Glob Health. 2019;85(1):2. doi:10.5334/aogh.2412.
- Testa D, DI Bari M, Nunziata M, Cristofaro GDE, Massaro G, Marcuccio G, Motta G. Allergic rhinitis and asthma assessment of risk factors in pediatric patients: a systematic review. Int J Pediatr Otorhinolaryngol. 2020;129:109759. doi:10.1016/j.ijporl.2019.109759.
- Komlósi ZI, van de Veen W, Kovács N, Szűcs G, Sokolowska M, O’Mahony L, Akdis M, Akdis CA. Cellular and molecular mechanisms of allergic asthma. Mol Aspects Med. 2022;85:100995. doi:10.1016/j.mam.2021.100995.
- Mastrorilli C, Posa D, Cipriani F, Caffarelli C. Asthma and allergic rhinitis in childhood: what’s new. Pediatr Allergy Immunol. 2016;27(8):795–803. doi:10.1111/pai.12681.
- Arfat Y, Mittone G, Esposito R, Cantalupo B, DE Ferrari GM, Aldinucci M. Machine learning for cardiology. Minerva Cardiol Angiol. 2022;70(1):75–91. doi:10.23736/S2724-5683.21.05709-4.
- Zulqarnain F, Rhoads SF, Syed S. Machine and deep learning in inflammatory bowel disease. Curr Opin Gastroenterol. 2023;39(4):294–300. doi:10.1097/MOG.0000000000000945.
- Bhat M, Rabindranath M, Chara BS, Simonetto DA. Artificial intelligence, machine learning, and deep learning in liver transplantation. J Hepatol. 2023;78(6):1216–1233. doi:10.1016/j.jhep.2023.01.006.
- Badwan BA, Liaropoulos G, Kyrodimos E, Skaltsas D, Tsirigos A, Gorgoulis VG. Machine learning approaches to predict drug efficacy and toxicity in oncology. Cell Rep Methods. 2023;3(2):100413. doi:10.1016/j.crmeth.2023.100413.
- Tsvetkov P, Coy S, Petrova B, Dreishpoon M, Verma A, Abdusamad M, Rossen J, Joesch-Cohen L, Humeidi R, Spangler RD, et al. Copper induces cell death by targeting lipoylated TCA cycle proteins. Science. 2022;375(6586):1254–1261. doi:10.1126/science.abf0529.
- Chen L, Min J, Wang F. Copper homeostasis and cuproptosis in health and disease. Signal Transduct Target Ther. 2022;7(1):378. doi:10.1038/s41392-022-01229-y.
- Zhang Z, Zeng X, Wu Y, Liu Y, Zhang X, Song Z. Cuproptosis-related risk score predicts prognosis and characterizes the tumor microenvironment in hepatocellular carcinoma. Front Immunol. 2022;13:925618. doi:10.3389/fimmu.2022.925618.
- Zhao J, Guo S, Schrodi SJ, He D. Cuproptosis and cuproptosis-related genes in rheumatoid arthritis: implication, prospects, and perspectives. Front Immunol. 2022;13:930278. doi:10.3389/fimmu.2022.930278.
- Lai Y, Lin C, Lin X, Wu L, Zhao Y, Lin F. Identification and immunological characterization of cuproptosis-related molecular clusters in Alzheimer’s disease. Front Aging Neurosci. 2022;14:932676. doi:10.3389/fnagi.2022.932676.
- Ariaee N, Farid R, Shabestari F, Shabestari M, Jabbari Azad F. Trace elements status in sera of patients with allergic asthma. Report Biochem Mol Biol. 2016;5(1):20–25.
- Cao J, Spielmann M, Qiu X, Huang X, Ibrahim DM, Hill AJ, Zhang F, Mundlos S, Christiansen L, Steemers FJ, et al. The single-cell transcriptional landscape of mammalian organogenesis. Nature. 2019;566(7745):496–502. doi:10.1038/s41586-019-0969-x.
- Wu J, Qin C, Cai Y, Zhou J, Xu D, Lei Y, Fang G, Chai S, Xiong N. Machine learning screening for Parkinson’s disease-related cuproptosis-related typing development and validation and exploration of personalized drugs for cuproptosis genes. Ann Transl Med. 2023;11(1):11–11. doi:10.21037/atm-22-5756.
- Miller RL, Grayson MH, Strothman K. Advances in asthma: new understandings of asthma’s natural history, risk factors, underlying mechanisms, and clinical management. J Allergy Clin Immunol. 2021;148(6):1430–1441. doi:10.1016/j.jaci.2021.10.001.
- Öhrvik H, Nose Y, Wood LK, Kim BE, Gleber SC, Ralle M, Thiele DJ. Ctr2 regulates biogenesis of a cleaved form of mammalian Ctr1 metal transporter lacking the copper- and cisplatin-binding ecto-domain. Proc Natl Acad Sci U S A. 2013;110(46):E4279–4288. doi:10.1073/pnas.1311749110.
- Li X, Ma Z, Mei L. Cuproptosis-related gene SLC31A1 is a potential predictor for diagnosis, prognosis and therapeutic response of breast cancer. Am J Cancer Res. 2022;12(8):3561–3580.
- Yu Z, Zhou R, Zhao Y, Pan Y, Liang H, Zhang JS, Tai S, Jin L, Teng CB. Blockage of SLC31A1-dependent copper absorption increases pancreatic cancer cell autophagy to resist cell death. Cell Prolif. 2019;52(2):e12568. doi:10.1111/cpr.12568.
- Xu G, Zhao Y, Tao Y, Xiong C, Lv M, Gao Q, Zhang F, An Z, Wu W. Lias overexpression alleviates pulmonary injury induced by fine particulate matter in mice. Environ Geochem Health. 2023;45(8):6585–6603. doi:10.1007/s10653-023-01651-3.
- Johansson E, Martin LJ, He H, Chen X, Weirauch MT, Kroner JW, Khurana Hershey GK, Biagini JM. Second-hand smoke and NFE2L2 genotype interaction increases paediatric asthma risk and severity. Clin Exp Allergy. 2021;51(6):801–810. doi:10.1111/cea.13815.
- Córdova EJ, Jiménez-Morales S, Centeno F, Martinez-Hernández A, Martínez-Aguilar N, Del-Río-Navarro BE, Gómez-Vera J, Orozco L. NFE2L2 gene variants and susceptibility to childhood-onset asthma. Rev Invest Clin. 2011;63(4):407–411.
- Wang X, Wang J, Xing CY, Zang R, Pu YY, Yin ZX. Comparative analysis of the role of CD4(+) and CD8(+) T cells in severe asthma development. Molekuliarnaia Biologiia. 2015;49(3):482–490.
- Hammad H, Lambrecht BN. The basic immunology of asthma. Cell. 2021;184(6):1469–1485. doi:10.1016/j.cell.2021.02.016.
- Seumois G, Ramírez-Suástegui C, Schmiedel BJ, Liang S, Peters B, Sette A, Vijayanand P. Single-cell transcriptomic analysis of allergen-specific T cells in allergy and asthma. Sci Immunol. 2020;5(48):eaba6087. doi:10.1126/sciimmunol.aba6087.
- Luo W, Hu J, Xu W, Dong J. Distinct spatial and temporal roles for Th1, Th2, and Th17 cells in asthma. Front Immunol. 2022;13:974066. doi:10.3389/fimmu.2022.974066.
- Tejwani V, McCormack A, Suresh K, Woo H, Xu N, Davis MF, Brigham E, Hansel NN, McCormack MC, D’Alessio FR. Dexamethasone-induced FKBP51 expression in CD4(+) T-lymphocytes is uniquely associated with worse asthma control in obese children with asthma. Front Immunol. 2021;12:744782. doi:10.3389/fimmu.2021.744782.
- Méndez-Enríquez E, Hallgren J. Mast cells and their progenitors in allergic asthma. Front Immunol. 2019;10:821. doi:10.3389/fimmu.2019.00821.
- Mendez-Enriquez E, Alvarado-Vazquez PA, Abma W, Simonson OE, Rodin S, Feyerabend TB, Rodewald HR, Malinovschi A, Janson C, Adner M, et al. Mast cell-derived serotonin enhances methacholine-induced airway hyperresponsiveness in house dust mite-induced experimental asthma. Allergy. 2021;76(7):2057–2069. doi:10.1111/all.14748.