
Abstract
While automated techniques exist for the integration of individual gas chromatograph peaks, manual inspection of integration quality and peak choice is still required due to drifting retention times and changing peak shapes near detection limits. The feasibility of a simplified method to obtain multiple bulk species classes from complex gas chromatography data is investigated here with data from the thermal desorption aerosol gas chromatograph (TAG). Chromatograms were divided into many “chromatography bins” containing total eluting mass spectra (both from resolved species and unresolved complex mixture [UCM]), instead of only integrating resolved peaks as is performed in the traditional chromatography analysis method. Positive matrix factorization (PMF) was applied to the mass spectra of the chromatography bins to determine major factors contributing to the observed chemical composition. PMF factors are not highly sensitive to the specific PMF error estimation method applied. Increasing the number of chromatography bins that each chromatogram was divided into improved PMF results until reaching 400 bins. Increasing the number of bins above 400 does not significantly improve the PMF results. This is likely due to 400 bin separation providing bin widths (4.6 s) that match the narrowest peak widths (4.8 s) of compounds found in the TAG chromatograms. The bin-based method took only a small fraction of the time to complete compared to peak-integrated method, significantly saving operator time and effort. Finally, high-factor solutions (e.g., 20 factors) of bin-based PMF can separate many individual compounds, homologues compound series, and UCM from chromatography data.
Copyright 2014 American Association for Aerosol Research
1. INTRODUCTION
Atmospheric particles have significant effects on human health (Dockery et al. Citation1993; Schwartz et al. Citation1996; Mauderly and Chow Citation2008; Pope et al. Citation2009; Dimitrova et al. Citation2012), visibility (White and Roberts Citation1977; Sisler and Malm Citation1994; Baumer et al. Citation2008), hydrological cycle (Ramanathan et al. Citation2001), and climate change (Ramanathan et al. Citation2001; IPCC Citation2007). The mass of Organic Aerosol (OA), a major component of submicron aerosols worldwide, represents 20%–90% of total fine particle mass (Kanakidou et al. Citation2005; Jimenez et al. Citation2009). OA can be divided into Primary OA (POA) which is emitted directly in particulate form from fossil fuels combustion, biomass burning, cooking, etc., and Secondary OA (SOA) formed from atmospheric gas-to-particle conversion processes which dominates the global ambient OA mass burden (Jimenez et al. Citation2009). The chemical composition of OA has also been separated broadly into Hydrocarbon-like OA (HOA) and Oxygenated OA (OOA), the latter accounting for on average 80% of OA (Zhang et al. Citation2007). In the past several decades, great progress has been made in measuring OA chemical composition through new analytical techniques that measure in situ, with higher time resolution, greater chemical resolution, and with better detection limits. (Hallquist et al. Citation2009). Many off-line filter-based methods have been applied to OA analysis using techniques such as gas chromatography-mass spectrometry (GC-MS) (Ho et al. Citation2008), fourier transform infrared (FTIR) transmission spectroscopy (Maria et al. Citation2002), and nuclear magnetic resonance (NMR) spectroscopy (Decesari et al. Citation2007). The on-line measurement techniques include total organic carbon measurements with the OC/EC aerosol analyzer (Bauer et al. Citation2009); the Aerosol Time-of-Flight Mass Spectrometer (ATOFMS) for single particle analysis (Noble and Prather Citation2000); the Aerodyne Aerosol Mass Spectrometer (AMS) for total OA measurements and O/C, H/C, and N/C elemental analysis (Aiken et al. Citation2007; Canagaratna et al. Citation2007) and now operating with various types of ionization (electron impact, VUV, etc.); and the Thermal desorption Aerosol Gas chromatograph (TAG) (Williams et al. Citation2006), two-dimensional TAG (2D-TAG) (Goldstein et al. Citation2008), and semi-volatile TAG (SV-TAG) (Zhao et al. Citation2013b) for individual compound measurements. In this article, although there are other techniques that are able to measure OA (e.g., OC/EC analyzer), AMS and TAG have been chosen for comparison since they make complementary mass spectral measurements and their comparisons can help to inform on the performance of each instrument and the chemical composition of ambient OA. In a recent development, the TAG and AMS have been combined to share the same high-resolution electron-impact-ionization time-of-flight mass spectrometer but alternate between the total OA mass spectra in AMS mode and the speciated organic compounds analysis in TAG mode (Williams et al. Citation2014). AMS and TAG systems have complementary strengths (Hallquist et al. Citation2009). The AMS system has high completeness of mass analyzed (on the order of ∼ 100% of OA in the atmosphere) with limited chemical resolution, and the TAG system has high chemical resolution with limited completeness of mass analyzed on the order of 20% in an HOA-rich environment and as low as 10% of OA in the atmosphere when ambient OA is composed largely of oxygenated species as deployed at Study of Organic Aerosol at Riverside (SOAR). TAG-PMF derived HOA and OOA account for nearly equivalent total ion signal. Since OOA was estimated to be about four times larger than HOA during SOAR (Docherty et al. Citation2011), this suggest that OOA is detected about four times less efficiently than HOA by this TAG system. However, as shown by Williams et al. the comparison between TAG and AMS was still feasible since the variability of HOA and OOA is acquired through the measured portions of total HOA and OOA. A quantitative comparison requires scaling TAG PMF factors through a fit to total organic aerosol mass (Williams et al. Citation2010).
Apportioning OA mass to different sources or transformation processes is challenging because of the complexity of organic composition and temporal variability of atmospheric meteorology and emission sources, as well as the impact of atmospheric aging that continuously changes OA composition in complex ways. Two widely-utilized methods have been developed to characterize sources of OA—chemical mass balance (CMB) and factor analysis (FA). Chemical mass balance (CMB) uses chemical characteristics of OA measured at source and receptor to both identify the presence of sources and to quantify the source contributions to receptor concentrations (Schauer et al. Citation1996). Typically, OA is collected on filters which are later measured by gas chromatography–mass spectrometry method (GC-MS) for chemical characterization on molecular level (Ho et al. Citation2008), but it can also be applied data from other techniques such as AMS (Ng et al. Citation2011). CMB assumes that all sources contributing to the measured concentrations in the receptor have been identified. However, it is not always possible to predict all sources contributing to complex ambient samples, or the chemical profiles of the sources active in a given area may have differences with those in the literature. The effect of chemical aging is also difficult to capture with CMB. Factor analysis (FA) typically provides better results for source characterization and understanding transformation processes if the major sources influencing the receptor are unknown (Jimenez et al. Citation2009). Positive matrix factorization (PMF) has recently become a highly utilized type of FA (Reff et al. Citation2007); which has been applied in a wide variety of problem domains, such as facial image representation, semantic analysis of text documents (Lee and Seung Citation1999), and source apportionment of air pollution (Lee et al. Citation1999). Source apportionment on atmospheric particular matter was first performed using inorganic ions, EC/OC, and trace metals from filters analyses as inputs to PMF (Lee et al. Citation1999; Chueinta et al. Citation2000; Ramadan et al. Citation2000; Ito et al. Citation2004). Recently, PMF has been used with high-time resolution AMS mass spectra to determine the major components of ambient OA such as hydrocarbon-like organic aerosol (HOA, a surrogate of POA), semi-volatile oxygenated organic aerosol (SV-OOA), and low-volatility oxygenated organic aerosol (LV-OOA), the latter two associated with fresh and aged SOA, respectively (Ulbrich et al. Citation2009; Zhang et al. Citation2011). Williams et al. and Zhao et al. performed PMF analysis on organic compounds measured by the TAG system to identify major components contributing to submicron OA in the atmosphere (Williams et al. Citation2010; Zhao et al. Citation2013a).
TAG is a fully automated, field deployable instrument that couples thermal desorption with gas chromatography/mass spectrometry to provide molecular level separation and identification of organic species in atmospheric aerosols. This instrument is capable of 1-h time-resolved measurements of specific organic marker compounds, and because it is fully automated, it is capable of providing continuous measurements to determine time-varying patterns in the organic composition of particulate matter. For a typical atmospheric aerosol sample analyzed by TAG, there are several hundred resolved peaks in 1D-TAG with significant unresolved complex mixtures (UCM), and thousands of resolved peaks in 2D-TAG with relatively less UCM. shows the chromatogram of a typical ambient atmospheric sample from 1D-TAG. In addition, what is not observed by regular TAG analysis is the highly nonvolatile or highly oxygenated fraction of ambient OA that does not efficiently desorb from the collection cell or transfer through the GC column. We refer to this as the “noneluting” OA fraction. In past studies with TAG, the major compound peaks are identified and quantified using detailed chromatogram analysis with the Agilent ChemStation peak integration software (Williams et al. Citation2010). Following automated integration, peak integration quality is manually checked for each compound in each chromatogram to ensure correct peak choice and proper integration performance, a process that is very time-consuming when analyzing hundreds of compounds in each chromatogram and over 700 chromatograms per month of operation. Finally, PMF is then used to apportion these time-resolved individual organic compounds into separate factors. With supporting measurements of various other tracers and meteorological variables, these factors can be interpreted as specific sources or atmospheric transformation processes (Williams et al. Citation2010). In addition to being time consuming, the peak-integrated method for analyzing TAG chromatography data doesn't incorporate the UCM which accounts for a large fraction of eluting OA. By incorporating UCM in the PMF analysis, it improves the chromatogram signal analyzed significantly (up to a factor of 8 higher), and this increased signal analyzed is related to the increased mass analyzed. One of the weaknesses of TAG technique has been low completeness of OA mass analyzed, but by including UCM in the data analysis, the percent of mass analyzed is significantly improved..
FIG. 1 Chromatogram of typical ambient atmospheric sample from TAG. The sample is composed of resolved peaks (compounds), column bleed from the column phase (shown here in a system blank), and the remainder of the sample signal is the Unresolved Complex Mixture (UCM) that is composed of hundreds of co-eluting compounds.
Here we introduce a new method to fully utilize chromatography-based information (e.g., TAG data used here), inclusive of the often ignored UCM fraction composed of hundreds of co-eluting compounds, for a simplified and rapid approach to deconvolving major contributing components. We also explore here how these major TAG chromatogram components can offer further chemical characterization of generic AMS components that do not incorporate prior molecular separation of input aerosol samples, fully utilizing the complementary measurement capacity of combined TAG and AMS systems. This method first divides each chromatogram into equally-spaced bins that contain resolved peaks and UCM instead of integrating each peak individually. Then PMF is applied to the summed mass spectra of bins instead of individual compounds to characterize the sources and transformation processes. This bin-based method has advantages of significantly saving time and containing UCM in source characterization. illustrates this binning method for an example TAG chromatogram. The whole chromatogram has been utilized to decode its complexity in previous work. For example, the GC signal of n-alkanes and oxygen-containing compounds homologous series was characterized by a chemometric approach to track their different origins (Pietrogrande et al. Citation2007, Citation2009, Citation2010); the GC signal of carboxylic acid mixtures has been also characterized by a chemometric approach to identify the chemical compounds in samples of Martian soil (Pietrogrande et al. Citation2005). In addition, Fourier analysis also uses the total chromatographic signal for decoding complex chromatograms (Felinger et al. Citation1990a,b, Citation1992).
FIG. 2 The binning method for TAG chromatograms is to evenly divide the chromatogram by time including both the resolved peaks and the UCM. Using this method, the UCM dominates the signal.
2. METHODS
2.1. Positive Matrix Factorization (PMF)
In PMF, any input data matrix of X with dimension n rows and m columns can be factorized into two matrices, G (n × p), the time series matrix, and F (p × m), the profile matrix, where p is the number of factors. A residual matrix E (n × m) also results such that:[1]
The objective of PMF analysis is to minimize the Q objective function (sum of weighed squared residuals), defined as:[2]
where ,
, and
are elements of matrices E, G, and F;
is the estimated standard deviation (precision) of
which is the element of matrix X (Paatero Citation1997). Ideally,
should be normally distributed with an expected value near 1, and the expected value of Q (
) equals the degrees of freedom of the fitted data:
. If the model is appropriate for the problem (data is sum of variable amounts of components with constant profile) and the estimations of errors in the input data are accurate,
should be near 1 with an appropriate number of factors (Ulbrich et al. Citation2009).
In this article, the PMF model (1) was solved with the PMF2 algorithm. A custom software tool (PMF Evaluation Tool, PET, version 2.06 [Ulbrich et al. Citation2009]) in Igor Pro (version 6.2 and version 6.3 for 64-bit beta, WaveMetrics, Inc.) was used to evaluate PMF outputs and related statistics. The TAG binning data matrix, X, is shown in . The associated uncertainty matrix is constructed similarly. In the binning method, individual chromatograms generated every hour were divided into b bins. Each bin typically contains many sequentially acquired mass spectra. The summed mass spectra of b bins in the first chromatogram were positioned from the first row to the bth row of data matrix X; and the summed mass spectra of b bins in the second chromatogram were positioned from the row (b+1)st row to (2b)st row; and so on. The column of data matrix X is the index of m/z. Other matrix constructions are possible but are not explored here (Ulbrich et al. Citation2012).
FIG. 3 Schematic of the TAG binning data matrix [X] for use in PMF analysis: n is the number of chromatogram for each hour; b is bin number for each chromatogram bin; m is the index of m/z.
![FIG. 3 Schematic of the TAG binning data matrix [X] for use in PMF analysis: n is the number of chromatogram for each hour; b is bin number for each chromatogram bin; m is the index of m/z.](/cms/asset/63c76a04-957c-49c4-9055-46389fc85979/uast_a_967832_f0003_b.gif)
2.2. Data Analysis
The TAG dataset from the Study of Organic Aerosol at Riverside (SOAR) 2005 has been used to develop this binning method. Detailed information regarding the SOAR field site and auxiliary measurements can be found in Williams et al. (Williams et al. Citation2010) and Docherty et al. (Docherty et al. Citation2008, Citation2011).
The retention time-dependent mass spectra from each chromatogram of the TAG SOAR dataset was exported from ChemStation software with m/z range from 29 to 350 and scan number (mass spectral recording number) from 651 to 5850, such that the original number of included scans from a single chromatogram equaled 5850–650 = 5200. The first 650 mass spectral scans were removed to eliminate the most volatile fraction that is frequently impacted by solvent peaks or air/water peaks from the injection period. shows the TAG system sampling sequence during SOAR and TAG binning datasets. The TAG system sampled ambient (gas + particle) and filtered ambient (gas only) data, which correspond to ambient and filtered ambient chromatograms (Williams et al. Citation2010). Filtered ambient data has lower time resolution and is interpolated to the ambient time line in order to keep the high-time resolution of ambient data points. Since the TAG collection cell collects particle mass and a fraction of semi-volatile gases (Williams et al. Citation2010), the ambient data contain particle and semi-volatile gas information, and filtered ambient data contain semi-volatile gas information only. The “Particle-only” data (or chromatograms) can be obtained by subtraction between “Ambient” and “Filtered Ambient” data (chromatograms). Each Chromatogram (Ambient, Filtered Ambient, and Particle) was divided into equally-spaced bins, which are referred to as TAG-Bin-Ambient, TAG-Bin-Gas, and TAG-Bin-Particle-Pre datasets. The mass spectra in each bin were summed to get one mass spectrum to represent that bin. For example, if chromatogram is divided into 400 bins, every 13 (5200/400 = 13, which 5200 is the original bin resolution) mass spectra from raw chromatogram will be summed. Finally, PMF analysis was applied separately on TAG-Bin-Ambient, TAG-Bin-Gas, and TAG-Bin-Particle-Pre datasets. TAG-Bin-Ambient and TAG-Bin-Gas datasets were originally solved for three factors: what we will generically describe as HOA, OOA, and column bleed (which is system background due to regular column phase desorption during thermal cycling of the GC oven). TAG-Bin-Particle-Pre dataset was originally solved for only two factors: HOA and OOA, as there is no column bleed background after chromatogram subtraction based on almost constant column bleed signal. Previous source apportionment of fine OA during SOAR has been reported using PMF analysis of AMS data (Docherty et al. Citation2011) and of individual TAG compounds (which is referred as TAG-integrated-Particle in this article) (Williams et al. Citation2010), and will later be compared to results from PMF analysis of binned TAG chromatograms as performed here. A simplified two factor PMF solution of AMS data (i.e., HOA and OOA) is used to test variables of the binning method (e.g., number of bins used, PMF error method) through comparison of HOA and OOA time series variations. For binned TAG PMF results, each factor gave a chromatogram for each sample, and all ion abundances of the chromatogram were summed to in order to get the time series variations.
FIG. 4 TAG SOAR sampling sequence and TAG binning datasets.
3. RESULTS AND DISCUSSION
3.1. PMF Error Estimation for TAG Binning Data
The solution to the PMF analysis depends on estimating the uncertainties (precisions) of each of the data values used in the PMF analysis. There are several error estimation methods. Previous work has reported the use of the “Ion Counting (IC) error method” which is used in estimating the uncertainties for AMS data (Docherty et al. Citation2011), and Method Detection Limit (MDL) error method which is used in EPA PMF error calculation (Eberly Citation2005). Here we compare these two error estimation methods for binned TAG data.
3.1.1. Ion Counting (IC) Error Method
Ion Counting (IC) error estimation is the type of error method typically used for AMS analysis. For AMS, the distribution of the number of detected ions for a given mass spectral peaks can be modeled as a Poisson distribution. The standard deviation (precision) of this distribution is equal to the square root of ion counts during the sampling period (Allan et al. Citation2003):[3]
Where N is the number of ions detected. For binned TAG data, the IC error method can be adapted as follows:[4]
[5]
Paatero and Hopke (2003) defined “bad” and “weak” signals as follows: if Signal-to-Noise Ratio SNR < 0.2, the signal is defined as “bad,” and if 0.2 < SNR < 2, as “weak” (Paatero and Hopke Citation2003). Paatero empirically found moderate downweighting of weak and bad variable signals, by factors of 2–3 and 5–10, respectively, can be useful in PMF analysis to help prevent conditions where good error estimation is difficult to get for variables near the detection limit (Paatero and Philip Citation2003). That procedure is a “rule of thumb” without a strong statistical basis. In this article, we choose 10 and 3 for downweighting the bad and weak variable signals to reduce the influence of the noisy variables. For the interpretation of Q/Qexp discussed above to be applicable, the bin signals need to be the actual total ion counts for the specific datapoint in the PMF data matrix. Prior to TAG binning data being utilized by PMF, the raw signals needed to be corrected in order to achieve right Q/Qexp due to the following three reasons. First, the quadrupole mass spectrometer used by TAG (Agilent 5973 MSD) measures different m/z sequentially, whereas the time of flight mass spectrometer (Tofwerk, Thun, Switzerland) used by AMS receives all m/z at the same time. So if the quadrupole mass spectrometer measures m/z from 29 to 550 (which was the full scan range of TAG during SOAR) in a certain time, each m/z is measured by 1/522 of this measurement period. Second, rescaling chromatogram retention time: this correction is applied to rescale the time steps of our bins of interest to occupy the entire 1-h period. By doing this, there are no remaining data gaps in the raw time series over the course of SOAR sampling period with the exception of instrument servicing periods. Third, TAG raw data is reported as total ion current (TIC) which was amplified by electron multiplier. So the amplified ion current signal should be converted to original ion counts signal. Overall, the correction of raw signals is applied as follows:[6]
For SOAR data, correction due to QMS MS scanning method = 1/(the difference of MS scan range) = 1/(550 – 28) = 1/522; correction for rescaling chromatogram retention time = 1 h/the difference of chromatogram retention time range of interest = 3600 (s)/((5850 – 650)/2.8(s)) = 1.94, in which 2.8 is MS scan frequency.
We have not been able to access information on converting TIC to original ion count for the Agilent 5973 MSD, and Agilent considers this information proprietary. Therefore, correction from TIC to original ion count has not been applied in this article, although we estimate it to be ∼1 since our Q/Qexp value is near a value of 1.
3.1.2. Method Detection Limit (MDL) Error Method
The second error method is called method detection limit (MDL), which was the combination of measurement uncertainty and detection limit:
where the percentage is the TAG measurement uncertainty, which is reported 10% for ambient air samples (Williams et al. Citation2006); and MDL is method detection limit, which was calculated by finding the peak value of the histogram of signal in low measurement range. This error method is based on EPA PMF technique (EPA PMF v.3.0), with increased uncertainty for low signal values. The histogram of measurements in the sampling period can have two modes—the big mode for real signal and the small mode for noise (see the online supplementary information (SI) Figure S1). The peak in small mode, which is called MDL in this article, is the point which separates signal from instrument noise. In the TAG binning data matrix (), there are actually three dimensions—chromatogram number from 1 to n with variable i, bin number from 1 to b with variable j, and m/z index number from 1 to m with variable k. If we reconstruct the data in three dimensions, frequency distributions of low signal can be obtained within Xi,j,k, where i is from 1 to n. The MDL is the expected value of the frequency distribution (Figure S2).
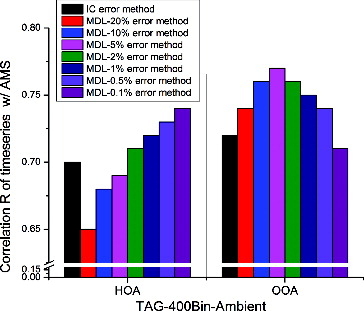
Regarding to the percentage of TAG measurement uncertainty, we applied a range of percentages between 0.1% and 20% in the MDL error method for TAG-Bin-Ambient. shows the Pearson's correlation coefficients R between AMS-HOA (or OOA) and the HOA derived from PMF analysis of TAG-400Bin-Ambient dataset, using both the MDL error method with different scaling percentages and using the IC error method. For HOA, R increases as the scaling percentage is reduced from 20% to 0.1%; for OOA, R increases from 20% to 5%, and then decreases from 5% to 0.1% with a maximum at 5%. Williams et al. (2006) reported the R2 of calibration curves with increasing standard concentrations in TAG for alkanes and PAHs which are major compounds of HOA ranges from 97.6% to 99.9%, which demonstrates the excellent linearity for alkanes and PAH in TAG. In contrast, the R2 for decanoic acid is only 81.6%, which shows some nonlinearity for acids in TAG. From triplicate samples, the reproducibility of acids was also worse than reproducibility of alkanes and PAHs. In other words, the uncertainty from the TAG instrument varies among different compound categories—HOA which contains alkanes and PAHs, etc., has lower uncertainty, and OOA which contains acids, etc., has higher uncertainty in TAG. In order to achieve balance between HOA and OOA, a scaling percentage of 2% is chosen for MDL error method. shows the Q/Qexp values corresponding to each PMF run with different error methods. If the error estimate of a data point or variable is too small or too large in comparison to the true errors, then an overweighting or downweighting occurs, which results in a very large or small Q/Qexp value. For example, 0.1% results in very large Q/Qexp which suggests the error is too small. Only the low percentage cases can produce reasonable Q/Qexp values. The ideal scaling percentage is perhaps variable and depends on the specific chemical content of the aerosol. If data contains more HOA (alkanes, PAHs, etc.), a lower scaling percentage might be chosen; if the data contains more OOA (acids, etc.), a larger percentage might be chosen.
Table 1 PMF Q/Qexp value of TAG-400Bin-Ambient dataset for different PMF error methods: IC and MDL error methods
FIG. 5 Correlations (R) of TAG-400Bin-Ambient time series with AMS HOA and OOA time series. Comparison was made among different PMF error methods: ion counting (IC) error method, which is the PMF error method for AMS data; and MDL error method. Different percentage in MDL method is the TAG measurement standard deviation, which is different for different compound.
3.1.3. Comparison Between the IC and MDL Error Methods
Although different scaling percentages in the MDL error method produce different correlation with AMS factors, the difference of correlation R between these two error methods are in the range of 0.05, indicating these two types of error estimation methods are similar for this dataset. The TAG-400Bin-Ambient factors from IC error versus MDL-2% error display a Pearson R correlation of 1.00 for the HOA factor and 1.00 for the OOA factor (Figure S3), also suggesting that PMF results with these alternative error estimates are very similar (Figure S4). HOA from the TAG-400Bin-Ambient dataset with IC error and MDL-2% error method versus CO displays a Pearson R correlation of 0.85 and 0.85 for IC error and MDL-2% error method, respectively (Figure S5), which again suggests that these two error estimations produce similar results. The comparison for these two error methods was also extended to 5 and 10 factor solutions from PMF (Figures S6–7, Tables S1–2). Those results also show that these two error methods can produce very similar PMF factors. For future use of the binned TAG data, it is suggested that the IC error method is a good beginning method due to its simplicity. One more information on the chemical composition of the OA is determined, a specific percentage can be chosen for MDL error method according to compound categories in order to improve PMF solutions. In an iterative process, perhaps a variable percentage for MDL error method calculation could be determined using a HOA/OOA ratio time series derived from an initial factor analysis.
3.2. Bin Resolution
The bin resolution of a single chromatogram determines the extent of chemical resolution that can be retrieved in the PMF solution. As more bins are used, each bin approaches the width of an individual compound peak and thus higher chemical resolution is possible. If each mass spectral scan is its own bin, then the bin number is 5200 for each chromatogram, and then individually-resolved compounds are distributed over ∼10 bins. The effect of bin number on PMF factor quality is investigated here.
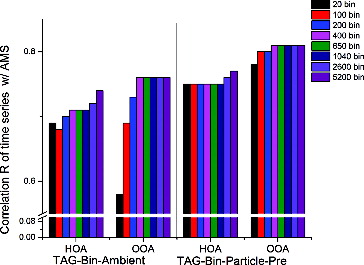
shows the correlation coefficients (R) between the time series of AMS-HOA (or OOA) with that of TAG-Bin-Ambient (or Particle-Pre) datasets using the MDL-2% error method with different bin number resolutions. For HOA of TAG-Bin-Ambient dataset, R is increasing as the number of bins is increased, with often a plateau observed for higher numbers of bins. The difference of maximum and minimum of R is 0.06. For HOA of TAG-Bin-Particle-Pre, the correlation R firstly saturates from bin 20 to 1040, and then increases from 1040 bin to 5200 bin. The difference of maximum and minimum of R is 0.02. The small R difference (0.06 and 0.02) of HOA from bin 20 to 5200 for both TAG-Bin-Ambient and TAG-Bin-Particle-Pre is likely due to the similarity of electron-impact mass spectra of compounds (for example alkane, alkene, and alkyne) which are grouped to HOA for different bins (i.e., a small alkane fragments into similar fragments as a large alkane). Minimal changes in HOA correlations through a range of bin sizes may also be due to covariance of all source types contributing to HOA, regardless of their mass spectral similarities which made them fit to stable solutions. Either way, chemical resolution as reflected by bin number is not very important for compounds which are grouped in HOA. For OOA of TAG-Bin-Ambient, the correlation R significantly increases (0.18) from bin 20 to 400, and finally saturates from bin 400 to 5200. This significant increase trend from bin 20 to 400 is probably because the mass spectra of compounds (for example acids, ketones, and phthalates) which are grouped to OOA show more variability across the chromatogram. So higher bin numbers, which allow higher chemical resolution, can better capture the variability of OOA mass spectra. However, when bin number reaches 400, the size of a single bin is already similar to the width of a single compound. With scanning frequency of 2.8, each of the 400 bin resolution bins captures 4.6 s of the chromatogram retention time (5200 scans/400 bins = 13 scans bin−1, and 13 scans/2.8 scans s−1 = 4.6 s). During SOAR, the TAG measured alkanes with an average peak width (retention time from beginning of compound elution to end of compound elution) of 4.8 s and acids (which display greater peak tailing) with an average peak width of 9 s. An increase over 400 bin resolution is not expected to allow resolving further chemical information. A bin number resolution of 400 appears to be a good compromise between sufficient chemical resolution and lower computing time compared to using higher bin numbers. For future studies, it is recommended that the bin size should match the narrowest peak widths of compounds found in the chromatogram. An improved correlation of OOA with higher bin resolution and relatively unchanged correlation of HOA for TAG-Bin-Ambient could indicate that OOA accounts for a small fraction of the total ion current since the quality of the separation doesn't change the variability in the concentration of HOA. However, it is observed that HOA and OOA account for nearly equivalent total ion signal (Figure S8). Since OOA was estimated to be about four times larger than HOA during this study (Docherty et al. Citation2011), this suggest that OOA is detected about four times less efficiently than HOA by this TAG system.
FIG. 6 Correlations (R) of TAG-Bin-Ambient and TAG-Bin-Particle-Pre time series with AMS HOA and OOA time series. Comparison was made among different bins: from 20 to 5200 bin. MDL-2% error method was used here.
3.3. Comparison Between TAG-Bin-Particle-Pre and TAG-Bin-Particle-Post
TAG Particle datasets can be obtained from the subtraction between ambient and filtered ambient data. The subtraction can happen before or after PMF analysis, referred to here as TAG-Bin-Particle-Pre and TAG-Bin-Particle-Post, respectively. These two types of TAG-Bin-Particle results were compared to see if any issues due to subtraction were introduced in one method and not the other. TAG-400Bin–Particle-Pre versus TAG-400Bin-Particle-Post using MDL-2% error method has a Pearson R correlation of 1.00 when comparing the HOA factor between methods and 1.00 for the OOA factor, suggesting these two types of TAG-Bin-Particle PMF analyses produce similar results (Figure S9). Figure S10 shows residuals of these two types of PMF analyses. The reason for these identical results could be a confirmation that error estimation for both PMF experiments are appropriate, producing identical HOA and OOA factors from these two methods that display accurate time variations that are unbiased by subtraction methods. However, for the future analyses of other datasets that require subtraction, it is still advisable to compare these two approaches.
3.4. Comparison of HOA (OOA) from Multiple TAG Analysis Techniques with AMS
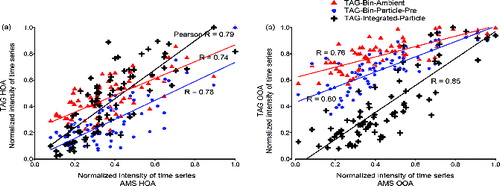
The correlation of PMF results from binned and peak-integrated analyses is compared here with AMS-HOA or OOA factors. shows scatter plots between of HOA (OOA) time series of TAG-Bin-Ambient, TAG-Bin-Particle-Pre, and TAG-Integrated-Particle with that of AMS. The TAG-Integrated-Particle (resolved particle-phase compounds of high abundance described by Williams et al. [Citation2010]) results in slightly higher correlation coefficients with AMS for both HOA and OOA although TAG-Bin-Particle-Pre contains more mass (i.e., incorporates all UCM). Higher offsets are also observed for the binned TAG datasets, especially for TAG-Bin-Ambient.
FIG. 7 Scatter plot of TAG versus AMS: (a) HOA; (b) OOA. Comparisons were made among TAG three choices: TAG-Bin-Ambient, TAG-Bin-Particle-Pre, and TAG-Integrated-Particle. 5200 bin and MDL-2% were used for TAG-Bin-Ambient and TAG-Bin-Particle-Pre.
One reason that TAG-Integrated-Particle may have a better correlation with particle phase HOA and OOA from the AMS is that the TAG-Integrated-Particle analysis only selected compounds that are on average >35% in particle phase to eliminate very large gas-phase subtractions, and selected only compounds with particle-phase time series (obtained from subtraction) having an R > 0.7 with its ambient (particle + gas) time series to conserve the variability after subtracting the gas-phase portion (Williams et al. Citation2010). So TAG-Integrated-Particle may better capture the variability of particle phase HOA and OOA than TAG-Bin-Particle-Pre because the selection criteria of TAG-Integrated-Particle decreases the error from the interpolation of filtered ambient data with poor time resolution into the higher time resolution ambient timeline. Another possible reason for lower correlation for TAG-Bin-Particle-Pre than using select resolved compounds may be that TAG-Bin-Particle-Pre contains everything in the chromatogram, including some unresolved species at low concentration that will occasionally approach or go below the TAG detection limit, where ion response becomes nonlinear (Kreisberg et al. Citation2009). The TAG instrument cannot capture the real variability of low concentration species without complex nonlinear calibration near detection limits. The organic loading does not appear to systematically affect the concentration of observed organic compounds (for example some compounds can increase and some can decrease at the same time depending on source contributions). Higher organic loading can affect the ambient phase partitioning of semivolatile organic compounds, and rapid changes in phase partitioning could contribute to the subtraction biases already referenced here. We also suspect an additional limitation from this dataset due to SOAR data containing more OOA than HOA, and this version of the TAG system is better at HOA measurement than OOA. Integrated PMF selects major HOA and OOA compounds, whereas binning PMF contains overwhelming HOA signals over OOA because much of the OOA does not transfer through the GC column. The integration method appears to increase the importance of key OOA marker compounds compared to the relatively low OOA signal detected in the binning method. Future work may be focusing on methods to adjust uncertainty values for low OOA signals to give them greater weight in the PMF fitting results, as will be important for source apportionment studies. The TAG-Bin-Ambient has lower correlations with AMS for both HOA and OOA, although the range of R values is narrow. This is likely due to TAG-Bin-Ambient containing semi-volatile gas that is not analyzed by AMS. The mass contribution of each factor can be calculated by a multivariate fit of the temporal contributions of PMF factors onto total AMS measured OA mass concentrations (Williams et al. Citation2010). Here we tried this method to recover the mass concentration of TAG-Bin PMF HOA and OOA factors. However, with a majority of OA during SOAR being OOA in nature, the variability of OOA and total OA are very similar and a simple two-factor solution apportions almost all of the mass to the OOA factor. A higher factor number solution yields a better fit as was performed by Williams et al. (Williams et al. Citation2010). This point is evidenced by the correlation between AMS total OA and specific AMS PMF factors, which is determined by Docherty (Docherty et al. Citation2011). The correlation of AMS combined OOA factors with AMS organics that is hourly averaged data for the defined 11-day focus period is R = 0.81. Here it is problematic to fit only two factors to AMS OA, when one of the factors (OOA) has almost very similar variability as AMS total organics. Here we compare only the variability of simple two-factor PMF solutions from various methods as opposed to mass-weighted calculation and comparison. The comparisons between TAG and AMS for the diurnal variations of HOA/(HOA+OOA) and OOA/(HOA+OOA) are presented in Figure S11. In the early morning, when total OA is made mostly of HOA, all three methods—AMS, TAG-Bin-Ambient and TAG-Bin-Particle-Pre show similar values for both OOA/(HOA+OOA) and HOA/(HOA+OOA), indicating that the TAG captures most OA in the atmosphere. Although AMS and TAG methods show similar HOA/(HOA+OOA) and OOA/(HOA+OOA) trends for afternoon measurements, the TAG-Bin-Ambient and TAG-Bin-Particle-Pre HOA(HOA+OOA) are higher than AMS HOA(HOA+OOA), while AMS OOA/(HOA+OOA) exceeds TAG OOA/(HOA+OOA). The deviation in TAG and AMS in the afternoon indicates that the TAG does not measure OOA in the atmosphere as completely as the AMS.
3.5. TAG-Bin-Particle PMF Higher Factor Solution
PMF of TAG-Bin-Particle-Pre was extended to 20 factors to explore the potential usefulness of additional TAG factors to obtain more information about ambient particle composition. Each factor gave a chromatogram for a single sample, and factor chromatograms are repeating (Figure S12). The repeated chromatograms were averaged to get a typical chromatogram for each factor. shows the averaged and typical chromatograms for 20 factor solution. And shows the mass spectra for the 20 factor solution. According to the mass spectra, the retention time in averaged chromatograms and diurnal trends (Figure S13) for each factor, chemical compositions were determined for each factor. The higher factor solution separates almost complete compound series as TAG-Integrated-Particle did, such as alkanes (Factor 10, abbreviated as F10), furanones (F8); monocarboxylic acids (F5); cyclohexanes (F2) and phthalates (F13), and even some individual compounds such as 1,4-dioxaspiro[5,5]undecan-3-one (F9); pentadecanone,6,10,14-trimethyl-(F12); propanol,1-chloro-,phosphate (3:1) (F14); and cyclotetrasiloxane, octamethyl-(F19). Factor F4 is a mixture of several different individual compounds: benzoic acid; benzyl benzoate; ethylhexyl benzoate; Ethanedione, diphenyl-, and benzophenone, which have very similar mass spectra. Factor F6 is also a mixture of several different individual compounds: benzyl benzoate; ethanone, 2,2-dimethoxy-1,2-diphenyl-; phenylacetic acid; diethyltoluamide and benzene, p-diacetyl-, etc., which also have similar mass spectra. Factor F20 is GC column bleed, of which signal contribution to total signal is low (Figure S14). This column bleed is due to the artifact of TAG-Bin-Gas timeline interpolation and subtraction of TAG-Bin-Ambient and TAG-Bin-Gas. In addition to the resolved materials, there are several factors that contain unresolved material, UCM – F3, F7, F11, F15, F16, F17, and F18. Factor F3 is showing up very early in the chromatograms. Because the GC column used in SOAR is a nonpolar column, this means that early-retention time material in the column, such as F3, may be polar and volatile. Factor F3 has dominant peaks at m/z 42 (CNO), m/z 64 (SO2), etc., which indicates F3 may be a nitrogen-containing and sulfur-containing mixture. Factor F7 is at early chromatogram with a mode at 30 min, and its diurnal trend has a maximum in the afternoon. Its mass spectrum has several peak series: the one is m/z 39,53,67,81,95,109,123 etc.; the one is m/z 51,65,79,93,107,121,135 etc.; the one is m/z 29,43,57,71,85,99, etc.; and the one is m/z 45,59,73,87, etc., all with a successive 14 unit. The m/z 29 series could be CHO series. According to the information we observe, F7 could not be a pure hydrocarbon, and it might an oxygen-containing mixture. F11 is at late chromatogram with two modes at 37 min and 45 min. Its mass spectrum has a dominant peak at m/z 97. The diurnal trend of F11 has a maximum at early morning. F15 is a mid-volatility UCM factor with a mode at 35 min and it has a mass spectrum with dominant peaks at m/z 133, 115, 128, 129, 165, etc. The m/z 115, 128, 165 are considered as aromatic signatures (Gross et al. Citation2000; Silva and Prather Citation2000). F16 is a lower-volatility UCM factor with two modes at 37 min and 45 min, and it has a mass spectrum with dominant peaks at m/z 83, 69, 55, 111, 81, 95, etc. These ion series are present in mass spectra of dienes, alkynes, and cycloalkenes (McLafferty Citation1993). Ulbrich also found similar peak series in an AMS dataset (Ulbrich Citation2011). F17 is very similar to F16, almost at the same retention times, similar mass spectra and diurnal trend. F18 is at chromatogram with a mode at 40 min, and it has a mass spectrum with dominant peaks at m/z 36, 44, 55, 38, 79, etc. The diurnal trend shows F18 has high concentration in the morning. The m/z 36 and 79 could potentially be C3+ and C6H7+, which are associated with low hydrogen to carbon ratio in the parent organics. The integrated compounds that are identified in each factor were summed up. The correlations of summed integrated compounds with corresponding factors are very good for most of factors, such F10 (alkane series) − R = 0.92; F5 (carboxylic acid series) − R = 0.89 and F13 (phthalates) R = 0.86 and so on (Figure S15). The hourly time variation correlations between these 20 factors are shown in Table S3. It shows some factors correlate with each other very well—such as F6 and F2 with R = 0.94, F8 and F10 with R = 0.98. It is not thought that a 20-factor solution is representative of different atmospheric processes or emission sources. According to Paatero, anything over approximately 10 factors will largely cause “factor-splitting.” With the structure of our data, this factor-splitting may be further separating compounds that come from the same “source” into subgroups that have similar mass spectral features. This splitting is helpful for our study here, where we attempting to deconvolve the structure of our chromatograms, but may not be helpful when attempting a source apportionment analysis. Our current study found using the binning technique for source apportionment analysis is promising if the bin number dimension (also called retention time dimension) is taken from row to column dimension in binning data matrix (see binning data structure in with bin number in row dimension). The source apportionment using binning technique is the subject of further work.
FIG. 8 (1–20) Averaged chromatograms for Factor 1–20 (F1-F20) in PMF 20 factor solution on TAG-400Bin-Particle-Pre with MDL 2% error method.
FIG. 8 (Continued)
FIG. 9 (1–20) Mass spectra for Factor 1–20 (F1-F20) in PMF 20 factor solution on TAG-400Bin-Particle-Pre with MDL 2% error method.
FIG. 9 (Continued)
3.6. Comparison of PMF Higher Factor Solutions
PMF of AMS was reported as a six-factor solution for this campaign: HOA (Hydrocarbon-like OA), LOA-AC (Amine-Containing Local-OA), LOA-2 (Local-OA 2), MV-OOA (Medium-Volatility Oxygenated-OA), SV-OOA (Semi-Volatile Oxygenated-OA), cLV-OOA (composite Low-Volatility Oxygenated-OA) (Docherty et al. Citation2011). shows the correlation coefficients of time series from comparison of 20 factors of TAG-400Bin-Particle-Pre with these six factors from AMS PMF analysis. AMS LOA-AC (Amine-Containing Local-OA) has good correlation (R = 0.4) with F3 which is considered as nitrogen-containing UCM. AMS HOA has good correlation with F8 (furanones, R = 0.7), F10 (alkanes, R = 0.8), F11 (R = 0.8), F12 (2-Pentadecanone,6,10,14-trimethyl, R = 0.7), F16-17 (associated with alkenes R = 0.8 and alkynes R = 0.7), and F20 (column bleed R = 0.8). There could be some high molecular weight alkanes associated with column bleed, which increased the F20 correlation with AMS-HOA. AMS SV-OOA has good correlation (R = 0.2) with F9 (1,4-dioxaspiro[5,5]undecan-3-one). Many factors have good correlation with AMS cLV-OOA and MV-OOA. For example, they both have good correlation with F2 (cyclohexanes R = 0.5 for cLV-OOA and R = 0.7 for MV-OOA), F5 (monocarboxylic acids R = 0.5 for cLV-OOA and R = 0.7 for MV-OOA), F7 (R = 0.7 for cLV-OOA and R = 0.9 for MV-OOA), and F14 (2-propanol, 1-chloro-, phosphate (3:1) R = 0.7 for cLV-OOA and R = 0.8 for MV-OOA). F3 has good correlation (R = 0.8) with cLV-OOA. F3 appears volatile based on its retention time, but it has good correlation with AMS low volatile factor. It is possible that F3 is a thermal decomposition product of low volatility compounds that is created when the TAG system initially heats sample to deliver to the GC column (the focus of future work). AMS MV-OOA also has good correlation with F4 (Benzoic acid, Benzyl benzoate etc. R = 0.5), F13 (Phthalates R = 0.6), and F15 (R = 0.5).
FIG. 10 Correlations (R) of time series from comparison of 20 factor solution of TAG-400Bin-Particle-Pre (Figures 8 and 9) with 6 factors of AMS: HOA (Hydrocarbon-like OA), LOA-AC (Amine-Containing Local-OA), LOA-2 (Local-OA 2), MV-OOA (Medium-Volatility Oxygenated-OA), SV-OOA (Semi-Volatile Oxygenated-OA), and cLV-OOA (composite Low-Volatility Oxygenated-OA).
4. CONCLUSIONS AND FUTURE WORK
A new technique for data analysis of gas chromatograms was investigated using the TAG dataset from the Study of Organic Aerosol at Riverside (SOAR) 2005. The hourly chromatograms were divided into evenly spaced “chromatography bins” of which the summed mass spectra were used to perform factor analysis by PMF for separation of major components. This method significantly speeds up data analysis of high-time resolution chromatography sampling and incorporates UCM mass, in comparison to the traditional analysis method of chromatograms where individual compounds are identified and integrated.
Two PMF error estimation methods, termed “IC” and “MDL” (the latter with different scaling percentages), were applied to chromatogram binning data. Both methods produce similar factor components, suggesting that for this specific type of data, the PMF results are not highly sensitive to the PMF error estimation method used. This has not been the case for previous data sets (e.g., AMS) where individual mass spectral patterns are more similar to each other (e.g., many common ion fragments), and may only hold true for chromatography-type data where individual mass spectral patterns show greater differences due to increased chemical resolution. Increasing the number of bins used (i.e., the number of chromatography bins each chromatogram was divided into) improves PMF results until reaching 400 volatility bins, where bin size is approximately the peak width of a single compound in the chromatograms. Over 400 bins, further resolution does not significantly improve PMF results. Simplified two-factor PMF results were compared between bin-based and peak-integration chromatogram analysis methods. While results are similar, comparison shows the peak-integration method correlates slightly better with a two-factor AMS PMF solution, potentially due to the incorporation of an uncorrected nonlinear response of UCM material near the detection limit when using the bin-based method. The advantage of the bin-based method is that it takes orders of magnitude less time (over two orders of magnitude for SOAR dataset) to analyze compared to the peak-integration method. The 20-factor PMF results of bin-based data were able to separate individual compounds, homologous compound series, and UCM. The comparison of high-factor solution between bin-base TAG (20-factor solution) and AMS (6-factor solution) was made. Good correlations demonstrate TAG and AMS are complementary OA measurement techniques. For high-factor solutions, PMF analysis of bin-based TAG data appears to largely deconvolve complex chromatogram structures, as opposed to determine major sources. However, high correlation among several bin-based TAG factors and major AMS components adds further chemical identification to generic AMS factors. Future investigation will be focused on applying this binning method to source apportionment as well as new PMF techniques—three-dimension PMF to better determine major OA sources and transformation processes in the atmosphere. The detailed comparison of specific source-related factors instead of HOA and OOA between this method and other source apportionment methods (i.e., AMS and TAG-Integrated PMF factors) will be executed in future work..
The present study only applied the binning technique to 1-D chromatogram data. It will be of interest to apply the binning technique to 2-D chromatogram data which minimizes the UCM component. Due to the sample mode limitation in SOAR (i.e., switching between ambient and filtered ambient sampling) there was a need to interpolate between samples to obtain “particle” data. It will be of interest to perform the binning technique developed here directly to denuded particle data that does not require interpolation and any associated biases. Finally, since the MDL error estimation was shown to be dependent on chemical composition, it will also be of interest to determine a variable percentage for MDL error as a function of the HOA/OOA ratio time series derived from an initial factor analysis. Recent advances have been made in the TAG instrumentation community to develop an online derivatization technique to achieve higher throughput of OA (Isaacman et al. 2014) as well as a volatility and polarity separator, a TAG-based technology that utilizes shorter transfer lines and shorter chromatography separation to increase mass throughput of oxygenated species. These methods move TAG quantification closer to that of the AMS, and the binning analysis method developed here will continue to be applicable to these new methods as well as other methods that achieve additional molecular separation.
SUPPLEMENTAL MATERIAL
Supplemental data for this article can be accessed on the publisher's website.
Rapid_analysis_method_for_TAG_data_-_supplementary_information.zip
Download Zip (5.5 MB)Additional information
Funding
REFERENCES
- Aiken, A. C., DeCarlo, P. F., and Jimenez, J. L. (2007). Elemental Analysis of Organic Species with Electron Ionization High-Resolution Mass Spectrometry. Anal. Chem., 79:8350–8358.
- Allan, J. D., Jimenez, J. L., Williams, P. I., Alfarra, M. R., Bower, K. N., Jayne, J. T., et al. (2003). Quantitative Sampling using an Aerodyne Aerosol Mass Spectrometer - 1. Techniques of Data Interpretation and Error Analysis. J. Geophys. Res. Atmos., 108.
- Bauer, J. J., Yu, X. Y., Cary, R., Laulainen, N., and Berkowitz, C. (2009). Characterization of the Sunset Semi-Continuous Carbon Aerosol Analyzer. J. Air Waste Manag. Assoc., 59:826–833.
- Baumer, D., Vogel, B., Versick, S., Rinke, R., Mohler, O., and Schnaiter, M. (2008). Relationship of Visibility, Aerosol Optical Thickness and Aerosol Size Distribution in an Ageing Air Mass Over South-West Germany. Atmos. Environ., 42:989–998.
- Canagaratna, M. R., Jayne, J. T., Jimenez, J. L., Allan, J. D., Alfarra, M. R., Zhang, Q., et al. (2007). Chemical and Microphysical Characterization of Ambient Aerosols with the Aerodyne Aerosol Mass Spectrometer. Mass Spectrom. Rev., 26:185–222.
- Chueinta, W., Hopke, P. K., and Paatero, P. (2000). Investigation of Sources of Atmospheric Aerosol at Urban and Suburban Residential Areas in Thailand by Positive Matrix Factorization. Atmos. Environ. 34:3319–3329.
- Decesari, S., Mircea, M., Cavalli, F., Fuzzi, S., Moretti, F., Tagliavini, E., et al. (2007). Source Attribution of Water-Soluble Organic Aerosol by Nuclear Magnetic Resonance Spectroscopy. Environ. Sci. Technol., 41:2479–2484.
- Dimitrova, R., Lurponglukana, N., Fernando, H. J. S., Runger, G. C., Hyde, P., Hedquist, B. C., et al. (2012). Relationship Between Particulate Matter and Childhood Asthma - Basis of a Future Warning System for Central Phoenix. Atmos. Chem. Phys., 12:2479–2490.
- Docherty, K. S., Aiken, A. C., Huffman, J. A., Ulbrich, I. M., DeCarlo, P. F., Sueper, D., et al. (2011). The 2005 Study of Organic Aerosols at Riverside (SOAR-1): Instrumental Intercomparisons and Fine Particle Composition. Atmos. Chem. Phys., 11:12387–12420.
- Docherty, K. S., Stone, E. A., Ulbrich, I. M., DeCarlo, P. F., Snyder, D. C., Schauer, J. J., et al. (2008). Apportionment of Primary and Secondary Organic Aerosols in Southern California during the 2005 Study of Organic Aerosols in Riverside (SOAR-1). Environ. Sci. Technol., 42:7655–7662.
- Dockery, D. W., Pope, C. A., Xu, X. P., Spengler, J. D., Ware, J. H., Fay, M. E., et al. (1993). An Association Between Air-Pollution and Mortality in 6 United-States Cities. N Eng. J. Med., 329:1753–1759.
- Eberly, S. (2005). EPA PMF 1.1 User's Guide, U.S. EPA, Washington, DC.
- Felinger, A., Pasti, L., and Dondi, F. (1990a). Fourier-Analysis of Multicomponent Chromatograms - Theory and Models. Anal. Chem., 62:1846–1853.
- Felinger, A., Pasti, L., and Dondi, F. (1992). Fourier-Analysis of Multicomponent Chromatograms—Recognition of Retention Patterns. Anal. Chem., 64:2164–2174.
- Felinger, A., Pasti, L., Reschiglian, P., and Dondi, F. (1990b). Fourier-Analysis of Multicomponent Chromatograms—Numerical Evaluation of Statistical Parameters. Anal. Chem., 62:1854–1860.
- Goldstein, A. H., Worton, D. R., Williams, B. J., Hering, S. V., Kreisberg, N. M., Panic, O., et al. (2008). Thermal Desorption Comprehensive Two-Dimensional Gas Chromatography for In-Situ Measurements of Organic Aerosols. J. Chromatogr. A 1186:340–347.
- Gross, D. S., Galli, M. E., Silva, P. J., Wood, S. H., Liu, D. Y., and Prather, K. A. (2000). Single Particle Characterization of Automobile and Diesel Truck Emissions in the Caldecott Tunnel. Aerosol Sci. Technol., 32:152–163.
- Hallquist, M., Wenger, J. C., Baltensperger, U., Rudich, Y., Simpson, D., Claeys, M., et al. (2009). The Formation, Properties and Impact of Secondary Organic Aerosol: Current and Emerging Issues. Atmos. Chem. Phys., 9:5155–5236.
- Ho, S. S. H., Yu, J. Z., Chow, J. C., Zielinska, B., Watson, J. G., Sit, E. H. L., et al. (2008). Evaluation of an in-Injection Port Thermal Desorption-Gas Chromatography/Mass Spectrometry Method for Analysis of Non-Polar Organic Compounds in Ambient Aerosol Samples. J. Chromatogr. A, 1200:217–227.
- IPCC (2007). Climate Change 2007: The Physical Scientific Basis. Cambridge, England.
- Ito, K., Xue, N., and Thurston, G. (2004). Spatial Variation of PM2.5 Chemical Species and Source-Apportioned Mass Concentrations in New York City. Atmos. Environ., 38:5269–5282.
- Jimenez, J. L., Canagaratna, M. R., Donahue, N. M., Prevot, A. S. H., Zhang, Q., Kroll, J. H., et al. (2009). Evolution of Organic Aerosols in the Atmosphere. Science 326:1525–1529.
- Kanakidou, M., Seinfeld, J. H., Pandis, S. N., Barnes, I., Dentener, F. J., Facchini, M. C., et al. (2005). Organic Aerosol and Global Climate Modelling: A Review. Atmos. Chem. Phys., 5:1053–1123.
- Kreisberg, N. M., Hering, S. V., Williams, B. J., Worton, D. R., and Goldstein, A. H. (2009). Quantification of Hourly Speciated Organic Compounds in Atmospheric Aerosols, Measured by an In-Situ Thermal Desorption Aerosol Gas Chromatograph (TAG). Aerosol Sci. Technol., 43:38–52.
- Lee, D. D., and Seung, H. S. (1999). Learning the Parts of Objects by Non-Negative Matrix Factorization. Nature 401:788–791.
- Lee, E., Chan, C. K., and Paatero, P. (1999). Application of Positive Matrix Factorization in Source Apportionment of Particulate Pollutants in Hong Kong. Atmos. Environ., 33:3201–3212.
- Maria, S. F., Russell, L. M., Turpin, B. J., and Porcja, R. J. (2002). FTIR Measurements of Functional Groups and Organic Mass in Aerosol Samples Over the Caribbean. Atmos. Environ., 36:5185–5196.
- Mauderly, J. L., and Chow, J. C. (2008). Health Effects of Organic Aerosols. Inhalat. Toxicol., 20:257–288.
- McLafferty, F. (1993). Interpretation of Mass Spectra. University Science Books, Mill Valley, CA.
- Ng, N. L., Canagaratna, M. R., Jimenez, J. L., Zhang, Q., Ulbrich, I. M., and Worsnop, D. R. (2011). Real-Time Methods for Estimating Organic Component Mass Concentrations from Aerosol Mass Spectrometer Data. Environ. Sci. Technol., 45:910–916.
- Noble, C. A., and Prather, K. A. (2000). Real-Time Single Particle Mass Spectrometry: A Historical Review of a Quarter Century of the Chemical Analysis of Aerosols. Mass Spectrom. Rev., 19:248–274.
- Paatero, P. (1997). Least Squares Formulation of Robust Non-Negative Factor Analysis. Chemometr. Intell. Lab. Sys., 37:23–35.
- Paatero, P., and Hopke, P. (2003). Discarding or Downweighting High-Noise Variables in Factor Analytic Models. in Analytica Chimica Acta, 490:277–289.
- Pietrogrande, M. C., Mercuriali, M., and Pasti, L. (2007). Signal Processing of GC-MS Data of Complex Environmental Samples: Characterization of Homologous Series. Anal. Chim. Acta, 594:128–138.
- Pietrogrande, M. C., Mercuriali, M., Pasti, L., and Dondi, F. (2009). Data Handling of Complex GC-MS Chromatograms: Characterization of n-Alkane Distribution as Chemical Marker in Organic Input Source Identification. Analyst, 134:671–680.
- Pietrogrande, M. C., Mercuriali, M., Perrone, M. G., Ferrero, L., Sangiorgi, G., and Bolzacchini, E. (2010). Distribution of n-Alkanes in the Northern Italy Aerosols: Data Handling of GC-MS Signals for Homologous Series Characterization. Environ. Sci. Technol., 44:4232–4240.
- Pietrogrande, M. C., Zampolli, M. G., Dondi, F., Szopa, C., Sternberg, R., Buch, A., et al. (2005). In Situ Analysis of the Martian Soil by Gas Chromatography: Decoding of Complex Chromatograms of Organic Molecules of Exobiological Interest. J. Chromatog. A, 1071:255–261.
- Pope, C. A., Ezzati, M., and Dockery, D. W. (2009). Fine-Particulate Air Pollution and Life Expectancy in the United States. N. Engl. J. Med. 360:376–386.
- Ramadan, Z., Song, X. H., and Hopke, P. K. (2000). Identification of Sources of Phoenix Aerosol by Positive Matrix Factorization. J. Air Waste Manage. Assoc., 50:1308–1320.
- Ramanathan, V., Crutzen, P. J., Kiehl, J. T., and Rosenfeld, D. (2001). Atmosphere - Aerosols, Climate, and the Hydrological Cycle. Science, 294:2119–2124.
- Reff, A., Eberly, S. I., and Bhave, P. V. (2007). Receptor Modeling of Ambient Particulate Matter Data using Positive Matrix Factorization: Review of Existing Methods. J. Air Waste Manage. Assoc., 57:146–154.
- Schauer, J. J., Rogge, W. F., Hildemann, L. M., Mazurek, M. A., Cass, G. R., and Simoneit, B. R. T. (1996). Source Apportionment of Airborne Particulate Matter using Organic Compounds as Tracers. Atmos. Environ., 30:3837–3855.
- Schwartz, J., Dockery, D. W., and Neas, L. M. (1996). Is Daily Mortality Associated Specifically with Fine Particles? J. Air Waste Manag. Assoc., 46:927–939.
- Silva, P. J., and Prather, K. A. (2000). Interpretation of Mass Spectra from Organic Compounds in Aerosol Time-of-Flight Mass Spectrometry. Anal. Chem., 72:3553–3562.
- Sisler, J. F., and Malm, W. C. (1994). The Relative Importance of Soluble Aerosols to Spatial and Seasonal Trends of Impaired Visibility in the United-States. Atmos. Environ., 28:851–862.
- Ulbrich, I. (2011). Characterization of Positive Matrix Factorization Methods and Their Application to Ambient Aerosol Mass Spectra, in Department of Chemistry and Biochemistry, University of Colorado, Boulder, Colorado.
- Ulbrich, I. M., Canagaratna, M. R., Cubison, M. J., Zhang, Q., Ng, N. L., Aiken, A. C., et al. (2012). Three-Dimensional Factorization of Size-Resolved Organic Aerosol Mass Spectra from Mexico City. Atmos. Meas. Tech., 5:195–224.
- Ulbrich, I. M., Canagaratna, M. R., Zhang, Q., Worsnop, D. R., and Jimenez, J. L. (2009). Interpretation of Organic Components from Positive Matrix Factorization of Aerosol Mass Spectrometric Data. Atmos. Chem. Phys., 9:2891–2918.
- White, W. H., and Roberts, P. T. (1977). Nature and Origins of Visibility-Reducing Aerosols in Los-Angeles Air Basin. Atmos. Environ., 11:803–812.
- Williams, B. J., Goldstein, A. H., Kreisberg, N. M., and Hering, S. V. (2006). An in-situ Instrument for Speciated Organic Composition of Atmospheric Aerosols: Thermal Desorption Aerosol GC/MS-FID (TAG). Aerosol Sci. Technol., 40:627–638.
- Williams, B. J., Goldstein, A. H., Kreisberg, N. M., Hering, S. V., Worsnop, D. R., Ulbrich, I. M., et al. (2010). Major Components of Atmospheric Organic Aerosol in Southern California as Determined by Hourly Measurements of Source Marker Compounds. Atmos. Chem. Phys., 10:11577–11603.
- Williams, B. J., Jayne, J. T., Lambe, A. T., Hohaus, T., Kimmel, J. R., Sueper, D., et al. (2014). The First Combined Thermal Desorption Aerosol Gas Chromatograph—Aerosol Mass Spectrometer (TAG-AMS). Aerosol Sci. Technol., 48:358–370.
- Zhang, Q., Jimenez, J. L., Canagaratna, M. R., Allan, J. D., Coe, H., Ulbrich, I., et al. (2007). Ubiquity and Dominance of Oxygenated Species in Organic Aerosols in Anthropogenically-Influenced Northern Hemisphere Midlatitudes. Geophys. Res. Lett., 34:13801–13806.
- Zhang, Q., Jimenez, J. L., Canagaratna, M. R., Ulbrich, I. M., Ng, N. L., Worsnop, D. R., et al. (2011). Understanding Atmospheric Organic Aerosols via Factor Analysis of Aerosol Mass Spectrometry: A Review. Anal. Bioanal. Chem., 401:3045–3067.
- Zhao, Y., Kreisberg, N. M., Worton, D. R., Isaacman, G., Gentner, D. R., Chan, A. W. H., et al. (2013a). Sources of Organic Aerosol Investigated using Organic Compounds as Tracers Measured During CalNex in Bakersfield. J. Geophys. Res.: Atmos., 118:2012JD019248.
- Zhao, Y. L., Kreisberg, N. M., Worton, D. R., Teng, A. P., Hering, S. V., and Goldstein, A. H. (2013b). Development of an In Situ Thermal Desorption Gas Chromatography Instrument for Quantifying Atmospheric Semi-Volatile Organic Compounds. Aerosol Sci. Technol., 47:258–266.