
Abstract
Electronic cigarettes (e-cigarette) have emerged as a popular electronic nicotine delivery system (ENDS) in the last decade. Despite the absence of combustion products and toxins such as carbon monoxide (CO) and tobacco-specific nitrosamines (TSNA), carbonyls including short-chain, toxic aldehydes have been detected in e-cigarette-derived aerosols up to levels found in tobacco smoke. Given the health concerns regarding exposures to toxic aldehydes, understanding both aldehyde generation in e-cigarette and e-cigarette exposure is critical. Thus, we measured aldehydes generated in aerosols derived from propylene glycol (PG): vegetable glycerin (VG) mixtures and from commercial e-liquids with flavorants using a state-of-the-art carbonyl trap and mass spectrometry. To track e-cigarette exposure in mice, we measured urinary metabolites of 4 aldehydes using ULPC-MS/MS or GC-MS. Aldehyde levels, regardless of abundance (saturated: formaldehyde, acetaldehyde ≫ unsaturated: acrolein, crotonaldehyde), were dependent on the PG:VG ratio and the presence of flavorants. The metabolites of 3 aldehydes – formate, acetate, and 3-hydroxypropyl mercapturic acid (3-HPMA; acrolein metabolite) – were increased in urine after e-cigarette aerosol and mainstream cigarette smoke (MCS) exposures, but the crotonaldehyde metabolite (3-hydroxy-1-methylpropylmercapturic acid, HPMMA) was increased only after MCS exposure. Interestingly, exposure to menthol-flavored e-cigarette aerosol increased the levels of urinary 3-HPMA and sum of nicotine exposure (nicotine, cotinine, trans-3′-hydroxycotinine) relative to exposure to a Classic Tobacco-flavored e-cigarette aerosol. Comparing these findings with aerosols of other ENDS and by measuring aldehyde-derived metabolites in human urine following exposure to e-cigarette aerosols will further our understanding of the relationship between ENDS use, aldehyde exposure, and health risk.
© 2018 American Association for Aerosol Research
EDITOR:
Introduction
Electronic cigarettes (e-cigarette) are battery-powered devices that produce heat, not burned (non-combusted) aerosols, and are one of the many electronic nicotine delivery systems (ENDS). E-cigarette devices aerosolize an “e-liquid” solution that contains a variable percentage of nicotine (Siegel, Tanwar, and Wood Citation2011) and flavorants. In recent years, the number of e-cigarette adult and youth users has increased rapidly in the United States (Bunnell et al. Citation2015; King et al. Citation2015; Jamal et al. Citation2017). The growing popularity of e-cigarettes has raised serious public health concerns of potential harm to e-cigarette users (Benowitz Citation2014; Bhatnagar et al. Citation2014; Gostin and Glasner Citation2014). For example, the exponential rise of e-cigarette use amongst youth likely increases nicotine addiction and transition to tobacco cigarettes (Bunnell et al. Citation2015; National Academy of Sciences Citation2018). A link between e-cigarette use and risk stems from the presence of harmful and potentially harmful constituents (HPHC) identified in aerosols of e-cigarettes, including metals, particles, carbonyls, and flavoring compounds (Fuoco et al. Citation2014; Goniewicz et al. Citation2014; Kosmider et al. Citation2014; Jensen et al. Citation2015; Farsalinos et al. Citation2015a; Allen et al. Citation2016; Ogunwale et al. Citation2017). Some of the aldehydes, acrolein, acetaldehyde, and formaldehyde are considered the most significant cardiovascular and pulmonary toxins in tobacco smoke (Haussmann Citation2012).
The type of ENDS device, e-liquid composition, and puff topography are the principal factors that determine the extent of toxic carbonyl compound generation in the aerosol. The temperature of the heating coil for aerosolization of an e-liquid is a function of the battery power output determined by the battery voltage output and the coil resistance. The temperature of the heating coil is also affected by the amount of heat transferred to vapor or aerosol as determined by the puff volume or air flow rate, puff duration, and the puff frequency, and a theoretical model has been developed to predict the coil temperature of the atomizer (Talih et al. Citation2015). The battery power output is the critical factor for determining the coil temperature and several publications have indicated that the battery power output dramatically affects the generation of aldehydes in aerosols (Kosmider et al. Citation2014; Jensen et al. Citation2015; Shihadeh, Talih, and Eissenberg Citation2015; El-Hellani et al. Citation2018). Moreover, high-battery power output could cause wick starvation and lead to a “dry puff” wick that exponentially increases the generation of formaldehyde, acetaldehyde, and acrolein (Jensen et al. Citation2015; Nitzkin, Farsalinos, and Siegel Citation2015).
Thousands of e-liquids are commercially available. In addition to small amounts of water, nicotine, and flavoring compounds, the two main components of e-liquids are propylene glycol (PG) and vegetable glycerin (VG, glycerol). Beyond sensorial attributes of PG (a “throat hit” sensation) and VG (naturally sweet taste, larger, thicker aerosol “cloud”), there is concern that the significant amounts of humectant-derived carbonyls that are generated may elevate health risk. Similar to humectants that are generally regarded as safe (GRAS) for ingestion, flavoring chemicals added to e-liquids are detected in e-cigarette-derived aerosols for which health risk estimates upon inhalation exposure are unknown (Farsalinos et al. Citation2015b; Allen et al. Citation2016). Since carbonyls and flavorants are ubiquitous in the environment, including in foods and beverages as well as endogenous products of metabolism, it is difficult to estimate in humans how much exposure is derived from each specific source. Several cross-sectional population-based studies have linked conventional tobacco exposures with select urinary aldehyde (e.g., acrolein, crotonaldehyde) metabolites (Alwis et al. Citation2015; Jain Citation2015), yet there remains a need to link biomarkers of e-cigarette exposure (e.g., specific aerosol components) in order to refine estimates of exposure (Schick et al. Citation2017) and risk of cardiovascular harm.
To address these unmet needs, our study compares carbonyl compounds generated from varying mixtures of humectants PG and VG with corresponding compounds in aerosols of select, popular e-liquids. We also looked at urinary metabolites of four common aldehydes in tobacco-product exposed mice to evaluate their potential utility as biomarkers of exposure. While e-cigarette aerosols contain variable amounts of aldehydes dependent on constituents and device/use characteristics, the use of common urinary aldehyde metabolites to estimate both exposure and health risks of e-cigarettes, in general, remains a challenging endeavor.
Materials and methods
Materials
Propylene glycol (PG; >99.5%) and vegetable glycerin (VG; 99.5%), as well as LC-MS grade methanol, were purchased from Sigma-Aldrich (Milwaukee, WI). Several brands of e-cigs and e-liquids were purchased locally or online: Set I (blu®: Classic Tobacco, CT; Magnificent Menthol, MM; Vivid Vanilla, VV; Cherry Crush, CC) and Set II (Halo®: Menthol, Mocha Café, Southern Ice). As labeled by the vendor, Set I e-cartridges contained 13–16 mg nicotine, whereas Set II e-liquids contained 6 mg/mL nicotine. Ultra-pure water was used in making solutions (Milli-Q system; Millipore Corporation; Bedford, MA). KY reference cigarettes, 3R4F, were purchased from the Center for Tobacco Reference Products (Univ. Kentucky; Lexington, KY). Isotopically-labeled standards (IS) for UPLC-MS/MS analysis: d3-nicotine, d3-cotinine, d3-3-hydroxycotinine (d3-3HC), d3-3-hydroxypropyl mercapturic acid (d3-3HPMA), and d3-N-Acetyl-S-(3-hydroxypropyl-1-methyl)-L-cysteine (d3-HPMMA) were purchased from Toronto Research Chemicals (Toronto, Canada).
E-cigarette aerosol and tobacco smoke generation and exposures
E-cigarette aerosol generation
A software-controlled (FlexiWare) cigarette-smoking robot (CSR)(SCI-REQ; Montreal, CAN) system regulated the mechanical generation of aerosols from KY Reference cigarettes (3R4F), e-cigarette cartridges (blu®), e-liquids and carrier solutions (PG, VG, PG:VG mixtures). To quantify and better understand the source of aldehydes in e-cigarette aerosols, we used commercial blu® e-cig cartridges (first generation), e-liquids and defined PG:VG mixtures. For analyses of aldehydes in e-cig/e-liquid-generated aerosols, a total of 10 puffs was collected into a 10 L Tedlar bag. A total volume of about 5 L was dilution air. A sample (500 mL) was transferred to a 1 L Tedlar bag for flow through a silicon microreactor, which was performed <2 h after aerosol collection. For analysis of aldehydes in blu e-cigarette cartridges (i.e., CT; MM; VV; CC) generated aerosols, multiple puffs (from first half of e-cigarette contents by weight) were collected. The battery of blu® e-cig has a voltage output of 3.7 V along with the cartridges with a coil resistance of 3.0 Ohm (power output 4.56 W). To generate aerosols from e-liquids and carrier solutions, e-liquids, PG or VG (or mix of PG:VG) were loaded into a refillable, clear tank (≈0.5 mL) atomizer with a coil resistance of 1.8 Ohm (Mistic Bridge; purchased online) coupled with a rechargeable bluPLUS+™ (3.7 V) battery (power output 7.6 W). The cartridge or tank was weighed before and after sessions to calculate solution consumption. Neat (100%) PG and VG (physical chemistry of PG and VG in Supplementary Table 1) as well as PG and VG mixtures consisting of 25:75 wt%, 50:50 wt%, and 75:25 wt% PG:VG were used for carrier-derived aerosols.
Mice and exposures
Male C57BL6/J mice are used widely in tobacco exposure and aldehyde metabolism studies (Conklin et al. Citation2009a; Citation2009b) and were obtained from The Jackson Laboratories (Bar Harbor, ME). Mice were treated according to the Guide for the Care and Use of Laboratory Animals, and all protocols were approved by the University of Louisville Institutional Animal Care and Use Committee (IACUC). Mice were housed under pathogen-free conditions in a University of Louisville vivarium under controlled temperature and a 12 h:12 h light: dark cycle. Mice were provided with a standard chow diet (Rodent Diet 5010, 4.5% fat by weight, LabDiet; St. Louis, MO) and water ad libitum.
Mice (12–20 weeks old; n = 5–6 per exposure) were exposed whole body to mainstream cigarette smoke (MCS; 3R4F; 6h) or e-cig aerosol (blu; 4 h) generated using a CSR as described above. The exposure system schematic, exposure protocols, estimated mass concentration and particle size data are shown in Supplementary Figure 1. Reference 3R4F tobacco cigarettes were humidified (24 h; 60+/-1% RH; Boveda Inc., Minnetonka, MN) prior to each day’s exposure (12 cigarettes) following International Standard of Organization (ISO) protocol (i.e., 2 s puff, 35 mL puff, 1 puff/min, 9 puffs/cigarette; 2 cigarettes/h; Supplementary Table 2). The e-cig exposure consisted of 13 e-cig sessions per 4 h exposure. Each session (9 min; same duration as 1 cigarette) had 18 puffs (4 s puff, 91 mL puff, 2 puffs/min; Supplementary Figure 1B; Supplementary Table 2) and the protocol was derived, in part, on real-world observations (Evans and Hoffman Citation2014; Robinson et al. Citation2016). Since 3R4F produces a high amount of CO and e-cigs produce low to undetectable levels of CO (Tayyarah and Long Citation2014), the 3R4F mainstream smoke was diluted into 2 exposure chambers (3 LPM per chamber; 5 L chamber volume) while e-cig aerosol was delivered to only 1 exposure chamber (Supplementary Figure 1A). In both designs, total suspended particulate (TSP) matter was monitored real time with an in-line infrared forward scattering monitor (MicroDust Pro; Casella CEL Ltd., Bedford, UK) (Supplementary Figure 1A) and gravimetrically using thimble filters post-exposure chamber (Supplementary Table 2). Particle size mass measurements were made gravimetrically using a seven-stage, Mercer style, low-flow (5 LPM) cascade impactor (Supplementary Figures 1D and E) (Mercer Citation1964).
Aerosol-derived carbonyl collection and quantification
Microreactors and carbonyl mass spectrometry
We used a silicon microreactor coated with 4-(2-aminooxyethyl)-morpholin-4-ium chloride (AMAH) to covalently trap the aerosolized carbonyl compounds via oximation reactions (Supplementary Figure 2)( Li et al. Citation2012; Knipp et al. Citation2015). The AMAH-carbonyl adducts derived from formaldehyde, acetaldehyde, acetone, acrolein, and crotonaldehyde were eluted from the microreactor and then measured by gas chromatography-mass spectrometry (GC-MS) and/or Fourier transform ion cyclotron resonance mass spectrometry (FT-ICR-MS) as described in Supplemental Information.
Quantification of aldehyde-derived metabolites in urine as biomarkers of exposure
Urine collection
On day 1, mice were weighed and briefly exposed to D-glucose/saccharin solution (w/v; 3.0%/0.125%; Sigma) immediately prior to HEPA- and charcoal-filtered air exposure (6 h), and then placed singly per metabolic cage (Harvard Apparatus) with glucose/saccharin solution in drinking water without food to collect urine (in graduated cylinders in 4 °C water-jacketed organ baths) for a continuous 3 h collection post-exposure. After urine collection, mice were placed in home cages overnight with food and water per normal housing arrangements. On day 2, the same mice were exposed to aerosols of KY Reference cigarette mainstream smoke (3R4F cigarettes: 12 cigarettes/6 h) or an e-cig (blu®; Classic Tobacco, CT; Magnificent Menthol, MM; 13–16 mg nicotine; 4 h) and then placed singly per metabolic cage with glucose/saccharin solution to collect urine (without food) in 1 h increments over the 3 h post-exposure followed by an overnight (O/N; with food) urine collection. Urine samples were collected, decanted, and stored at −80 °C (Conklin et al. Citation2017).
Urinary metabolites of nicotine and unsaturated aldehydes
Metabolites of unsaturated aldehydes and tobacco alkaloids in urine were analyzed using a slightly modified UPLC-MS/MS method described previously (Malovichko et al. Citation2017). Briefly, urine (25 µL) was diluted with solvent A (15 mM ammonium acetate, pH 6.8) spiked with IS and then applied on a UPLC-MS/MS instrument (ACQUITY UPLC coupled with a Quattro Premier XE triple quadrupole MS (Waters Inc, MA). Separation was performed on an Acquity UPLC HSS T3 (150 mm ×2.1 mm, 1.8 μm) column with a binary gradient (solvent A and solvent B – acetonitrile) at a flow rate of 0.45 mL/min. For each analyte, three multiple reaction monitoring (MRM) transitions were set up: one for quantification, one for confirmation, and one for the IS. Nicotine, cotinine (COT), and trans-3′-hydroxycotinine (3HC) were analyzed on the mass spectrometer in the positive ionization mode as described above. The metabolites, 3-hydroxypropylmercapturic acid (3HPMA; acrolein) and 3-hydroxy-1-methylpropylmercapturic acid (HPMMA; crotonaldehyde)(Supplementary Figure 3), were analyzed in the negative ionization mode. Analytes were quantified using peak area ratio based on 10 point-standard. Peak integration, calibration, and quantification were performed using TargetLynx software. Values for all the urinary metabolites were normalized to urinary creatinine.
Urinary formate and acetate
Metabolites of formaldehyde (formate) and acetaldehyde (acetate)(Supplementary Figure 3) were measured in the urine by GC-MS as described previously (Kage et al. Citation2004; Lamarre et al. Citation2014) with slight modifications. Briefly, urine (50 µL) was mixed with sodium phosphate (20 µL 0.5 M, pH 8.0) containing internal standards: 13C-formate (2.3 mM) and 13C-acetate (0.23 mM). Samples were incubated with PFBBr (130 µL, 0.1 M) for 15 min at 60 °C, extracted with hexane (330 µL), and analyzed by GC-MS in electron ionization (EI) mode. Six-point calibration curves were used to calculate the concentrations of formate and acetate. Results were corrected for the natural abundance of 13 C isotopes. Values for all the urinary metabolites were normalized to urinary creatinine.
Statistics
Data are expressed as the mean ± SD or SEM (where indicated). Statistical significance was accepted at the p < 0.05 level. Statistical analyses were performed using SAS 9.4 software. Student’s t-test was used for data analyses when the data were restricted to two groups (e.g., CT vs. MM), and Oneway ANOVA with Tukey adjustment when more than 2 groups were compared (e.g., aerosol carbonyl levels; see ). For hypothesis testing of urinary metabolites, the urinary aldehyde and nicotine metabolite excretion were compared between e-cigarette groups only. For acetate, formate, and the total nicotine equivalents (TNE), the sum of the 3 h post-exposure (minus baseline) was calculated, e.g., (∑Nic+Cot+3HC), and used for comparison between e-cigarette groups only. For 3HPMA and HPMMA, the peak level post-exposure (i.e. 0–1 h) minus individual baseline level was compared between e-cigarette treatments. The nicotine metabolite ratio (NMR) was defined as 3HC/COT (Dempsey et al. Citation2004). The mean NMR across post-exposure collections (0–3 h) was calculated and used for statistical comparison between e-cigarette groups only.
Figure 1. Formation of aldehydes as a function of the percentage of propylene glycol (PG) in a mixture with vegetable glycerin (VG). (a) Saturated aldehydes: formaldehyde and acetaldehyde; (b) unsaturated aldehyde acrolein and acetone (ketone for comparison). To generate aerosols from PG:VG, either neat or mix was loaded into a refillable, clear tank (≈0.5 mL) atomizer with a coil resistance of 1.8 Ohm (Mistic Bridge) coupled with a rechargeable bluPLUS+™ (3.7 V) battery (power output 7.6 W; where puff volume = 91 mL, puff duration = 4 s, frequency = 2 puff/min). Values are means ± SD (n = 3). In A, *p < 0.05: 100% VG vs. all % PG; 75, 50, and 25% PG; +p < 0.05: 100% PG vs. 75, 50, and 25% PG. In B, *p < 0.05: 100% VG vs. all % PG; + p < 0.05 100% PG vs. all % VG.
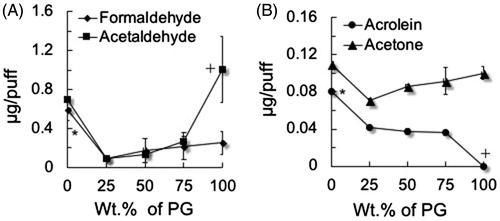
Figure 2. Aldehyde levels generated from Set I e-cigarettes or from PG and VG. To genereate aerosols, Set 1 e-cigarettes (blu battery, 3.7 V, 4.56 W) or a refillable, clear tank (≈0.5 mL) atomizer with a coil resistance of 1.8 Ohm (Mistic Bridge) for carrier solutions (PG, VG; bluPLUS + battery, 7.6 W; where puff volume = 91 mL, puff duration = 4 s, frequency = 2 puff/min). Values are means ± SD (n = 3). CT: Classic Tobacco; MM: Magnificent Menthol; VV: Vivid Vanilla; CC: Cherry Crush; PG: 100% Propylene Glycol; VG: 100% Vegetable Glycerin. *p < 0.05: Formaldehyde: MM = CC > PG; Acetaldehyde: MM = PG = VG > CT; Acetone: CT = MM = VV = CC > PG = VG; Acrolein: CC = MM = VV > CT = PG; CC > VG.
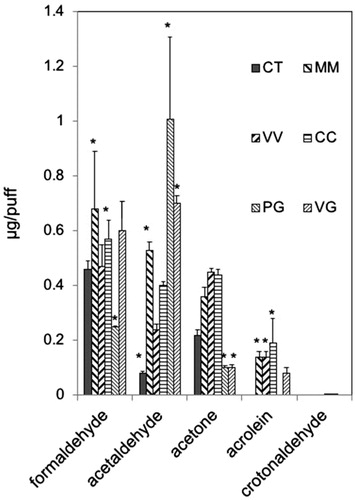
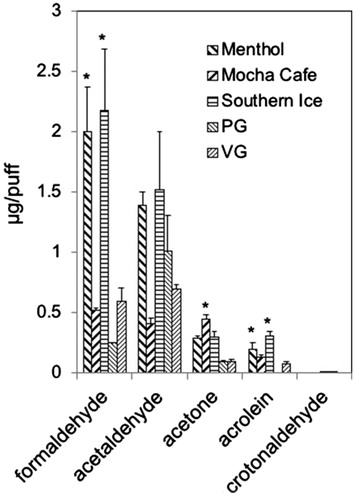
Figure 3. Aldehyde levels generated from Set II e-liquids or from PG and VG. To generate aerosols from e-liquids e-liquids were loaded into a refillable, clear tank (≈0.5 mL) atomizer with a coil resistance of 1.8 Ohm (Mistic Bridge) coupled with a rechargeable bluPLUS+™ (3.7 V) battery (7.6 W; where puff volume = 91 mL, puff duration = 4 s, frequency = 2 puff/min). Values are means ± SD (n = 3).PG: 100% propylene glycol; VG: 100% vegetable glycerin. *p < 0.05: Formaldehyde: Menthol = Southern Ice > Mocha Café=PG = VG; Acetaldehyde: no statistically siginificant differences; Acetone: Mocha Café=Southern Ice ≥ Menthol = PG = VG; Acrolein: Southern Ice > Menthol = Mocha Café=VG > PG.
Results
Carbonyls in aerosols of PG and VG
To understand the contributions of thermal decomposition of PG or VG to carbonyl generation and for comparison with carbonyls generated from commercial e-liquids, we measured carbonyl compounds in aerosols made from neat PG (100%), neat VG (100%), and PG:VG mixtures, e.g., 25:75, 50:50 and 75:25. The amounts of formaldehyde, acetaldehyde, acetone, acrolein, and crotonaldehyde were measured (and compared) as a function of the percentage of PG in the mixtures (; Supplementary Table 3). E-liquid fluid consumption varied from 4.0 to 6.9 mg/puff at a puff volume of 91 mL. Neat PG generated measurable formaldehyde (0.25 ± 12 µg/puff), acetaldehyde (1.01 ± 0.34 µg/puff), acetone (0.11 ± 0.007 µg/puff) and low levels of crotonaldehyde (0.25 ± 0.12 × 10⁻³ µg/puff) yet above the LoD (LoD <0.03 × 10⁻³ µg/puff). The acrolein level was below the limit of detection (LoD <0.03 × 10⁻³ µg/puff). Neat VG (100%), on the other hand, produced measurable levels of formaldehyde (0.59 ± 0.11 µg/puff), acetaldehyde (0.70 ± 0.03 µg/puff), acetone (0.11 ± 0.01 µg/puff), and the highest level of acrolein (0.08 ± 0.002 µg/puff) but not crotonaldehyde (below the LoD) (). Acrolein and crotonaldehyde formation, thus, is dependent significantly on the specific PG:VG proportion.
Carbonyls in aerosols of commercial e-cigs and e-liquids with flavorants
We also measured generation of carbonyl compounds in aerosols generated from commercial e-cigarettes (Set I, blu®) and e-liquids (Set II, Halo®) with flavoring chemicals using a ”typical” e-cigarette puff profile (). Acetaldehyde and formaldehyde levels in aerosols of Classic Tobacco (CT) e-cigarette (blu®) were lower than in aerosols of neat PG and neat VG, while acrolein and crotonaldehyde were below the LoD (; Supplementary Table 4). Formaldehyde levels in aerosols of MM, VV, and CC Set I e-cigarettes (blu®) were in the range generated from neat PG and neat VG (). On the other hand, acetaldehyde levels in aerosols of all 4 Set I e-cigarettes were lower than the levels generated from either neat PG or neat VG (). Acrolein levels in aerosols of 3 Set I e-cigs (MM, VV, CC, but not CT) were higher than that in aerosol from pure VG (). Moreover, the highest levels of both acrolein (1.90 ± 0.20 µg/puff) and crotonaldehyde (0.007 ± 0.006 µg/puff; note: too low to be seen on the graph but above the LoD) were generated from Cherry Crush (CC; ). Acetone (a ketone) was present in aerosols of all Set I e-cigarettes, pure PG, and pure VG ().
Aldehydes also were measured in aerosols generated from Set II e-liquids. Menthol and Southern Ice e-liquids (but not Mocha Café) generated much higher aerosol levels of formaldehyde and acrolein but not of crotonaldehyde than levels from pure PG or pure VG (; Supplementary Table 5). For example, formaldehyde in aerosols from Menthol and Southern Ice e-liquids were 8.1–8.7 times greater than that produced from pure PG and 3.4–3.7 times greater than that of pure VG and produced from any of the Set I e-cigs. The increase in levels of acetaldehyde, formaldehyde, and acrolein (but not crotonaldehyde) in aerosols of Set II e-liquids (Menthol and Southern Ice and to a lesser extent from Mocha Café) in comparison with pure PG and pure VG and Set I e-cigs likely resulted from decomposition of flavoring chemicals. Acetone was measureable in aerosols of all Set II e-liquids ().
Quantification of aldehyde-derived metabolites in urine as biomarkers of exposure
We focused on the measurement of urinary metabolites of four aldehydes present in aerosols of conventional tobacco and e-cigarettes: acetaldehyde, formaldehyde, and two unsaturated aldehydes, acrolein, and crotonaldehyde. Metabolites of three of the four aldehydes were present at relatively high levels basally in murine urine, and the metabolites of acetaldehyde (acetate) and formaldehyde (formate) were increased to their highest levels in urine collected overnight, likely due to food consumption (). Basal urine levels of the main crotonaldehyde metabolite (HPMMA), however, was low (slightly above LoD) making this metabolite potentially a useful biomarker of exposure to tobacco-derived aerosols containing crotonaldehyde. Using a time-sensitive urine collection protocol in mice, the levels of aldehyde-derived metabolites as well as nicotine, COT, and 3HC were quantified. Despite the high levels of acetaldehyde and formaldehyde measured in tobacco product aerosols (), the levels of the primary metabolites, formate, and acetate, respectively, in urine were increased modestly. For example, formate was increased only by 30–50%, while acetate was increased more substantially (over 2×). Within the first 1–3 h post-exposure, however, neither metabolite had a consistent excretion pattern (). Surprisingly, MCS exposure had an even more mixed effect on urinary levels of both formate and acetate (). As mentioned, acetate and formate levels in urine increased more substantially overnight: acetate by 6–10 times and formate more modestly () – both metabolites increased likely due to food consumption.
Table 1. Urinary metabolites (formate, acetate) of saturated aldehydes (formaldehyde, acetaldehyde) as biomarkers of exposure to tobacco products aerosols in mice.
Urinary metabolites of unsaturated aldehydes were increased by tobacco products. For example, 3HPMA levels were significantly increased at 1 h by Magnificanet Menthol blu e-cig and conventional tobacco cigarette but not Classic Tobacco. Magnificent Menthol (MM) significantly increased urinary excretion of 3HPMA (123 ± 22% over baseline) within the first 1 h post-exposure (). Classic Tobacco aerosol did not increase urninary levels of 3HPMA (12 ± 12% more than baseline; see ; ). The decline in urinary 3HPMA levels from the peak were similar tp conventional tobacco and MM e-cigarette exposures (). The urine level of the crotonaldehyde metabolite (HPMMA), however, was only increased by exposure to MCS () and mirrored the quantitative measurements of crotonaldehyde present in tobacco smoke (16.96 ± 5.59 µg per 1 cigarette). Crotonaldehyde was below the level of detection (LoD) in e-cigarette aerosols ( and ). Thus, the primary urine metabolite of crotonaldehyde, HPMMA, was a more selective biomarker of exposure to conventional mainstream cigarette smoke compared with e-cigarette aerosol. The urinary excretion pattern of nicotine and its metabolites were similar in mice exposed to the three tobacco products, yet the level of nicotine and its metabolites (0–3 h post-exposure; total nicotine equivalents, TNE) was higher in the urine of MCS-exposed mice compared with levels in mice exposed to either e-cigarette aerosol (CT or MM; ). The TNE level in MM-exposed mice was significantly greater than the TNE level in CT-exposed mice ().
Figure 4. Time-sensitive urinary excretion of metabolites of two unsaturated aldehydes, acrolein (3HPMA) and crotonaldehyde (HPMMA), from mice exposed to e-cigarette aerosols or reference tobacco cigarette smoke. (a) Classic Tobacco (CT); (b) Magnificent Menthol (MM); (c) KY Reference Cigarette, 3R4F. Values are means ± SE (n = 5 different mice per exposure). *p < 0.05 between 0–1 h level – baseline for CT and MM; conditions of 4 h (e-cigarette) or 6 h (3R4F) exposure are shown in Supplementary Figure 1 and Supplementary Table 2.
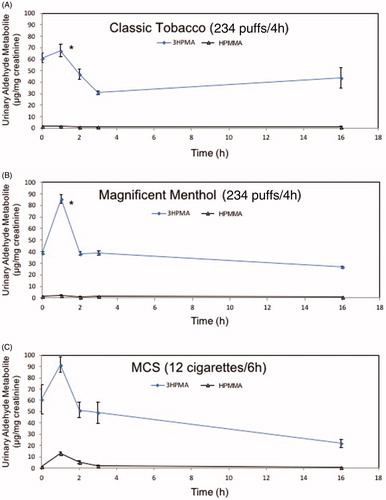
Figure 5. Time-sensitive urinary excretion of nicotine (NIC) and its metabolites, cotinine (COT), and trans-3-hydroxycotinine (3HC), from mice exposed to e-cigarette aerosols or reference tobacco cigarettes. (a) Classic Tobacco (CT); (b) Magnificent Menthol (MM); (c) KY Reference Cigarette, 3R4F, shown as positive control. Values are means ± SE (n = 5 different mice per e-cigarette exposure and n = 3 for MCS exposure). Conditions of 4 h (e-cigarette) or 6 h (3R4F) exposure are shown in Supplementary Figure 1 and Supplementary Table 2.
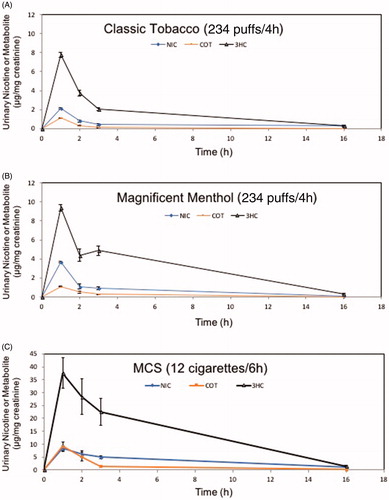
Table 2. Sum of urinary nicotine and nicotine metabolites (cotinine, COT; trans-3′-hydroxycotinine, 3HC; ∑NIC+COT+3HC) and the 3HC/COT ratio (marker of CYP2A6 activity) as time sensitive markers of overall tobacco exposure and metabolism in mice.
Discussion
Biomarkers of ENDS exposure that can distinguish between different tobacco products must first be determined in order to properly assess specific exposures and ultimately to address estimating health risks of e-cigarette use. Therefore, we performed measurements of aldehydes in the e-cigarette-generated aerosols (with variations in PG/VG and flavors) and compared these aerosols with conventional tobacco smoke. Second, we measured the urinary metabolites of four aerosol aldehydes from mice exposed to e-cigarettes or conventional tobacco smoke. Thus, for the first time, we assessed whether four aldehydes formed in e-cigarette aerosols could be linked in a time-sensitive manner with excretion of their primary urinary metabolites. It is increasingly important to provide real-world biomarkers of exposure to e-cigarette aerosols because of the growing use and diversity of e-cigs (e.g., flavoring compounds, device characteristics, use patterns). All of these features can influence nicotine, carbonyl, and volatile organic compound (VOC) formation (Goniewicz et al. Citation2014; Kosmider et al. Citation2014; Jensen et al. Citation2015; El-Hellani et al. Citation2018). For example, Pankow et al. (Citation2017) show that benzoic acid or benzaldehyde (common flavor additives) increase the formation of benzene, a hematological toxin, in e-cigarette aerosol (Pankow et al. Citation2017). Similarly, flavorants in e-cigarette liquids likewise can increase aldehyde formation in aerosols (Khlystov and Samburova Citation2016). Thus, by tracking the urinary excretion of four aldehyde metabolites as well as of nicotine and metabolites, we provide a time-sensitive relationship between aerosol aldehyde content and urinary biomarkers of exposure in C57BL/6J mice.
Aldehydes are present in high concentrations in tobacco product-derived aerosols, including conventional cigarettes (700–800 µg/cigarette mainstream; 50–70 ppm per puff)(Ghilarducci and Tjeerdema Citation1995; Dong and Moldoveanu Citation2004), cigars (Cecil et al. Citation2017), waterpipe (hookah)(Kassem et al. Citation2014), heated cigarette (deBethizy et al. Citation1990; Stanfill et al. Citation2003; Stepanov et al. Citation2008; Shihadeh et al. Citation2012), and in electronic cigarettes (McAuley et al. Citation2012; Goniewicz et al. Citation2014; Kosmider et al. Citation2014; El-Hellani et al. Citation2018; Ogunwale et al. Citation2017). The Institute of Medicine ranks aldehydes as the most significant cardiovascular toxins in tobacco smoke (Institute of Medicine Citation2010). Indeed, a risk analysis suggests that aldehydes account for over 91% of the total non-cancer risk of smoking that includes cardiovascular and pulmonary diseases (i.e., acrolein, 88.5%; acetaldehyde, 2.4%; formaldehyde, 0.4%)(Haussmann Citation2012). This is supported by association between 3HPMA (primary urine acrolein metabolite) and cardiovascular disease risk (DeJarnett et al. Citation2014). Moreover, mice exposed acutely or chronically to acrolein alone have altered cardiovascular biomarkers of harm (Wheat et al. Citation2011; Conklin et al. Citation2017). We used a state-of-the-art carbonyl trapping system that allowed us to quantify individual aldehydes such as acrolein and crotonaldehyde to quite low levels (0.003 ng/puff) that are otherwise missed in studies using dinitrophenylhydrazine (DNPH) cartridges (El-Hellani et al. Citation2018). Although a reduction in exposures to harmful toxicants such as acrolein and carbon monoxide occur with e-cigarette use, exposures to even low levels of unsaturated aldehydes such as acrolein likely carry some health risk (Woodruff et al. Citation2006).
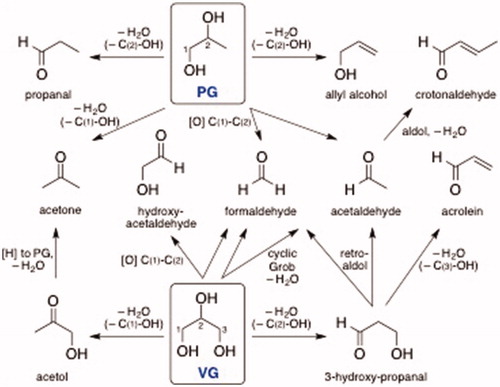
Ostensibly, aldehydes are formed from heating PG, VG, and flavorants in e-cigarette liquids and mechanisms forming these carbonyl compounds have been proposed previously (Laino et al. Citation2011; Sleiman et al. Citation2016). Regardless of the theoretical paths to aldehyde generation, our research shows that PG and VG (as well as added flavorants) in e-liquids can affect the formation of aldehydes in aerosols. Based on their molecular structures (), VG generates higher levels of formaldehyde and acrolein, whereas PG leads to a higher level of acetaldehyde (), and, theoretically, crotonaldehyde may be formed (). Lower levels of carbonyls were generated from mixtures of the carriers, notably 25% PG:75% VG, likely due to multiple factors including mass and heat transfer as well as rate-determining dehydration kinetics associated with the mixture composition (Courtney et al. Citation2012). Since PG has a lower boiling point as well as a higher saturation vapor pressure than VG, PG is easier to atomize (Supplementary Table 1). Of greatest concern is that higher levels of VG in e-liquids led to the greater formation of the toxic, unsaturated aldehyde acrolein ( and ). Since newer generation e-cigs atomizers have sub-ohm coils that increase battery power output, this may lead to greater aldehyde generation, and thus, aldehyde exposures from new generation e-cigarette devices will need to be systematically tested for an overall evaluation of health risk.
Figure 6. Theoretical thermal- and/or heating coil-induced generation of carbonyl compounds from Propylene Glycol (PG) and Vegetable Glycerin (VG) (compare with data in ).
In addition to demonstrating the application of a sensitive “aldehyde capture and quantification” method (oximation reaction in microreactor chip) for e-cig aerosols (Knipp et al. Citation2015; Ogunwale et al. Citation2017), we also detail a time-sensitive methodological approach to assess whole body exposure to four toxic aldehydes (formaldehyde, acetaldehyde, acrolein, crotonaldehyde) as well as to nicotine present in tobacco product aerosols at variable levels. Surprisingly, quantification of the primary metabolites of these four aldehydes in the urine of exposed mice (Supplementary Figure 2), did not necessarily reflect the abundance of the aldehydes in either e-cig aerosol or conventional tobacco smoke. Most notably, the metabolites of formaldehyde and acetaldehyde, formate and acetate, respectively, are increased modestly (or not at all for formate) following tobacco product exposures (). Likely, there are several explanations for these results, but perhaps most important is that the basal urinary levels of formate and acetate are abundant and variable dependent on the metabolic state (e.g., eating food increased formate and acetate – the latter more obviously and by 6–10×; see ) in mice. Similarly, the basal level of 3HPMA (primary acrolein metabolite) is relatively high in C57BL/6 mice (Conklin et al. Citation2009a) but is increased further by exposures to MM e-cigarette and MCS exposure but not by CT e-cigarette in mice ( and ). The increase in 3HPMA induced by MCS or MM e-cigarette is similar to increases observed following a 6 h exposure to 0.5 or 1 ppm acrolein in C57BL/6 mice (Conklin et al. Citation2017). Unlike the other three aldehyde metabolites, the crotonaldehyde metabolite, HPMMA, is basally low/undetectable in murine urine and increases more dramatically with MCS exposure and, unsurprisingly, not at all by either e-cigarette exposure () or smokeless tobacco exposure in mice (Malovichko et al. Citation2017). This makes HPMMA a potentially more selective biomarker of exposure to combustion-dependent tobacco products (and even better than 3HPMA) as observed in NHANES cohorts (Alwis et al. Citation2015; Jain Citation2015). Similarly, switching from cigarettes to e-cigarettes in humans reduces urinary HPMMA level by a greater amount than the reduction in 3HPMA (Goniewicz et al. Citation2017).
There are important caveats in this study to consider. Although our exposure aerosol conditions were highly controlled, it should be recognized that mice are obligate nose breathers and are “involuntary smokers.” This is important because mice respond to some inhaled toxins that are irritants (e.g., acrolein, by rapidly decreasing breathing rate and depth) (Conklin et al. Citation2016) – an irritant receptor-mediated reflex known as the “respiratory braking response,” which obviously decreases but does not eliminate overall exposure to aerosolized toxins (Alarie Citation1973). So, the relationship between the levels of aerosolized aldehydes and aldehyde metabolites in urine is affected by how strongly the “braking response” is/is not stimulated – a reflex dampened/overridden in voluntary smoking. Thus, the uptake of nicotine (and appearance of nicotine metabolites) is modulated by the respiratory braking response. For example, menthol in mainstream cigarette smoke increases nicotine uptake in mice via inhibition of the respiratory braking response (Ha et al. Citation2015). Our data support this possible mechanism because exposure of mice to Magnificent Menthol (MM) led to significantly greater urinary excretion of both total nicotine equivalents (TNE; +41.6 ± 13.5%) and 3HPMA (+624 ± 113%) within the first 3 h or 1 h post-exposure, respectively, when compared with mice exposed to Classic Tobacco e-cigarette ( and , and ; ). However, the increase in excreted 3HPMA in MM-exposed mice also may be greater because MM aerosol contains more acrolein than Classic Tobacco aerosol (). The source of acrolein in MM aerosol could be due to the quantity of VG in the carrier solvent, although we did not measure this. Thus, perhaps, the presence of certain flavorants, e.g., menthol, in e-cigarette aerosols may substantially increase both risks of addiction liability as well as exposure to toxic aldehydes (Benowitz and Samet Citation2011; Khlystov and Samburova Citation2016).
In our murine exposures, we used a first-generation, e-cigarette (i.e., blu®) that has similar carbonyl yields as many e-cigarettes (El-Hellani et al. Citation2018) but it is not necessarily representative of all e-cigarettes. E-cigarettes of 1st generation (aka “Cigalikes”) are less effective at delivering nicotine (roughly 33% as effective), which is clearly supported by our data (; ), despite increasing e-cigarette aerosol exposure intensity (TSP increased 21×; Supplementary Table 2) via increasing e-cigarette puffs [by 2.17×; 234 vs. 108 puffs], volume per puff [by 2.6×; 91 mL vs. 35 mL puff volume], and chamber dilution (factor of 2; Supplementary Figure 1) compared with conventional tobacco cigarettes (3R4F), respectively. Thus, although a first-generation e-cigarette may appear less harmful by having a lower battery power output, for example, it may lead to greater exposures due to altered use topography in those who try to extract more nicotine (Talih et al. Citation2015). It is documented that experienced e-cigarette users adjust their topography in order to derive the nicotine necessary to meet their addiction needs (Ramoa et al. Citation2016). So, far from being irrelevant, first-generation e-cigarettes likely just represents “the tip of the iceberg” because the ever-evolving complexity and functionality of e-cigarettes (e.g., sub-ohm, multiple coil, JUUL) spawn more, not fewer, questions regarding the health risks of using e-cigarettes (Benowitz Citation2014; Bhatnagar et al. Citation2014; Carnevale et al. Citation2016).
Supplemental Material
Download Zip (4.2 MB)Acknowledgments
We thank K. Dixon, A. Hand, T. Krivokhizhina, B. Lynch, K. Moorman, D. Mosley, G. Shirk, and P. Whang for their technical assistance, and M.V.R. Raju for help with AMAH synthesis.
Additional information
Funding
References
- Alarie, Y. 1973. Sensory Irritation by Airborne Chemicals. CRC Crit. Rev. Toxicol. 2 (3):299–363. doi:10.3109/10408447309082020.
- Allen, J. G., S. S. Flanigan, M. LeBlanc, J. Vallarino, P. MacNaughton, J. H. Stewart, and D. C. Christiani. 2016. Flavoring Chemicals in E-cigarettes: Diacetyl, 2,3-Pentanedione, and Acetoin in a Sample of 51 Products, Including Fruit-, Candy-, and Cocktail-Flavored E-cigarettes. Environ. Health Perspect. 124:733–9. doi:10.1289/ehp.1510185.
- Alwis, K. U., B. R. deCastro, J. C. Morrow, and B. C. Blount. 2015. Acrolein Exposure in U.S. Tobacco Smokers and Non-Tobacco Users: Nhanes 2005–2006. Environ. Health Perspect. 123:1302–8. doi:10.1289/ehp.1409251.
- Benowitz, N. L. 2014. Emerging Nicotine Delivery Products. Implications for Public Health. Ann. Amer. Thoracic Soc. 11 (2):231–5. doi:10.1513/AnnalsATS.201312-433PS.
- Benowitz, N. L., and J. M. Samet. 2011. The Threat of Menthol Cigarettes to U.S. Public health. N. Engl. J. Med. 364 (23):2179–81. doi:10.1056/NEJMp1103610.
- Bhatnagar, A., L. P. Whitsel, K. M. Ribisl, C. Bullen, F. Chaloupka, M. R. Piano, R. M. Robertson, T. McAuley, D. Goff, and N. Benowitz. C. o. C. American Heart Association Advocacy Coordinating Committee, C. o. C. C. Stroke Nursing, C. Council on Quality of R. Outcomes. 2014. Electronic Cigarettes: A Policy Statement from the American Heart Association. Circulation. 130 (16):1418–36. doi:10.1161/CIR.0000000000000107.
- Bunnell, R. E., I. T. Agaku, R. A. Arrazola, B. J. Apelberg, R. S. Caraballo, C. G. Corey, B. N. Coleman, S. R. Dube, and B. A. King. 2015. Intentions to Smoke Cigarettes Among Never-Smoking us Middle and High School Electronic Cigarette Users: National Youth Tobacco Survey, 2011–2013. Nicotine Tob. Res. 17 (2):228–35. doi:10.1093/ntr/ntu166.
- Carnevale, R., S. Sciarretta, F. Violi, C. Nocella, L. Loffredo, L. Perri, M. Peruzzi, A. G. Marullo, E. De Falco, I. Chimenti, V. Valenti, et al.. 2016. Acute Impact of Tobacco vs Electronic Cigarette Smoking on Oxidative Stress and Vascular Function. Chest. 150 (3):606–12. doi:10.1016/j.chest.2016.04.012.
- Cecil, T. L., T. M. Brewer, M. Young, and M. R. Holman. 2017. Acrolein Yields in Mainstream Smoke from Commercial Cigarette and Little Cigar Tobacco Products. Nicotine Tob. Res. 19 (7):865–70. doi:10.1093/ntr/ntx003.
- Conklin, D. J., P. Haberzettl, G. Jagatheesan, M. Kong, and G. W. Hoyle. 2016. Role of TRPA1 in Acute Cardiopulmonary Toxicity of Inhaled Acrolein. Toxicol Appl. Pharmacol. 324:61–72. doi:10.1016/j.taap.2016.08.028.
- Conklin, D. J., P. Haberzettl, J. F. Lesgards, R. A. Prough, S. Srivastava, and A. Bhatnagar. 2009a. Increased Sensitivity of Glutathione s-Transferase p-Null Mice to Cyclophosphamide-Induced Urinary Bladder Toxicity. J. Pharmacol. Exp. Ther. 331 (2):456–69. doi:jpet.109.156513 [pii]10.1124/jpet.109.156513.
- Conklin, D. J., P. Haberzettl, R. A. Prough, and A. Bhatnagar. 2009b. Glutathione-s-Transferase p Protects Against Endothelial Dysfunction Induced by Exposure to Tobacco Smoke. Am. J. Physiol. Heart Circ.Physiol. 296 (5):H1586–97. doi:10.1152/ajpheart.00867.2008.
- Conklin, D. J., M. V. Malovichko, I. Zeller, T. P. Das, T. V. Krivokhizhina, B. H. Lynch, P. Lorkiewicz, A. Agarwal, N. Wickramasinghe, P. Haberzettl, et al.. 2017. Biomarkers of Chronic Acrolein Inhalation Exposure in Mice: Implications for Tobacco Product-Induced Toxicity. Toxicol. Sci. 158 (2):263–74. doi:10.1093/toxsci/kfx095.
- Courtney, T. D., V. Nikolakis, G. Mpourmpakis, J. G. Chen, and D. G. Vlachos. 2012. Liquid-Phase Dehydration of Propylene Glycol Using Solid-Acid Catalysts. Appl. Catalysis A: General. 449:59–68. doi: https://doi.org/10.1016/j.apcata.2012.09.034.
- deBethizy, J. D., M. F. Borgerding, D. J. Doolittle, J. H. Robinson, K. T. McManus, C. A. Rahn, R. A. Davis, G. T. Burger, J. R. Hayes, J. H. Reynolds, et al.. 1990. Chemical and Biological Studies of a Cigarette That Heats Rather Than Burns Tobacco. J. Clin. Pharmacol. 30 (8):755–63. doi:10.1002/j.1552-4604.1990.tb03639.x
- DeJarnett, N., D. J. Conklin, D. W. Riggs, J. A. Myers, T. E. O'Toole, I. Hamzeh, S. Wagner, A. Chugh, K. S. Ramos, S. Srivastava, D. Higdon, et al.. 2014. Acrolein Exposure is Associated With Increased Cardiovascular Disease Risk. J. Am. Heart Assoc. 3 (4):e000934. doi:10.1161/JAHA.114.000934.
- Dempsey, D.,. P. Tutka, P. Jacob, III, F. Allen, K. Schoedel, R. F. Tyndale, and N. L. Benowitz. 2004. Nicotine Metabolite Ratio as an Index of Cytochrome p450 2a6 Metabolic Activity. Clin. Pharmacol. Ther. 76 (1):64–72. doi:10.1016/j.clpt.2004.02.011 S000992360400102X [pii].
- Dong, J. Z., and S. C. Moldoveanu. 2004. Gas Chromatography-Mass Spectrometry of Carbonyl Compounds in Cigarette Mainstream Smoke After Derivatization with 2,4-Dinitrophenylhydrazine. J Chromatogr. A. 1027 (1–2):25–35. doi:10.1016/j.chroma.2003.08.104.
- El-Hellani, A., R. Salman, R. El-Hage, S. Talih, N. Malek, R. Baalbaki, N. Karaoghlanian, R. Nakkash, A. Shihadeh, and N. A. Saliba. 2018. Nicotine and Carbonyl Emissions From Popular Electronic Cigarette Products: Correlation to Liquid Composition and Design Characteristics. Nicotine Tob. Res. 20 (2):215–23. doi:10.1093/ntr/ntw280.
- Evans, S. E., and A. C. Hoffman. 2014. Electronic Cigarettes: Abuse Liability, Topography and Subjective Effects. Tob. Control. 23 (Suppl 2):ii23–9. doi:10.1136/tobaccocontrol-2013-051489.
- Farsalinos, K. E., K. A. Kistler, G. Gillman, and V. Voudris. 2015a. Evaluation of Electronic Cigarette Liquids and Aerosol for the Presence of Selected Inhalation Toxins. Nicotine Tob. Res. 17 (2):168–74. doi:10.1093/ntr/ntu176.
- Farsalinos, K. E., K. A. Kistler, G. Gillman, and V. Voudris. 2015b. Why We Consider the Niosh-Proposed Safety Limits for Diacetyl and Acetyl Propionyl Appropriate in the Risk Assessment of Electronic Cigarette Liquid Use: A Response to Hubbs et al. Nicotine Tob. Res. 17 (10):1290–1. doi:10.1093/ntr/ntv005.
- Fuoco, F. C., G. Buonanno, L. Stabile, and P. Vigo. 2014. Influential Parameters on Particle Concentration and Size Distribution in the Mainstream of E-cigarettes. Environ. Pollut. 184 :523–9. doi:10.1016/j.envpol.2013.10.010.
- Ghilarducci, D. P., and R. S. Tjeerdema. 1995. Fate and Effects of Acrolein. Rev. Environ. Contam. Toxicol. 144:95–146.
- Goniewicz, M. L., M. Gawron, D. M. Smith, M. Peng, P. Jacob, 3rd, and N. L. Benowitz. 2017. Exposure to Nicotine and Selected Toxicants in Cigarette Smokers who Switched to Electronic Cigarettes: A Longitudinal Within-Subjects Observational Study. Nicotine Tob. Res. 19 (2):160–7. doi:10.1093/ntr/ntw160.
- Goniewicz, M. L., J. Knysak, M. Gawron, L. Kosmider, A. Sobczak, J. Kurek, A. Prokopowicz, M. Jablonska-Czapla, C. Rosik-Dulewska, C. Havel, et al.. 2014. Levels of Selected Carcinogens and Toxicants in Vapour from Electronic Cigarettes. Tob. Control. 23 (2):133–9. doi:10.1136/tobaccocontrol-2012-050859.
- Gostin, L. O., and A. Y. Glasner. 2014. E-cigarettes, Vaping, and Youth. JAMA 312 (6):595–6. doi:10.1001/jama.2014.7883.
- Ha, M. A., G. J. Smith, J. A. Cichocki, L. Fan, Y. S. Liu, A. I. Caceres, S. E. Jordt, and J. B. Morris. 2015. Menthol Attenuates Respiratory Irritation and Elevates Blood Cotinine in Cigarette Smoke Exposed Mice. PLoS One 10 (2):e0117128. doi:10.1371/journal.pone.0117128.
- Haussmann, H. J. 2012. Use of Hazard Indices for a Theoretical Evaluation of Cigarette Smoke Composition. Chem. Res. Toxicol. 25 (4):794–810. doi: 10.1021/tx200536w.
- Institute of Medicine 2010. Secondhand Smoke Exposure and Cardiovascular Effects. Washington, D.C.: The National Academies. doi:10.17226/12649.
- Jain, R. B. 2015. Distributions of Selected Urinary Metabolites of Volatile Organic Compounds by Age, Gender, Race/Ethnicity, and Smoking Status in a Representative Sample of U.S. Adults. Environ. Toxicol. Pharmacol. 40 (2):471–9. doi:10.1016/j.etap.2015.07.018.
- Jamal, A., A. Gentzke, S. S. Hu, K. A. Cullen, B. J. Apelberg, D. M. Homa, and B. A. King. 2017. Tobacco Use Among Middle and High School Students – United States, 2011–2016. MMWR Morb. Mortal Wkly. Rep. 66 (23):597–603. doi:10.15585/mmwr.mm6623a1.
- Jensen, R. P., W. Luo, J. F. Pankow, R. M. Strongin, and D. H. Peyton. 2015. Hidden Formaldehyde in E-Cigarette Aerosols. N. Engl. J. Med. 372 (4):392–4. doi:10.1056/NEJMc1413069.
- Kage, S., K. Kudo, H. Ikeda, and N. Ikeda. 2004. Simultaneous Determination of Formate and Acetate in Whole Blood and Urine From Humans Using Gas Chromatography-Mass Spectrometry. J. Chromatogr. B Analyt. Technol. Biomed. Life Sci. 805 (1):113–7. doi:10.1016/j.jchromb.2004.02.029.
- Kassem, N. O., R. M. Daffa, S. Liles, S. R. Jackson, N. O. Kassem, M. A. Younis, S. Mehta, M. Chen, P. Jacob, 3rd, S. G. Carmella, et al.. 2014. Children's Exposure to Secondhand and Thirdhand Smoke Carcinogens and Toxicants in Homes of Hookah Smokers. Nicotine Tob. Res. 16 (7):961–75. doi:10.1093/ntr/ntu016.
- Khlystov, A., and V. Samburova. 2016. Flavoring Compounds Dominate Toxic Aldehyde Production During E-Cigarette Vaping. Environ. Sci. Technol. 50 (23):13080–5. doi:10.1021/acs.est.6b05145.
- King, B. A., R. Patel, K. H. Nguyen, and S. R. Dube. 2015. Trends in Awareness and Use of Electronic Cigarettes Among US Adults, 2010–2013. Nicotine Tob. Res. 17 (2):219–27. doi:10.1093/ntr/ntu191.
- Knipp, R. J., M. X. Li, X. A. Fu, and M. H. Nantz. 2015. A Versatile Probe for Chemoselective Capture and Analysis of Carbonyl Compounds in Exhaled Breath. Anal. Methods. 7 (14):6027–33. doi:10.1039/c5ay01576f.
- Kosmider, L., A. Sobczak, M. Fik, J. Knysak, M. Zaciera, J. Kurek, and M. L. Goniewicz. 2014. Carbonyl Compounds in Electronic Cigarette Vapors-Effects of Nicotine Solvent and Battery Output Voltage. Nicotine Tob. Res. 16 (10):1319–26. doi:10.1093/ntr/ntu078.
- Laino, T., C. Tuma, A. Curioni, E. Jochnowitz, and S. Stolz. 2011. A Revisited Picture of the Mechanism of Glycerol Dehydration. J. Phys. Chem. A. 115 (15):3592–5. doi:10.1021/jp201078e.
- Lamarre, S. G., L. MacMillan, G. P. Morrow, E. Randell, T. Pongnopparat, M. E. Brosnan, and J. T. Brosnan. 2014. An Isotope-Dilution, GC-MS Assay for Formate and its Application to Human and Animal Metabolism. Amino Acids. 46 (8):1885–91. doi:10.1007/s00726-014-1738-7.
- Li, M., S. Biswas, M. H. Nantz, R. M. Higashi, and X. A. Fu. 2012. Preconcentration and Analysis of Trace Volatile Carbonyl Compounds. Anal Chem. 84 (3):1288–93. doi:10.1021/ac2021757.
- Malovichko, M. V., I. Zeller, T. V. Krivokhizhina, Z. Xie, P. Lorkiewicz, A. Agarwal, N. Wickramasinghe, S. D. Sithu, J. Shah, T. O’Toole, et al. 2017. Systemic Toxicity of Smokeless Tobacco Products in Mice. Nicotine Tob. Res. ntx230–ntx230. 1–10. doi:10.1093/ntr/ntx230.
- McAuley, T. R., P. K. Hopke, J. Zhao, and S. Babaian. 2012. Comparison of the Effects of e-Cigarette Vapor and Cigarette Smoke on Indoor Air Quality. Inhal. Toxicol. 24 (12):850–7. doi:10.3109/08958378.2012.724728.
- Mercer, T. T. 1964. The Stage Constants of Cascade Impactors. Ann. Occup. Hyg. 7:115–24. doi:10.1093/annhyg/7.2.115.
- National Academy of Sciences. 2018. Public Health Consequences of e-Cigarettes. In Public Health Consequences of e-Cigarettes, ed. D. L. Eaton, L. Y. Kwan, K. Stratton. Washington (DC): The National Academies Press. doi:10.17226/24952.
- Nitzkin, J. L., K. Farsalinos, and M. Siegel. 2015. More on Hidden Formaldehyde in e-Cigarette Aerosols. N. Engl. J. Med. 372 (16):1575. doi:10.1056/NEJMc1502242#SA1.
- Ogunwale, M. A., M. Li, M. V. Ramakrishnam Raju, Y. Chen, M. H. Nantz, D. J. Conklin, and X. A. Fu. 2017. Aldehyde Detection in Electronic Cigarette Aerosols. ACS Omega 2 (3):1207–14. doi:10.1021/acsomega.6b00489.
- Pankow, J. F., K. Kim, K. J. McWhirter, W. Luo, J. O. Escobedo, R. M. Strongin, A. K. Duell, and D. H. Peyton. 2017. Benzene Formation in Electronic Cigarettes. PLoS One 12 (3):e0173055. doi:10.1371/journal.pone.0173055.
- Ramoa, C. P., M. M. Hiler, T. R. Spindle, A. A. Lopez, N. Karaoghlanian, T. Lipato, A. B. Breland, A. Shihadeh, and T. Eissenberg. 2016. Electronic Cigarette Nicotine Delivery can Exceed That of Combustible Cigarettes: A Preliminary Report. Tob. Control. 25 (e1):e6–e9. doi:10.1136/tobaccocontrol-2015-052447.
- Robinson, R. J., E. C. Hensel, K. A. Roundtree, A. G. Difrancesco, J. M. Nonnemaker, and Y. O. Lee. 2016. Week Long Topography Study of Young Adults Using Electronic Cigarettes in Their Natural Environment. PLoS One 11 (10):e0164038. doi:10.1371/journal.pone.0164038.
- Schick, S. F., Blount, B. C., Jacob, P. R. J., Saliba, N. A., Bernert, J. T., A. El Hellani, P. Jatlow, R. S. Pappas, L. Wang, and J. Foulds A. et al. 2017. Biomarkers of exposure to new and emerging tobacco delivery products. Am. J. Physiol. Lung Cell Mol. Physiol. 313:L425–L452. doi:10.1152/ajplung.00343.2016.
- Shihadeh, A., R. Salman, E. Jaroudi, N. Saliba, E. Sepetdjian, M. D. Blank, C. O. Cobb, and T. Eissenberg. 2012. Does Switching to a Tobacco-Free Waterpipe Product Reduce Toxicant Intake? A Crossover Study Comparing Co, No, Pah, Volatile Aldehydes, “Tar” and Nicotine Yields. Food Chem. Toxicol. 50 (5):1494–8. doi:10.1016/j.fct.2012.02.041.
- Shihadeh, A., S. Talih, and T. Eissenberg. 2015. Commentary on Farsalinos et al. (2015): E-Cigarettes Generate High Levels of Aldehydes Only in ‘Dry Puff' Conditions. Addiction 110 (11):1861–2. doi:10.1111/add.13066.
- Siegel, M. B., K. L. Tanwar, and K. S. Wood. 2011. Electronic Cigarettes as a Smoking-Cessation Tool: Results From An Online Survey. Amer. J. Prev. Med. 40 (4):472–5. doi:10.1016/j.amepre.2010.12.006.
- Sleiman, M., J. M. Logue, V. N. Montesinos, M. L. Russell, M. I. Litter, L. A. Gundel, and H. Destaillats. 2016. Emissions From Electronic Cigarettes: Key Parameters Affecting the Release of Harmful Chemicals. Environ. Sci. Technol. 50 (17):9644–51. doi:10.1021/acs.est.6b01741.
- Stanfill, S. B., A. M. Calafat, C. R. Brown, G. M. Polzin, J. M. Chiang, C. H. Watson, and D. L. Ashley. 2003. Concentrations of Nine Alkenylbenzenes, Coumarin, Piperonal and Pulegone in Indian Bidi Cigarette Tobacco. Food Chem. Toxicol. 41 (2):303–17. doi:10.1016/S0278-6915(02)00230-2.
- Stepanov, I., J. Jensen, D. Hatsukami, and S. S. Hecht. 2008. New and Traditional Smokeless Tobacco: Comparison of Toxicant and Carcinogen Levels. Nicotine Tob. Res. 10 (12):1773–82. doi: 905762293 [pii] 10.1080/14622200802443544.
- Talih, S., Z. Balhas, T. Eissenberg, R. Salman, N. Karaoghlanian, A. El Hellani, R. Baalbaki, N. Saliba, and A. Shihadeh. 2015. Effects of User Puff Topography, Device Voltage, and Liquid Nicotine Concentration on Electronic Cigarette Nicotine Yield: Measurements and Model Predictions. Nicotine Tob. Res. 17 (2):150–7. doi:10.1093/ntr/ntu174.
- Tayyarah, R., and G. A. Long. 2014. Comparison of Select Analytes in Aerosol from E-Cigarettes with Smoke from Conventional Cigarettes and with Ambient Air. Regul. Toxicol. Pharmacol. 70 (3):704–10. doi:10.1016/j.yrtph.2014.10.010.
- Wheat, L. A., P. Haberzettl, J. Hellmann, S. P. Baba, M. Bertke, J. Lee, J. McCracken, T. E. O'Toole, A. Bhatnagar, and D. J. Conklin. 2011. Acrolein Inhalation Prevents Vascular Endothelial Growth Factor-Induced Mobilization of flk-1+/sca-1+ cells in Mice. Arterioscler. Thromb. Vasc. Biol. 31 (7):1598–606. doi: ATVBAHA.111.227124 [pii] 10.1161/ATVBAHA.111.227124.
- Woodruff, T. J., E. M. Wells, E. W. Holt, D. E. Burgin, and D. A. Axelrad. 2006. Estimating Risk from Ambient Concentrations of Acrolein Across the United States. Environ. Health Perspect. 115 (3):410–5. doi:10.1289/ehp.9467.