
 ?Mathematical formulae have been encoded as MathML and are displayed in this HTML version using MathJax in order to improve their display. Uncheck the box to turn MathJax off. This feature requires Javascript. Click on a formula to zoom.
Abstract
An electronic cigarette (e-cig) generates aerosols by vaporizing the e-liquid, which mainly consists of propylene glycol (PG), vegetable glycerin (VG), and nicotine. Understanding the effects of e-liquid main compositions on e-cig aerosols is important for exposure assessment. This study investigated how the PG/VG ratio and nicotine content affect e-cig aerosol emissions and dynamics. A tank-based e-cig device with 10 different flavorless e-liquid mixtures (e.g., PG/VG ratios of 0/100, 10/90, 30/70, 50/50, and 100/0 with 0.0% or 2.4% nicotine) was used to puff aerosols into a 0.46 m3 stainless steel chamber for 0.5 h. Real-time measurements of particle number concentration (PNC), fine particulate matter (PM2.5), and particle size distributions were conducted continuously throughout the puffing and the following 2-h decay period. During the decay period, particle loss rates were determined by a first-order log-linear regression and used to calculate the emission factor. The addition of nicotine in the e-liquid significantly decreased the particle number emission factor by 33%. The PM2.5 emission factor significantly decreased with greater PG content in the e-liquid. For nicotine-free e-liquids, increasing the PG/VG ratio resulted in increased particle loss rates measured by PNC and PM2.5. This pattern was not observed with nicotine in the e-liquids. The particle loss rates, however, were significantly different with and without nicotine especially when the PG/VG ratios were greater than 30/70. Compared with nonvolatile di-ethyl-hexyl subacute (DEHS) aerosols, e-cig particle concentration decayed faster inside the chamber, presumably due to evaporation. These results have potential implications for assessing human exposure to e-cig aerosols.
Copyright © 2020 American Association for Aerosol Research
EDITOR:
1. Introduction
A cluster of respiratory syndromes has been recently identified among patients after using electronic cigarettes (e-cigs) (Layden et al. Citation2020). With the rapid growth of e-cig users worldwide (Breland et al. Citation2017; Cullen et al. Citation2018; Yoong et al. Citation2018), exposure to e-cig aerosols has become an important public health concern. The global e-cig market is anticipated to reach $48.9 billion by 2025, with the largest revenue in the United States (Adroit Market Research Citation2018). E-cigs have become a popular alternative to tobacco cigarettes, but the efficacy of e-cigs as smoking cessation aids remains inconclusive (Hartmann-Boyce, Begh, and Aveyard Citation2018; Malas et al. Citation2016). A number of recent studies (Chun et al. Citation2017; Polosa and Caponnetto Citation2016) have reported the potential toxicity of e-cig aerosols even though they typically contain lower levels of toxic chemicals than tobacco smoke (Li et al. Citation2020).
Similar to tobacco smoke, high levels of particle number concentration (PNC) and fine particulate matter (PM2.5) have been observed in e-cig emissions (Fuoco et al. Citation2014; Ingebrethsen, Cole, and Alderman Citation2012; Nguyen et al. Citation2019; Williams et al. Citation2013; Zhao et al. Citation2016; Zhao et al. Citation2017). Unlike tobacco cigarettes, which produce smoke by combustion of tobacco leaves, e-cigs generate aerosols via vaporization of the e-liquid, which is made of propylene glycol (PG), vegetable glycerin (VG), nicotine, water, and flavoring compounds (Etter, Zather, and Svensson Citation2013; Geiss et al. Citation2015; Kim and Shin Citation2013). Previous studies have investigated the relationship between the e-liquid composition (i.e., PG/VG ratio and nicotine) and e-cig particle emissions. A few studies have found that the total mass of PM in e-cig aerosols is elevated with the increasing volume ratios of PG/VG with nicotine in the e-liquid (Baassiri et al. Citation2017; El-Hellani et al. Citation2018; Talih et al. Citation2017). In addition to PG/VG ratio, several studies have found that adding nicotine to e-liquids produces more particles (Fuoco et al. Citation2014; Manigrasso et al. Citation2015; Scungio, Stabile, and Buonanno Citation2018). Conversely, Schober et al. (Citation2014) reported that higher PNC and PM2.5 were observed for nicotine-free e-liquids. Moreover, Zervas et al. (Citation2018) did not detect a significant difference in PNC with and without nicotine in the e-liquid. These inconsistent results in the literature call for a systematic study on the effects of e-liquid main compositions on e-cig aerosols.
E-cig aerosols are highly dynamic since they contain a significant amount of volatile or semi-volatile materials (Ingebrethsen, Cole, and Alderman Citation2012; Vo and Morris Citation2014). In indoor environments, e-cig particle concentrations decay rapidly over a short distance (>1.5 m) from the source and largely disappear within a few seconds (Martuzevicius et al. Citation2019; Zhao et al. Citation2017). This is likely attributable to both indoor air exchange rate (AER) and particle dynamics which include particle evaporation, surface deposition, coagulation, and gravitational settling (Floyd et al. Citation2018; Goniewicz and Lee Citation2015; Ingebrethsen, Cole, and Alderman Citation2012; Meng et al. Citation2017; Mikheev et al. Citation2016; Nguyen et al. Citation2019; Zhao et al. Citation2016). These particle dynamic processes not only change e-cig aerosol concentrations but also affect the particle size distribution which determines the extent and location of particle deposition in the respiratory tract (Hinds Citation1999), and thus need to be better understood.
E-cig particles are primarily in the submicron size range (Fuoco et al. Citation2014; Ingebrethsen, Cole, and Alderman Citation2012), exhibiting considerable differences in terms of size distribution ranging from a single mode to a tri-modal distribution reported by different studies (see Table S1 in the online supplementary information [SI]). Previous studies have also reported that the e-cig particle size distributions varied depending on e-cig puffing parameters (i.e., puffing flow rate, particle residence time, and the amounts of puffs) and environmental factors (i.e., temperature, relative humidity, and dilution factor) (Feng, Kleinstreuer, and Rostami Citation2015; Floyd et al. Citation2018; Fuoco et al. Citation2014; Manigrasso et al. Citation2015; McAuley et al. Citation2012; Meng et al. Citation2017; Mikheev et al. Citation2016; Mikheev et al. Citation2018; Nguyen et al. Citation2019; Schripp et al. Citation2013; Scungio, Stabile, and Buonanno Citation2018; Sosnowski and Odziomek Citation2018; Wright et al. Citation2016; Zervas et al. Citation2018; Zhang, Sumner, and Chen Citation2013; Zhao et al. Citation2016; Zhao et al. Citation2017). However, limited studies have focused on the effects of e-liquid compositions on e-cig particle size distribution, which is important for assessing exposure and related health effects. To fill these knowledge gaps, this study aims to investigate how PG/VG ratio and nicotine in the e-liquid affect the emissions and dynamics of e-cig aerosols under well-controlled experimental conditions.
2. Materials and methods
2.1. Experimental setup
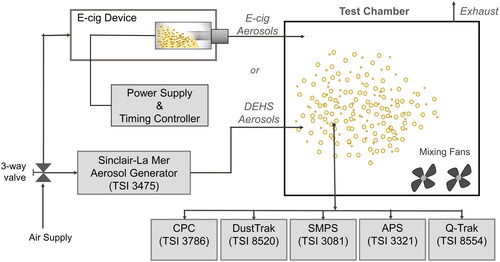
A 0.46 m3 stainless steel test chamber equipped with sampling instruments was used in this study (). A well-mixed condition was achieved with two mixing fans inside the chamber. With the total air flow rate of sampling instruments at 0.47 m3/h, the AER was maintained at a constant level of 1.0 h−1. This AER was verified with measurements of CO2 concentration decay inside the chamber. The interior of the chamber was made of stainless steel to achieve a minimal loss of the emitted aerosols due to surface adsorption. This chamber has been well characterized through our previous studies (Fung, Shu, and Zhu Citation2014; Liu et al. Citation2014; Shi et al. Citation2016). The test chamber was supplied with aerosols generated by the e-cig device. The chamber exhaust connected with a high efficiency particulate air (HEPA) filter was led into the laboratory exhaust system. During the experimental period, temperature and relative humidity inside the chamber were maintained at 24.0 ± 0.5 °C and 35% ± 15%, respectively.
Figure 1. A schematic diagram of the aerosol generation and sampling system.
2.2. Aerosol generation
E-cig aerosols were generated by using an e-cig device, Vapor-fi model Volt Hybrid Tank, which was equipped with a refillable tank, high capacity batteries, and adjustable power settings. This type of e-cig device was selected because it is popular among experienced e-cig users (Baweja et al. Citation2016; Yingst et al. Citation2015). The e-cig device with a heating coil of 0.5 Ω thermal resistance was powered at 18.75 W, which is within the manufacturer’s recommended range. However, in real world, depending on e-liquid flavors and e-cig devices, the wattages used by e-cig users vary greatly and their effects on e-cig aerosols warrant future study. To better control the e-liquid composition, homemade e-liquids were used to avoid unknown compounds in the commercial e-liquids (Flora et al. Citation2016). The e-liquids were prepared from individual chemical compounds of PG (C3H8O2, ≥ 99.5%), VG (C3H8O3, ≥ 99.5%), and nicotine (C10H14N2, ≥ 99%) (see Table S2 in the SI for chemical properties). In total, 10 e-liquids were tested at five different PG/VG volume ratios (i.e., 0/100, 10/90, 30/70, 50/50, and 100/0) with either 0.0% or 2.4% nicotine.
A homemade puffing machine composed of a compressed air source and an Arduino Uno R3 microcontroller board (Arduino, Italy), which served as a programable timer, was used to power the e-cig device. The inlet air was filtered by a HEPA filter and was continuously pushed through the e-cig tank at an airflow rate of 1 L/min. For each e-liquid mixture, the e-cig device was puffed for 0.5 h to achieve a steady-state condition followed by a 2-h decay. During the puffing session, the e-cig device was controlled to repeat a continuous puffing cycle (i.e., 4 s/puff, every 30 s) to mimic a typical puff topography of e-cig users (Behar, Hua, and Talbot Citation2015; Farsalinos et al. Citation2013; Hua, Yip, and Talbot Citation2013; Robinson et al. Citation2015). For a given puff duration and puff flow rate, the corresponding dilution ratio was derived by dividing the chamber volume by the puff volume (i.e., puff duration × puff flow rate). The dilution ratio for the chamber was 6900:1.
Di-ethyl-hexyl separate (DEHS) with an extremely low saturation vapor pressure (1.2 × 10⁻⁶ Pa) was used as the nonvolatile baseline to compare with the e-cig aerosols. DEHS aerosols were produced by the Sinclair–La Mer aerosol generator (model 3475, TSI, Inc., Shoreview, MN). The generator was adjusted to produce DEHS aerosol resembling e-cig aerosols in terms of particle concentration and size distribution. The DEHS aerosol was also monitored for the 2-h decay period inside the same chamber (see Figure S1 in the SI for details).
2.3. Measurements
For each experimental session, during the 0.5-h puffing and the 2-h decay, PNC and PM2.5 were continuously measured inside the chamber using a set of real-time instruments. A condensation particle counter (CPC 3786, TSI Inc.) was used to monitor PNC. PM2.5 mass concentrations were measured with DustTrak Aerosol Monitors (DustTrak 8520, TSI Inc.). An indoor air quality monitor (Q-Trak 8554 TSI Inc.) was also used to collect temperature and relative humidity data inside the chamber. All instruments were calibrated prior to the study, and the DustTrak was zero calibrated before each experiment. The data logging interval was set to 2 min for the CPC, DustTrak, and Q-Trak. These real-time instruments provided high time-resolution measurements for PNC and PM2.5. A scanning mobility particle sizer (SMPS 3080, TSI Inc.; 100 s up scan, 20 s down scan) and an Aerodynamic Particle Sizer (APS 3321, TSI Inc.) were used to measure particle size distribution. The particle size range measured by SMPS and APS were 7–289 nm and 0.5–19.8 µm, respectively. The real-time measurements were repeated six times for the DEHS aerosol as well as e-cig aerosols generated from each of the ten e-liquid mixtures.
To ensure data quality, before each experiment, PNC and PM2.5 in the chamber were maintained at a background level of less than 1000 particles/cm3 and 2 µg/m3, respectively. In addition, to examine the potential effects of off-gassing, the test chamber was monitored for (1) a 2-h period before puffing session (i.e., background level), (2) a 26-h post-puffing period after a 30-min puffing session, and (3) a 2-h period after cleaning the chamber walls and tubings (see Figure S2 in the SI).
A notable upward PM2.5 bias of DustTrak when sampling ambient air has been observed in previous studies (Jenkins et al. Citation2004; Zhang and Zhu Citation2010). From our previous e-cig study, a calibration factor of 0.27 was obtained through gravimetric calibration of DustTrak PM2.5 measurements in chamber-puffed e-cig aerosols. This calibration factor was applied to correct all PM2.5 data in this study (Nguyen et al. Citation2019; Zhao et al. Citation2017).
2.4. Data analysis
Assuming a well-mixed chamber, EquationEquation (1)(1)
(1) can be used to calculate particle concentrations by considering factors such as particle levels inside and outside of the chamber, AER, and particle loss rate (Dockery and Spengler Citation1981; He et al. Citation2004):
(1)
(1)
where
and
are the particle concentrations inside and outside the chamber, respectively,
is the penetration efficiency,
is the AER,
is the particle loss rate due to evaporation, surface deposition, coagulation, and gravitational settling,
is the particle emission rate in number or mass per hour,
is the time, and
is the volume of the chamber.
After 60 puffs were generated over 0.5 h, the particle concentration approached an equilibrium value under a steady-state condition with =0. This equilibrium value was defined as the initial concentration
representing the beginning of the decay. Since the room air outside of the chamber was filtered by HEPA filters,
= 0. Thus, the e-cig emission rate (
) in this study is a function of the initial concentration before decay started (
), chamber volume (
), and total removal rate
and was calculated using EquationEquation (2)
(2)
(2) :
(2)
(2)
A total of 60 puffs were generated during the 0.5 h emission period, and the puff number normalized emission factor () in number or mass per puff was calculated using EquationEquation (3)
(3)
(3) :
(3)
(3)
Previous studies have used a regression of the first-order decay to determine the particle loss rates (Gong, Xu, and Zhu Citation2009; Schripp et al. Citation2008). The first-order log-linear regression is described as follows:
(4)
(4)
where
is the elapsed time,
and
are particle concentrations in the chamber measured at times t and t = 0, respectively, during the decay. The particle loss rate (
), was calculated by fitting a line to the plot of the log of
versus times and subtracting the AER (
) from the total removal rate
This method was employed in this study. For both e-cig and DEHS aerosols, we estimated the particle loss rate [h−1] based on PNC and PM2.5 collected during the decay periods mentioned above.
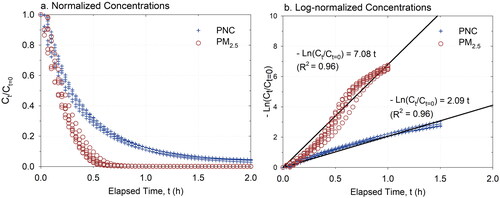
As an example, presents normalized concentration decay data collected with an e-liquid mixture made of 30% PG, 70% VG, and 0.0% nicotine. The total removal rates
were determined by fitting a log-linear regression to normalized concentration data shown in . For each e-liquid mixture, the total removal rate
was determined from six repeated measurements. For each e-liquid mixture evaluated in this study, the six repeated measurements had high coefficients of determination (R2) greater than 0.93 for PNC and greater than 0.90 for PM2.5, respectively. Similarly, DEHS data also had high R2 values of 0.98 and 0.99 for PNC and PM2.5, respectively. Table S3 in the SI summarizes the details of the log-linear regression results.
Figure 2. Decay curves for PNC and PM2.5 shown in (a) normalized concentration, Ct/Ct=0, and (b) log-normalized concentration, ln (Ct/Ct=0). The plotted data were collected with the e-liquid mixture having a PG/VG ratio of 30/70 without nicotine.
Both simple and multiple linear regression analyses were used to study the effect of PG/VG ratio and nicotine level on the e-cig emission factor, t50, and particle loss rate in terms of PNC and PM2.5. The comparison between the e-liquids with and without nicotine for each PG/VG ratio was performed by using Student’s t-test. All statistical analyses were conducted using SAS version 9.4. All figures were generated with Sigmaplot 12.5 (Systat Software Inc., San Jose, CA). While there is a size range gap between SMPS and APS output (289 nm- 540 nm), the plotting software automatically fits the data gap by linear interpolation. The level of statistical significance was set as p < 0.05.
3. Results and discussion
3.1. Particle emission
For all tested e-liquid mixtures, the e-cig was a strong source of particles with the mean (standard deviation) number and mass emission factors of 2.5 × 10⁷ (7 × 10⁶) particles/puff and 113 (42) µg/puff, respectively (). The multiple linear regression results indicated that the addition of 2.4% nicotine in the e-liquid significantly decreased the particle emission factor from 3.0 × 10⁷(6.6 × 10⁶) particles/puff to 2.0 × 10⁷(2.0 × 10⁶) particles/puff (p < 0.001). The decreases in particle emission from nicotine-containing e-liquid were also reported by Zervas et al. (Citation2018) and Schober et al. (Citation2014). However, no significant difference in PM2.5 emission was detected with and without nicotine in the e-liquid mixture.
Table 1. The mean (standard deviation) of emission factor (Sp), initial concentrations (Ct=0), and the time (t50) taken to achieve 50% of Ct=0 for each e-liquid mixture and DEHS aerosols evaluated in the study.
Interestingly, we found that the PG/VG ratio was negatively associated with the PM2.5 emission factor (p < 0.001). However, two previous studies reported the opposite results in that the total mass of e-cig-emitted particles increased with greater PG/VG ratios using filter-based methods (Baassiri et al. Citation2017; El-Hellani et al. Citation2018). This discrepancy may be attributable to the different dilution conditions between the current study with a dilution factor of 6900 and the previous two studies with a minimal dilution factor of 1.75 (Baassiri et al. Citation2017; El-Hellani et al. Citation2018). PG aerosols with higher saturation vapor pressure (i.e., 20 pa) are more volatile than VG (i.e., 0.01 pa). Thus, the higher dilution in the current study is likely resulting in more evaporation with high levels of PG in the e-liquid compared to the low-dilution conditions.
3.2. Decay of PNC and PM2.5
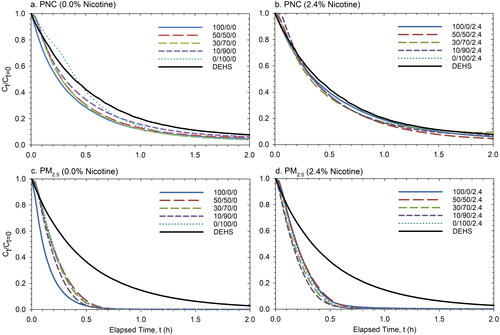
Using the initial concentration () shown in , we normalized PNC and PM2.5
averaged over the six repeated measurements, and plotted the data as a function of time for each e-liquid mixture during the 2-h decay (). For both PNC and PM2.5, the decay was faster for e-cig aerosols than for the DEHS aerosols inside the chamber. More noticeable differences between DEHS and e-cig aerosols were observed for PM2.5 compared with PNC. For nicotine-free e-liquid, a faster decay of e-cig particle concentration was observed at an increasing PG/VG ratio ( and ). For both PNC and PM2.5, the fastest decay was observed when the PG/VG ratio was 100/0. Interestingly, once nicotine was added to the e-liquids, the decay curves became closer to each other without a clear difference ( and ).
Figure 3. Averaged normalized concentration (Ct/Ct=0) decay curves for PNC (a and b) and PM2.5 (c and d). The plotted data provide the means of six repeated measurements without nicotine (0.0%; a and c) and with nicotine (2.4%; b and d) in comparison to DEHS aerosols.
During the 2-h decay, the t50, which is the time needed to achieve 50% of the initial PNC and PM2.5 for each e-liquid mixture, is also presented in . For e-cig aerosols, the t50 was within a range of 15–24 min for PNC and 6–12 min for PM2.5. In comparison, for DEHS aerosols, the t50 was 24 and 20 min for PNC and PM2.5, respectively. There is a significant difference in t50 between e-liquids with and without nicotine for PNC (p < 0.001), where the difference increased noticeably when PG/VG ratios increased. For PM2.5, however, we observed a significant difference only when the PG/VG ratio reached 100/0 (p < 0.01). For the nicotine-free e-liquid, t50 was found to decrease with increasing PG/VG ratios (p = 0.005 for PNC; p = 0.002 for PM2.5). In contrast, the t50 for e-liquid with nicotine showed a slightly rising pattern with increasing PG (p = 0.003 for PNC; p < 0.05 for PM2.5).
3.3. Particle loss rate
To further illustrate the effect of nicotine and PG/VG ratios on the dynamic of e-cig aerosols, we determined the particle loss rate under each experimental condition and compared those to the DEHS aerosol (). Since the evaporation of DEHS aerosols is negligible relative to that of e-cig aerosols, we used the particle loss rate of DEHS aerosols as a nonvolatile baseline. The error bars are one standard deviation, σ, of the six repeated measurements, which show larger variability in the estimated particle loss rates for PM2.5 (i.e., σ = 0.26–1.76) compared to PNC (i.e., σ = 0.04–0.24).
Figure 4. Particle loss rates as measured by (a) PNC and (b) PM2.5 at different PG/VG ratios with 0.0% and 2.4% nicotine compared with DEHS. Statistically significant differences are noted with *(p < 0.001, Student’s t-test).
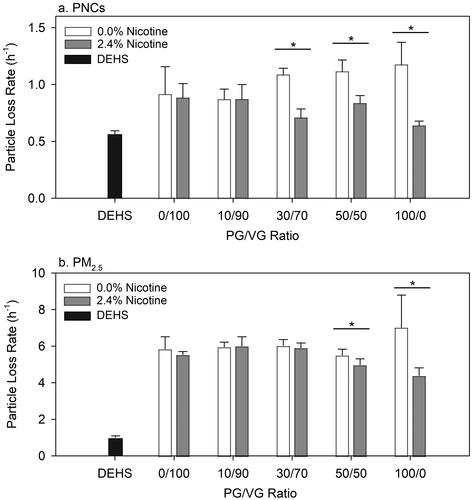
Overall, the particle loss rates measured by PM2.5 (i.e., 4.4–7.0 h−1) were substantially greater than those measured by PNC (i.e., 0.6–1.2 h−1). This is likely because particle mass decreased rapidly by evaporation, but the change of particle number was less prominent. The multiple linear regression results showed a significant interaction effect of the nicotine level and PG/VG ratio on the particle loss rate (p < 0.001 for both PNC and PM2.5). For nicotine-free e-liquid, the particle loss rates significantly increased with increasing PG/VG ratios (p = 0.001 for PNC; p < 0.05 for PM2.5; and ). Once nicotine was added to the e-liquid, significant decreases in the particle loss rate were observed as the PG/VG ratio increased (p = 0.004 for PNC; p < 0.001 for PM2.5).
According to Raoult’s law, the evaporation rate of each component in the e-liquid is subject to the product of its saturation vapor pressure and its mole fraction. The PG/VG ratio that determines the saturation vapor pressure of the e-liquid mixtures likely governs the volatility of e-cig aerosols. For example, the PG-based mixture makes e-cig aerosols more volatile (i.e., Psat = ∼ 20 Pa), whereas the VG-based mixture makes them much less volatile (i.e., Psat = 0.01 Pa). However, this principle can be only applied to nicotine-free e-liquids. The addition of nicotine, whose vapor pressure falls between that of PG and VG, may also affect the overall e-liquid saturation vapor pressure. The fundamental principle determining the saturation vapor pressure of the e-liquid mixture, however, is complicated and is beyond the scope of the current work. Future research is warranted to systematically evaluate to what extent the reactions between PG, VG, and nicotine could affect the change of e-cig particle volatility.
The change from positive to negative association between PG/VG ratio and particle loss rate is mainly driven by the significant differences in the particle loss rates between e-liquids with and without nicotine when the percentage of PG is greater than 30% for PNC and 50% for PM2.5, respectively (). The significant effect of nicotine on the particle loss rates suggests that the presence of nicotine might contribute to reducing the volatility of e-cig aerosols when the PG/VG ratio is high enough. The change of volatility in mainstream e-cig aerosols could potentially affect the particle concentration and deposition pattern after particles are inhaled. In an indoor environment, the concentration and transport of secondhand e-cig aerosols might also be affected by nicotine in the e-liquid.
PG and VG could undergo thermal degradation when in contact with the heating coil of the e-cig atomizer to form a significant amount of volatile carbonyl compounds, such as formaldehyde, acetaldehyde, acrolein and acetone (Geiss, Bianchi, and Barrero-Moreno Citation2016; Kosmider et al. Citation2018; Ogunwale et al. Citation2017; Sleiman et al. Citation2016). PG is more susceptible to thermal decomposition than VG, leading to more volatile carbonyls generated from PG-based e-liquids (Kosmider et al. Citation2014). With greater nicotine content in the e-liquid, however, lower levels of these carbonyls are generated potentially reducing the volatility of e-cig aerosols (Kosmider et al. Citation2018). On the other hand, under certain temperature and oxidative conditions and in the presence of metals, these carbonyls might further degrade to acidic products that can protonate the nitrogen on the pyrrolidine ring in nicotine when the e-liquid is aerosolized (Liang and Pankow Citation1996; Rossiter et al. Citation1985). Compared to VG-based e-liquids, PG-based e-liquids with lower pH could facilitate the formation of the protonated nicotine with lower volatility than the free-base nicotine in the e-cig aerosol (El-Hellani et al. Citation2015; Son et al. Citation2018). Consequently, depending on the chemistry and rate at which these possible acidic degradation compounds can form in the aerosol, nicotine may interact more strongly with these acidic products causing the particle volatility to decrease (Jensen, Strongin, and Peyton Citation2017).
During the vaporization process, ß-nicotyrine can be formed as a result of catalytic dehydrogenation of nicotine at 300–500 °C. Thus, another plausible reason that nicotine contributes to reducing particle loss rate is the increased interactions between the aromatic electrons in ß-nicotyrine and polar PG and VG (Abramovitz et al. Citation2015). The nicotyrine to nicotine ratio (NNR) in e-cig aerosols was higher for PG-based e-liquids than e-liquids containing both PG and VG, suggesting that as the PG/VG ratio increases, the NNR may also increase (Abramovitz et al. Citation2015). Furthermore, nicotyrine is one order of magnitude less volatile than nicotine, rendering it more likely than nicotine to remain in the particle phase (Abramovitz et al. Citation2015). Therefore, with nicotine in the e-liquid, nicotyrine’s increased affinity for the particle phase in PG-based aerosols may cause the particles to be less volatile compared to VG-based aerosols.
With the same amount of nicotine in the e-liquid, more nicotine was found in the e-cig aerosol with increasing PG/VG ratios (Baassiri et al. Citation2017; El-Hellani et al. Citation2018; Talih et al. Citation2017), suggesting even larger impacts of nicotine on the dynamics of e-cig aerosols with elevated PG content. In addition, the newly introduced pod-based e-cigs with extremely high nicotine concentrations of 5.0% or greater might deliver more particles after inhaled and warrants future studies (Goniewicz et al. Citation2019; Huang et al. Citation2019).
This study used the regression of first-order decay rate of particle concentration to determine particle loss rate. Since coagulation may play a role in decreasing particle number concentrations, we used SMPS data to estimate the t50 (time required to achieve 50% ) solely due to coagulation. We found the t50 due to coagulation was approximately 5–6 h, which was 14–17 times longer than the overall t50 (i.e., ∼ 20 min) for all the e-liquid mixtures summarized in . Therefore, coagulation during the decay period was negligible compared to other particle loss mechanisms in this study (see details in the SI). One limitation of this study was that the mass of e-liquid consumed per puff was not measured and should be addressed in future studies to account for other potential mass loss.
3.4. Particle size distribution
Time-resolved particle size distributions measured for the three e-liquid mixtures (i.e., PG/VG = 0/100, 50/50, and 100/0) with and without nicotine are shown as contour plots in . These three PG/VG ratios were chosen because PG-based and VG-based e-liquids represent the two extreme conditions, and significant differences in particle loss rate between with and without nicotine were observed for both PNC and PM2.5 at the PG/VG of 50/50 (see ).
Figure 5. Averaged particle size distributions (dN/dLogDp) for e-liquid mixtures (i.e., PG/VG =0/100, 50/50, and 100/0) without nicotine (0.0%; a, b, and c) and with nicotine (2.4%; d, e, and f). The vertical axes represent particle size on a logarithmic scale, the horizontal axes represent elapsed time in hours from the start of sampling, and the color scale represents particle number concentration at a certain time and diameter. Linear interpolation is used to fill the data gap between the SMPS and APS output (289 nm–540 nm).
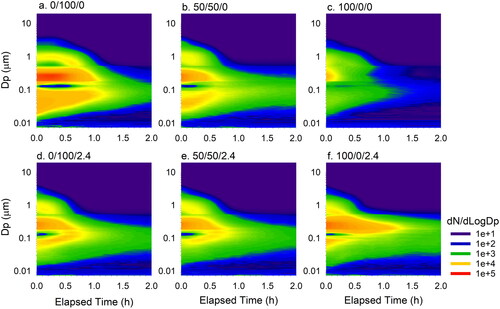
In , the x-axis presents the elapsed time at which data were collected, the y-axis is the particle size in log scale, and the color intensity indicates normalized PNC (dN/dLogDp) for a given size at a given time. The same normalized concentration scale was used for all plots. Overall, most e-cig particles were within the submicron size range, which was in good agreement with previous studies (Fuoco et al. Citation2014; Ingebrethsen, Cole, and Alderman Citation2012). Before decay started, we observed similar tri-modal particle size distributions across all e-liquid mixtures with a primary mode at 250 nm and two secondary modes at approximately 30–80 nm and 1 µm. During the 2-h decay, the mode diameter at approximately 1 µm decreased, while the mode of nanoparticles (< 100 nm) increased. This finding is consistent with Mikheev et al.’s results (Mikheev et al. Citation2016) which have shown that under a high dilution condition, evaporation reduces the diameter of larger e-cig particles and increases the number of nanoparticles. As a result, the e-cig aerosol shifted from a tri-modal size distribution to a bi-modal distribution and even a single-mode after aging.
For nicotine-free e-liquid, a clear pattern was observed showing that the e-cig particle concentration decayed faster with an increasing PG/VG ratio (). In contrast, the decay of e-cig particle concentration with nicotine showed an opposite trend (). Under the extreme condition of PG-based mixtures (PG/VG ratio = 100/0; and ), the addition of nicotine in the e-liquid slowed down the decay. Based on these observations, the interference of nicotine in e-liquid plays an important role in the physical properties of e-cig aerosols and warrants further study.
4. Conclusions
This study characterized e-cig mainstream aerosols generated using e-liquids of different PG/VG ratios with and without nicotine in terms of particle emission, particle loss rate, and particle size distribution. For the 10 tested e-liquid mixtures, the mean emission factors of PNC and PM2.5 were 2.5 × 10⁷ (7 × 10⁶) particles/puff and 113 (42) µg/puff, respectively. The addition of nicotine in the e-liquid significantly decreased the particle number emission factor by 33%. The PM2.5 emission factor was negatively associated with PG content in the e-liquid. The multiple linear regression analysis showed a significant interaction effect of the nicotine level and PG/VG ratio on the particle loss rate. For nicotine-free e-liquid, a greater PG content increased the particle loss rate. On the other hand, with nicotine in the e-liquid, the greater PG content decreased the particle loss rates. For both PNC and PM2.5, significant differences in particle loss rates were observed between e-liquids with and without nicotine when the PG/VG ratios were greater than 30/70. Overall, the particle loss rate measured by PM2.5 was about 5–6 times greater than that measured by PNC. In addition, we observed a tri-modal particle size distribution with the primary mode around 250 nm and two secondary modes at 30–80 nm and ∼1 µm across all tested e-liquid mixtures. As they aged in the test chamber, e-cig aerosols shifted to a bimodal and then a single-mode distribution. Understanding the dynamics of e-cig aerosols is important for modeling respiratory deposition and for estimating exposures in an indoor environment.
Supplemental Material
Download MS Word (2.2 MB)Additional information
Funding
References
- Abramovitz, A., A. McQueen, R. E. Martinez, B. J. Williams, and W. Sumner. 2015. Electronic cigarettes: The nicotyrine hypothesis. Med. Hypotheses. 85 (3):305–10. doi:10.1016/j.mehy.2015.06.002.
- Adroit Market Research. 2018. Global e-cigarette market size 2017 by type (disposable, rechargeable, modular), by region and forecast 2018 to 2025.
- Baassiri, M., S. Talih, R. Salman, N. Karaoghlanian, R. Saleh, R. E. Hage, N. Saliba, and A. Shihadeh. 2017. Clouds and “throat hit”: Effects of liquid composition on nicotine emissions and physical characteristics of electronic cigarette aerosols. Aerosol Sci. Technol. 51 (11):1231–9. doi:10.1080/02786826.2017.1341040.
- Baweja, R., K. M. Curci, J. Yingst, S. Veldheer, S. Hrabovsky, S. J. Wilson, T. T. Nichols, T. Eissenberg, and J. Foulds. 2016. Views of experienced electronic cigarette users. Addict. Res. Theory. 24 (1):80–8. doi:10.3109/16066359.2015.1077947.
- Behar, R. Z., M. Hua, and P. Talbot. 2015. Puffing topography and nicotine intake of electronic cigarette users. Plos One. 10 (2):e0117222. doi:10.1371/journal.pone.0117222.
- Breland, A., E. Soule, A. Lopez, C. Ramoa, A. El-Hellani, and T. Eissenberg. 2017. Electronic cigarettes: What are they and what do they do? Ann. N. Y. Acad. Sci. 1394 (1):5–30. doi:10.1111/nyas.12977.
- Chun, L. F., F. Moazed, C. S. Calfee, M. A. Matthay, and J. E. Gotts. 2017. Pulmonary toxicity of e-cigarettes. Am. J. Physiol. Lung Cell Mol. Physiol. 313 (2):L193–L206. doi:10.1152/ajplung.00071.2017.
- Cullen, K. A., B. K. Ambrose, A. S. Gentzke, B. J. Apelberg, A. Jamal, and B. A. King. 2018. Notes from the field: Use of electronic cigarettes and any tobacco product among middle and high school students - United States, 2011–2018. MMWR. Morb. Mortal. Wkly. Rep. 67 (45):1276–7. doi:10.15585/mmwr.mm6745a5.
- Dockery, D. W., and J. D. Spengler. 1981. Indoor-outdoor relationships of respirable sulfates and particles. Atmos. Environ. 15 (3):335–43. doi:10.1016/0004-6981(81)90036-6.
- El-Hellani, A., R. El-Hage, R. Baalbaki, R. Salman, S. Talih, A. Shihadeh, and N. A. Saliba. 2015. Free-base and protonated nicotine in electronic cigarette liquids and aerosols. Chem. Res. Toxicol. 28 (8):1532–7. doi:10.1021/acs.chemrestox.5b00107.
- El-Hellani, A., R. Salman, R. El-Hage, S. Talih, N. Malek, R. Baalbaki, N. Karaoghlanian, R. Nakkash, A. Shihadeh, and N. A. Saliba. 2018. Nicotine and carbonyl emissions from popular electronic cigarette products: Correlation to liquid composition and design characteristics. Nicotine Tob. Res. 20 (2):215–23. doi:10.1093/ntr/ntw280.
- Etter, J. F., E. Zather, and S. Svensson. 2013. Analysis of refill liquids for electronic cigarettes. Addiction 108 (9):1671–9. doi:10.1111/add.12235.
- Farsalinos, K. E., G. Romagna, D. Tsiapras, S. Kyrzopoulos, and V. Voudris. 2013. Evaluation of electronic cigarette use (vaping) topography and estimation of liquid consumption: Implications for research protocol standards definition and for public health authorities' regulation. Int. J. Environ. Res. Public Health 10 (6):2500–14. doi:10.3390/ijerph10062500.
- Feng, Y., C. Kleinstreuer, and A. Rostami. 2015. Evaporation and condensation of multicomponent electronic cigarette droplets and conventional cigarette smoke particles in an idealized g3-g6 triple bifurcating unit. J. Aerosol Sci. 80:58–74. doi:10.1016/j.jaerosci.2014.11.002.
- Flora, J. W., N. Meruva, C. B. Huang, C. T. Wilkinson, R. Ballentine, D. C. Smith, M. S. Werley, and W. J. McKinney. 2016. Characterization of potential impurities and degradation products in electronic cigarette formulations and aerosols. Regul. Toxicol. Pharmacol. 74:1–11. doi:10.1016/j.yrtph.2015.11.009.
- Floyd, E. L., L. Queimado, J. Wang, J. L. Regens, and D. L. Johnson. 2018. Electronic cigarette power affects count concentration and particle size distribution of vaping aerosol. Plos One 13 (12):e0210147. doi:10.1371/journal.pone.0210147.
- Fung, C. C. D., S. Shu, and Y. Zhu. 2014. Ultrafine particles generated from coloring with scented markers in the presence of ozone. Indoor Air. 24 (5):503–10. doi:10.1111/ina.12103.
- Fuoco, F. C., G. Buonanno, L. Stabile, and P. Vigo. 2014. Influential parameters on particle concentration and size distribution in the mainstream of e-cigarettes. Environ. Pollut. 184:523–9. doi:10.1016/j.envpol.2013.10.010.
- Geiss, O., I. Bianchi, F. Barahona, and J. Barrero-Moreno. 2015. Characterisation of mainstream and passive vapours emitted by selected electronic cigarettes. Int. J. Hyg. Environ. Health. 218 (1):169–80. doi:10.1016/j.ijheh.2014.10.001.
- Geiss, O., I. Bianchi, and J. Barrero-Moreno. 2016. Correlation of volatile carbonyl yields emitted by e-cigarettes with the temperature of the heating coil and the perceived sensorial quality of the generated vapours. Int. J. Hyg. Environ. Health. 219 (3):268–77. doi:10.1016/j.ijheh.2016.01.004.
- Gong, L. W., B. Xu, and Y. F. Zhu. 2009. Ultrafine particles deposition inside passenger vehicles. Aerosol. Sci. Technol. 43 (6):544–53. doi:10.1080/02786820902791901.
- Goniewicz, M. L., R. Boykan, C. R. Messina, A. Eliscu, and J. Tolentino. 2019. High exposure to nicotine among adolescents who use juul and other vape pod systems (‘pods’). Tob. Control. 28 (6):676–7. doi:10.1136/tobaccocontrol-2018-054565.
- Goniewicz, M. L., and L. Lee. 2015. Electronic cigarettes are a source of thirdhand exposure to nicotine. Nicotine Tob. Res. 17 (2):256–8. doi:10.1093/ntr/ntu152.
- Hartmann-Boyce, J., R. Begh, and P. Aveyard. 2018. Electronic cigarettes for smoking cessation. BMJ 360:j5543. doi:10.1136/bmj.j5543.
- He, C. R., L. D. Morawska, J. Hitchins, and D. Gilbert. 2004. Contribution from indoor sources to particle number and mass concentrations in residential houses. Atmos. Environ. 38 (21):3405–15. doi:10.1016/j.atmosenv.2004.03.027.
- Hinds, W. C. 1999. Aerosol technology: Properties, behavior, and measurement of airborne particles. USA: Wiley.
- Hua, M., H. Yip, and P. Talbot. 2013. Mining data on usage of electronic nicotine delivery systems (ends) from youtube videos. Tob. Control. 22 (2):103–6. doi:10.1136/tobaccocontrol-2011-050226.
- Huang, J., Z. Duan, J. Kwok, S. Binns, L. Vera, Y. Kim, G. Szczypka, and S. Emery. 2019. Vaping versus juuling: How the extraordinary growth and marketing of juul transformed the us retail e-cigarette market. Tob. Control. 28 (2):146–51. doi:10.1136/tobaccocontrol-2018-054382.
- Ingebrethsen, B. J., S. K. Cole, and S. L. Alderman. 2012. Electronic cigarette aerosol particle size distribution measurements. Inhal. Toxicol. 24 (14):976–84. doi:10.3109/08958378.2012.744781.
- Jenkins, R. A., R. H. Ilgner, B. A. Tomkins, and D. W. Peters. 2004. Development and application of protocols for the determination of response of real-time particle monitors to common indoor aerosols. J. Air Waste Manag. Assoc. 54 (2):229–41. doi:10.1080/10473289.2004.10470892.
- Jensen, R. P., R. M. Strongin, and D. H. Peyton. 2017. Solvent chemistry in the electronic cigarette reaction vessel. Sci. Rep. 7:42549. doi:10.1038/srep42549.
- Kim, H. J., and H. S. Shin. 2013. Determination of tobacco-specific nitrosamines in replacement liquids of electronic cigarettes by liquid chromatography-tandem mass spectrometry. J. Chromatogr. A 1291:48–55. doi:10.1016/j.chroma.2013.03.035.
- Kosmider, L., C. F. Kimber, J. Kurek, O. Corcoran, and L. E. Dawkins. 2018. Compensatory puffing with lower nicotine concentration e-liquids increases carbonyl exposure in e-cigarette aerosols. Nicotine Tob. Res. 20 (8):998–1003. doi:10.1093/ntr/ntx162.
- Kosmider, L., A. Sobczak, M. Fik, J. Knysak, M. Zaciera, J. Kurek, and M. L. Goniewicz. 2014. Carbonyl compounds in electronic cigarette vapors: Effects of nicotine solvent and battery output voltage. Nicotine Tob. Res. 16 (10):1319–26. doi:10.1093/ntr/ntu078.
- Layden, J. E., I. Ghinai, I. Pray, A. Kimball, M. Layer, M. W. Tenforde, L. Navon, B. Hoots, P. P. Salvatore, M. Elderbrook, et al. 2020. Pulmonary illness related to e-cigarette use in illinois and wisconsin—preliminary report. N Engl. J. Med. 382 (10):903–16. doi:10.1056/NEJMoa1911614.
- Li, L., Y. Lin, T. Xia, and Y. Zhu. 2020. Effects of electronic cigarettes on indoor air quality and health. Annu. Rev. Public Health. 41:363–80. doi:10.1146/annurev-publhealth-040119-094043.
- Liang, C. K., and J. F. Pankow. 1996. Gas/particle partitioning of organic compounds to environmental tobacco smoke: Partition coefficient measurements by desorption and comparison to urban particulate material. Environ. Sci. Technol. 30 (9):2800–5. doi:10.1021/es960050x.
- Liu, J., D. Fung, J. Jiang, and Y. Zhu. 2014. Ultrafine particle emissions from essential-oil-based mosquito repellent products. Indoor Air. 24 (3):327–35. doi:10.1111/ina.12080.
- Malas, M., J. van der Tempel, R. Schwartz, A. Minichiello, C. Lightfoot, A. Noormohamed, J. Andrews, L. Zawertailo, and R. Ferrence. 2016. Electronic cigarettes for smoking cessation: A systematic review. Nicotine Tob. Res. 18 (10):1926–36. doi:10.1093/ntr/ntw119.
- Manigrasso, M., G. Buonanno, F. C. Fuoco, L. Stabile, and P. Avino. 2015. Aerosol deposition doses in the human respiratory tree of electronic cigarette smokers. Environ. Pollut. 196:257–67. doi:10.1016/j.envpol.2014.10.013.
- Martuzevicius, D., T. Prasauskas, A. Setyan, G. O’Connell, R. Julien, S. Colard, and X. Cahours. 2019. Characterization of the spatial and temporal dispersion differences between exhaled e-cigarette mist and cigarette smoke. Nicotine Tob. Res. 21 (10):1371–7. doi:10.1093/ntr/nty1.
- McAuley, T. R., P. K. Hopke, J. Zhao, and S. Babaian. 2012. Comparison of the effects of e-cigarette vapor and cigarette smoke on indoor air quality. Inhal. Toxicol. 24 (12):850–7. doi:10.3109/08958378.2012.724728.
- Meng, Q., Y. Son, H. Kipen, D. Laskin, S. Schwander, and C. Delnevo. 2017. Particles released from primary e-cigarette vaping: Particle size distribution and particle deposition in the human respiratory tract. Am. J. Respir. Crit. Care Med. 195:A1023.
- Mikheev, V. B., M. C. Brinkman, C. A. Granville, S. M. Gordon, and P. I. Clark. 2016. Real-time measurement of electronic cigarette aerosol size distribution and metals content analysis. Nicotine Tob. Res. 18 (9):1895–902. doi:10.1093/ntr/ntw128.
- Mikheev, V. B., A. Ivanov, E. A. Lucas, P. L. South, H. O. Colijn, and P. I. Clark. 2018. Aerosol size distribution measurement of electronic cigarette emissions using combined differential mobility and inertial impaction methods: Smoking machine and puff topography influence. Aerosol. Sci. Technol. 52 (11):1233–48. doi:10.1080/02786826.2018.1513636.
- Nguyen, C., L. Li, C. A. Sen, E. Ronquillo, and Y. Zhu. 2019. Fine and ultrafine particles concentrations in vape shops. Atmos. Environ. 211:159–69. doi: . doi:10.1016/j.atmosenv.2019.05.015.
- Ogunwale, M. A., M. X. Li, M. V. R. Raju, Y. Z. Chen, M. H. Nantz, D. J. Conklin, and X. A. Fu. 2017. Aldehyde detection in electronic cigarette aerosols. Acs Omega. 2 (3):1207–14. doi:10.1021/acsomega.6b00489.
- Polosa, R., and P. Caponnetto. 2016. The health effects of electronic cigarettes. N. Engl. J. Med. 375 (26):2608. doi:10.1056/NEJMc1613869.
- Robinson, R. J., E. C. Hensel, P. N. Morabito, and K. A. Roundtree. 2015. Electronic cigarette topography in the natural environment. PloS One. 10 (6):e0129296. doi:10.1371/journal.pone.0129296.
- Rossiter, W. J., M. Godette, P. W. Brown, and K. G. Galuk. 1985. An investigation of the degradation of aqueous ethylene-glycol and propylene-glycol solutions using ion chromatography. Solar Energy Mater. 11 (5–6):455–467. doi:10.1016/0165-1633(85)90016-4.
- Schober, W., K. Szendrei, W. Matzen, H. Osiander-Fuchs, D. Heitmann, T. Schettgen, R. A. Jorres, and H. Fromme. 2014. Use of electronic cigarettes (e-cigarettes) impairs indoor air quality and increases feno levels of e-cigarette consumers. Int. J. Hyg. Environ. Health. 217 (6):628–637. doi:10.1016/j.ijheh.2013.11.003.
- Schripp, T., D. Markewitz, E. Uhde, and T. Salthammer. 2013. Does e-cigarette consumption cause passive vaping? Indoor Air. 23 (1):25–31. doi:10.1111/j.1600-0668.2012.00792.x.
- Schripp, T., M. Wensing, E. Uhde, T. Salthammer, C. He, and L. Morawska. 2008. Evaluation of ultrafine particle emissions from laser printers using emission test chambers. Environ. Sci. Technol. 42 (12):4338–4343. doi:10.1021/es702426m.
- Scungio, M., L. Stabile, and G. Buonanno. 2018. Measurements of electronic cigarette-generated particles for the evaluation of lung cancer risk of active and passive users. J. Aerosol Sci. 115:1–11. doi:10.1016/j.jaerosci.2017.10.006.
- Shi, S. S., S. H. Zhu, E. S. Lee, B. Zhao, and Y. F. Zhu. 2016. Performance of wearable ionization air cleaners: Ozone emission and particle removal. Aerosol Sci. Technol. 50 (3):211–221. doi:10.1080/02786826.2016.1139045.
- Sleiman, M., J. M. Logue, V. N. Montesinos, M. L. Russell, M. I. Litter, L. A. Gundel, and H. Destaillats. 2016. Emissions from electronic cigarettes: Key parameters affecting the release of harmful chemicals. Environ. Sci. Technol. 50 (17):9644–9651. doi:10.1021/acs.est.6b01741.
- Son, Y., O. Wackowski, C. Weisel, S. Schwander, G. Mainelis, C. Delnevo, and Q. Y. Meng. 2018. Evaluation of e-vapor nicotine and nicotyrine concentrations under various e-liquid compositions, device settings, and vaping topographies. Chem. Res. Toxicol. 31 (9):861–868. doi:10.1021/acs.chemrestox.8b00063.
- Sosnowski, T. R., and M. Odziomek. 2018. Particle size dynamics: Toward a better understanding of electronic cigarette aerosol interactions with the respiratory system. Front. Physiol. 9:853. doi:10.3389/fphys.2018.00853.
- Talih, S., Z. Balhas, R. Salman, R. El-Hage, N. Karaoghlanian, A. El-Hellani, M. Baassiri, E. Jaroudi, T. Eissenberg, N. Saliba, et al. 2017. Transport phenomena governing nicotine emissions from electronic cigarettes: Model formulation and experimental investigation. Aerosol Sci. Technol. 51 (1):1–11. doi:10.1080/02786826.2016.1257853.
- Vo, U. U. T., and M. P. Morris. 2014. Nonvolatile, semivolatile, or volatile: Redefining volatile for volatile organic compounds. J. Air Waste Manag. Assoc. 64 (6):661–669. doi:10.1080/10962247.2013.873746.
- Williams, M., A. Villarreal, K. Bozhilov, S. Lin, and P. Talbot. 2013. Metal and silicate particles including nanoparticles are present in electronic cigarette cartomizer fluid and aerosol. Plos One 8 (3):e57987–11. doi:10.1371/journal.pone.0057987.
- Wright, T. P., C. Song, S. Sears, and M. D. Petters. 2016. Thermodynamic and kinetic behavior of glycerol aerosol. Aerosol. Sci. Technol. 50 (12):1385–1396. doi:10.1080/02786826.2016.1245405.
- Yingst, J. M., S. Veldheer, S. Hrabovsky, T. T. Nichols, S. J. Wilson, and J. Foulds. 2015. Factors associated with electronic cigarette users' device preferences and transition from first generation to advanced generation devices. Nicotine Tob. Res. 17 (10):1242–1246. doi:10.1093/ntr/ntv052.
- Yoong, S. L., E. Stockings, L. K. Chai, F. Tzelepis, J. Wiggers, C. Oldmeadow, C. Paul, A. Peruga, M. Kingsland, J. Attia, et al. 2018. Prevalence of electronic nicotine delivery systems (ends) use among youth globally: A systematic review and meta-analysis of country level data. Aust N Z J Public Health 42 (3):303–308. doi:10.1111/1753-6405.12777.
- Zervas, E., E. Litsiou, K. Konstantopoulos, S. Poulopoulos, and P. Katsaounou. 2018. Physical characterization of the aerosol of an electronic cigarette: Impact of refill liquids. Inhal. Toxicol. 30 (6):218–223. doi:10.1080/08958378.2018.1500662.
- Zhang, Q. F., and Y. F. Zhu. 2010. Measurements of ultrafine particles and other vehicular pollutants inside school buses in south texas. Atmos. Environ. 44 (2):253–261. doi:10.1016/j.atmosenv.2009.09.044.
- Zhang, Y. P., W. Sumner, and D. R. Chen. 2013. In vitro particle size distributions in electronic and conventional cigarette aerosols suggest comparable deposition patterns. Nicotine Tob. Res. 15 (2):501–508. doi:10.1093/ntr/nts165.
- Zhao, T., S. Shu, Q. Guo, and Y. Zhu. 2016. Effects of design parameters and puff topography on heating coil temperature and mainstream aerosols in electronic cigarettes. Atmos. Environ. 134:61–69. doi: . doi:10.1016/j.atmosenv.2016.03.027.
- Zhao, T. K., C. Nguyen, C. H. Lin, H. R. Middlekauff, K. Peters, R. Moheimani, Q. J. Guo, and Y. F. Zhu. 2017. Characteristics of secondhand electronic cigarette aerosols from active human use. Aerosol. Sci. Technol. 51 (12):1368–1376. doi:10.1080/02786826.2017.1355548.