
 ?Mathematical formulae have been encoded as MathML and are displayed in this HTML version using MathJax in order to improve their display. Uncheck the box to turn MathJax off. This feature requires Javascript. Click on a formula to zoom.
Abstract
The Filter Inlet for Gases and AEROsols coupled with a chemical ionization mass spectrometer (FIGAERO-CIMS) measures particle-phase organics via temperature-programmed thermal desorption, though the extent to which different compounds undergo thermal decomposition is not well characterized. We study the effect of functional groups on the degree and pathways (decarboxylation and dehydration) of thermal decomposition in FIGAERO-CIMS using atmospherically relevant alcohols, monoacids, diacids, polyacids, and multifunctional acids. Based on their carbon oxidation state, compounds are categorized as less-oxidized oxygenated organic aerosol (LO-OOA), oxygenated organic aerosol (OOA), or more-oxidized OOA (MO-OOA), and exhibit little, minor, and considerable thermal decomposition, respectively. The result shows that thermal decomposition leads to negative biases in the measured elemental ratios (O:C and H:C) of compounds categorized as OOA and MO-OOA, except for the H:C ratio of those categorized as MO-OOA. We develop screening criteria for considerable thermal decomposition using double bond equivalent (DBE), maximum desorption temperature (Tmax), and the number of oxygen (nO) (DBE 2, Tmax
72
C, and nO > 4). Additionally, we find that
-keto-carboxylic acids and carboxyl-containing aromatic compounds are the only compounds that favor decarboxylation. Lastly, we investigate the effect of the instrument’s temperature ramping rate (40, 13.3, and 3.3
C min−1) on the thermal decomposition using citric acid. We recommend using 13.3 and 40
C min−1 ramping rates but do not recommend using 3.3
C min−1 which acts distinctively from 13.3 and 40
C min−1 with the most parental compound decomposition.
Copyright © 2021 American Association for Aerosol Research
EDITOR:
Introduction
Organic aerosol (OA) in the ambient air has great importance in both the health and climate aspects. OA is associated with respiratory and cardiovascular diseases which can hold the public’s health at stake (Mauderly and Chow Citation2008). Also, OA’s hygroscopicity is known to affect radiative forcing and the formation of cloud condensation nuclei (CCN) (Liu and Wang Citation2010; Rastak et al. Citation2017). Understanding the volatility of organic compounds is crucial as it determines whether a compound will partition to the particle phase and become OA (Seinfeld and Pandis Citation2016). A Filter Inlet for Gases and AEROsols (FIGAERO; Aerodyne Research, Inc.) coupled with a high-resolution time-of-flight chemical ionization mass spectrometer (HR-ToF-CIMS), hereafter referred to as FIGAERO-CIMS, allows for such volatility characterization via temperature-programmed thermal desorption of collected aerosol (Lopez-Hilfiker et al. Citation2014; Stark et al. Citation2017; Thornton et al. Citation2020). FIGAERO-CIMS has been used to measure the volatility of OA products generated in environmental chambers (D’Ambro et al. Citation2017, Citation2019; Hammes et al. Citation2019; Huang et al. Citation2018; Ylisirniö et al. Citation2020; Joo et al. Citation2019; Lopez-Hilfiker et al. Citation2015; Nah et al. Citation2016, Citation2019; Riva et al. Citation2019; Wang and Hildebrandt Ruiz Citation2018; Wang et al. Citation2020), ambient air (Chen et al. Citation2020; Lee et al. Citation2016, Citation2018; Lopez-Hilfiker et al. Citation2016; Riva et al. Citation2019; Stark et al. Citation2017), polyethylene glycols (PEG) (Bannan et al. Citation2019), and fresh and aged particle emissions from buses (Le Breton et al. Citation2019).
The separation of the vaporization and ionization processes in FIGAERO-CIMS allows the condensed materials to be detected at different desorption temperatures and characterized by volatility (Hearn and Smith Citation2004). Moreover, “soft” ionization of FIGAERO-CIMS, as opposed to “hard” ionization (e.g., electron ionization), is better at conserving the original molecular structure of the compounds with less fragmentation in the ionization step (Aljawhary, Lee, and Abbatt Citation2013; Hearn and Smith Citation2004). Lastly, the time-of-flight mass spectrometer is known for providing a high mass-to-charge resolution, which in return leads to an easier process for determining the elemental formula (Yatavelli et al. Citation2012).
On the other hand, one drawback of FIGAERO-CIMS is the potential occurrence of thermal decomposition during the desorption process. Desorption of particles happens at temperatures up to 200 C, where oxidized products are susceptible to thermal decomposition processes (Canagaratna et al. Citation2015). Several studies have discussed thermal decomposition in FIGAERO-CIMS (Chen et al. Citation2020; D'Ambro et al. Citation2017; Lee et al. Citation2016; Lopez-Hilfiker et al. Citation2014, Citation2015, Citation2016; Riva et al. Citation2019; Schobesberger et al. Citation2018; Stark et al. Citation2017; Wang et al. Citation2020; Ylisirniö et al. Citation2020). Lopez-Hilfiker et al. (Citation2015) have shown that low-volatility compounds can be detected as higher-volatility compounds due to thermal decomposition. Such finding is consistent with other studies which discovered that most of the measured signals corresponding to molecular tracers of isoprene-epoxydiol (IEPOX)-derived secondary organic aerosol (SOA) are artifacts of thermal decomposition of large compounds with low volatility (D'Ambro et al. Citation2019; Lopez-Hilfiker et al. Citation2016). In addition, during
-pinene SOA formation experiments, Riva et al. (Citation2019) observed an increase in high double bond equivalent (DBE) particles (C6-8HxO<5 molecules), which were postulated to be thermal decomposition fragments of high-molecular-weight organic molecules. Furthermore, another study on modeling of the FIGAERO-CIMS desorption process concluded that greater than 50% of oxygenated organic compounds detected in particle analysis of FIGAERO-CIMS are rather thermal decomposition products (Schobesberger et al. Citation2018). Such thermal decomposition can hinder one from distinguishing the real oxidation products from thermal decomposition artifacts created during the heating process.
A considerable amount of thermal decomposition is more likely to occur for the highly functionalized molecules in the FIGAERO-CIMS system and such compounds contribute to a large fraction of SOA (Lopez-Hilfiker et al. Citation2016; Stark et al. Citation2017). Moreover, thermal decomposition is also known to affect the thermogram commonly used for the volatility estimation of various chemical compounds (Stark et al. Citation2017). A recent study has utilized the positive matrix factorization (PMF) method to distinguish thermally decomposed products from the real compounds in SOA generated in laboratory experiments (Buchholz et al. Citation2020). However, no previous study has collectively characterized the thermal decomposition of compounds with different functional groups. A better understanding of the thermal decomposition of compounds in the FIGAERO-CIMS system will lead to a better understanding of the chemical composition and volatility of SOA commonly found in the atmosphere.
Another challenge in interpreting FIGAERO-CIMS data across multiple studies is that different temperature ramping rates during the desorption mode were used or recommended in different studies (Schobesberger et al. Citation2018; Stark et al. Citation2017; Thompson et al. Citation2017). The ramping rate to the maximum desorption temperature (200 °C) is an important factor that determines the signal-to-noise (S/N) ratio of the detected signals and the resolution of desorbing compounds (Lopez-Hilfiker et al. Citation2014). A faster ramping rate tends to enhance the S/N ratio which allows trace components to be better identified. On the other hand, a slower ramping rate has the advantage of separating compounds that desorb at similar temperatures. As previous literature utilizing the FIGAERO-CIMS instrument used various combinations of ramping, soaking, and cooling times, it is often difficult to directly compare results from one study to another. The empirically recommended ramping rate from a previous study is between 10 to 50 °C min−1 that balances the best between the S/N ratio and the resolution (Lopez-Hilfiker et al. Citation2014). Also, Claflin and Ziemann (Citation2019) demonstrated that a slow ramping rate (2 °C min−1) leads to reversible decomposition of hemiacetal oligomers during temperature-programmed thermal desorption using thermal desorption particle beam mass spectrometer. Furthermore, Ylisirniö et al. (Citation2021) illustrated that ramping rates influence the measured maximum desorption temperature (Tmax) values by FIGAERO-CIMS. However, no previous study has systematically evaluated the impact of ramping rate on the degree of thermal decomposition using FIGAERO-CIMS.
Here, we first explore the degree and the major pathways (decarboxylation and dehydration) of thermal decomposition of selected organic species. Then we investigate the effect of three different ramping rates on the degree of thermal decomposition, Tmax, and instrument sensitivity. Tmax is defined consistently with the previous studies as the temperature at which a maximum signal of a compound is measured (Bannan et al. Citation2019; Stark et al. Citation2017). We utilize parameters that can be obtained from mass spectra and thermograms to predict thermal decomposition, identify different characteristics of compounds leading to dehydration vs. decarboxylation and recommend the most appropriate ramping rate to be used in an experimental setting.
Experimental section
Chemical standards tested
A series of oxygenated organic compounds (29 compounds in total) are investigated in this study, including a variety of alcohols, monoacids, diacids, polyacids, and multifunctional acids with varying oxygen-to-carbon (O:C) ratio, hydrogen-to-carbon (H:C) ratio, and oxidation states (OSC) of carbon defined as 2(O:C) – (H:C) (Kroll et al. Citation2011) (). All chemicals are purchased from Sigma-Aldrich (purities 95%). This set of standards is similar to that used in a previous study to characterize elemental ratios of organic compounds in aerosol mass spectrometry (Canagaratna et al. Citation2015).
Table 1. Chemical compounds tested in this study.
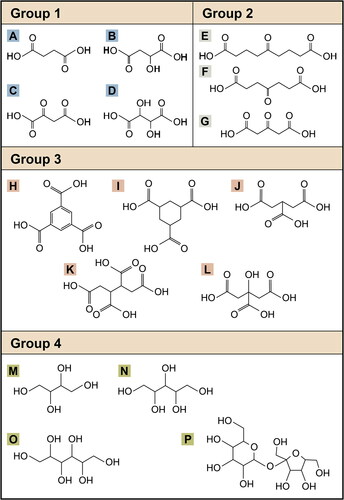
specifies the “Type” and “Group” of each compound. “Type” corresponds to the type of functional groups associated with each compound. The chemical standards are classified into five “Types” to investigate the effect of functional groups on thermal decomposition behavior. Alcohols (used interchangeably with polyalcohols in this work) include compounds that solely contain hydroxyl groups. Monoacids, diacids, and polyacids represent compounds solely composed of carboxyl groups. Multifunctional acids comprise compounds with two or more types of functional groups (hydroxyl, carbonyl, carboxyl, and acetal). For instance, sucrose is classified as multifunctional instead of alcohol as it has both hydroxyl and acetal functional groups. A subset of the chemicals is also categorized into four “Groups” (numbered as 1 to 4 in ) to evaluate the effect of chemical structure on thermal decomposition behavior. depicts the visualization of these groups. Group 1 includes diacids with four carbons in the backbone and allows for investigating how the presence of a hydroxyl or carbonyl group affects thermal decomposition behavior. Group 2 compounds all have identical functional groups (two carboxyl groups and one carbonyl group) but contain different numbers of carbons. Group 3 allows for examining the effect of the structure (i.e., linear or ring) of carboxylic acids on thermal decomposition behavior. Lastly, Group 4 compounds are alcohols and allow for investigating the influence of the number of hydroxyl groups and the effect of adding acetal to the alcohol on thermal decomposition.
Figure 1. Visualization of chemical structures of the compounds in each “Group” (). A: Succinic acid, B: Malic acid, C: Oxaloacetic acid, D: Tartaric acid, E: 5-Oxoazaleic acid, F: 4-Oxoheptanedioic acid, G: 1,3-Acetonedicarboxylic acid, H: Benzene-1,3,5-Tricarboxylic acid, I: 1,3,5-Cyclohexanetricarboxylic acid, J: Tricarballylic acid, K: 1,2,3,4-Butanetetracarboxylic acid, L: Citric acid, M: Meso-Erythritol, N: Xylitol, O: Mannitol, P: Sucrose.
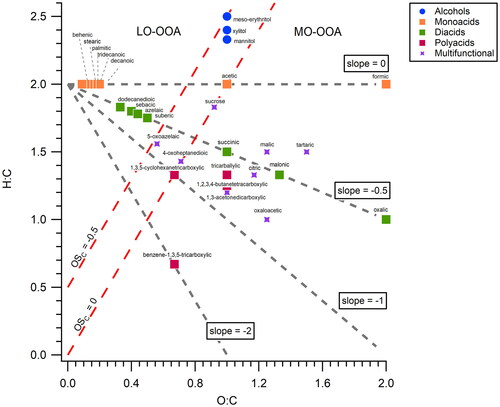
exhibits the standard compounds plotted onto the Van Krevelen diagram (Van Krevelen Citation1950), which has been used to characterize ambient bulk OA, different OA subtypes, and SOA formed in laboratory studies (Chhabra et al. Citation2011; Heald et al. Citation2010; Ng et al. Citation2011). The gray dashed lines represent the effect of adding different functional groups to a compound with no oxygen and a H:C ratio of 2. The slope of 0 represents the addition of alcohol or peroxide. The slope of −0.5 is caused by adding carboxylic acid with fragmentation, the slope of −1 shows the effect of adding carboxylic acid group, and the slope of −2 demonstrates the influence of adding ketone/aldehyde (Seinfeld and Pandis Citation2016; Van Krevelen Citation1950). Prior studies have shown that ambient OA can be deconvolved into different subtypes, where more-oxidized oxygenated organic aerosol (MO-OOA; formerly known as LV-OOA, low-volatility OOA) has higher OSC than less-oxidized OOA (LO-OOA; formerly known as SV-OOA, semi-volatile OOA) (Kroll et al. Citation2011; Jimenez et al. Citation2009; Ng et al. Citation2010, Citation2011; Zhang et al. Citation2007), and both are considered surrogates for ambient SOA. Here, based on the OSC of the standard compound, each compound is categorized into LO-OOA or MO-OOA according to their OSC cutoff values reported in Ng et al. (Citation2011) (). As shown in , if a compound has OSC smaller than or equal to −0.5 (OSC −0.5), it is categorized as LO-OOA. If a compound has OSC greater than or equal to 0 (OSC
), it is categorized as MO-OOA. Compounds that reside between OSC of −0.5 and 0 (–0.5 < OSC < 0) can be either LO-OOA or MO-OOA and are denoted as OOA in this article.
Figure 2. All compounds tested plotted onto the Van Krevelen diagram. A compound with OSC –0.5 is categorized as LO-OOA and a compound with OSC
is categorized as MO-OOA. If a compound’s OSC is –0.5 < OSC < 0, the compound can be either LO-OOA or MO-OOA and is categorized as OOA.
To prepare for the thermal desorption experiments, a standard solution is prepared by dissolving each compound (in solid form) in HPLC-grade acetone (Sigma-Aldrich) at the concentration of 0.05 g L−1. Acetone does not interfere with subsequent measurements as it evaporates at a much lower desorption temperature compared to the standards tested in this work. The sample solutions are used in thermal decomposition experiments described below.
FIGAERO-CIMS operation
A FIGAERO coupled to the Iodide-adduct HR-ToF-CIMS (HR-ToF-I-CIMS) (Aerodyne Research Inc.) is used for characterizing the thermal decomposition behavior of the chemical compounds. Lopez-Hilfiker et al. (Citation2014) provided detailed schematics, operations, and the design of the FIGAERO. The Iodide-adduct ionization is selective toward polar organic compounds (Aljawhary, Lee, and Abbatt Citation2013; Bertram et al. Citation2011; Huey, Hanson, and Howard Citation1995; Kercher, Riedel, and Thornton Citation2009; Lee et al. Citation2014; McNeill, Wolfe, and Thornton Citation2007; Nah et al. Citation2016; Takeuchi and Ng Citation2019), making it suitable for standards used in this work with the presence of polar functional groups.
The use of FIGAERO allows CIMS to measure speciated compounds in both gas and particle phases. In typical operation, gases are directly sampled through an inlet during measurement while particles are collected onto a 25-mm Zeflour filter (Pall Corporation). After collection, the linear actuator (Firgelli Technologies, L16) moves the filter to the desorption port to thermally desorb the particles off the filter using temperature-controlled dry N2. In this study, instead of collecting particles onto the filter, a known volume of the standard solutions is deposited onto the filter to characterize the thermal decomposition that occurs during the thermal desorption process (Lopez-Hilfiker et al. Citation2014; Stark et al. Citation2017). Specifically, approximately 100 ng of chemical analyte (2 μL of the sample solution at a concentration of 0.05 g L−1) is deposited onto a filter using a 10 μL gas-tight micro-syringe (Hamilton). The deposited filter is then loaded onto the FIGAERO manifold using sterilized forceps. Then the instrument is set to particle analysis mode, and the desorption initiates.
During the desorption mode, a temperature-programmed dry N2 gas stream flows through the filter at a rate of 2 slpm to desorb the loaded sample off the filter. The N2 stream is heated from room temperature (i.e., 22–25 °C) to 200 °C in 15 min (ramping rate: ∼13.3 °C min−1), stays at a constant temperature of 200 °C for 15 min (soaking time), and cools back to room temperature in 10 min, with a total runtime of 40 min. The EyeOnTM program (Aerodyne Research Inc.) controls this automated temperature cycle. During the desorption process, evaporated gases are continuously analyzed by HR-ToF-I-CIMS at 1 s−1. This operational setting accords with the previous literature that recommended the desorption mode total runtime to be 30–45 min with a ramping rate of 10–50 °C min−1 (Lopez-Hilfiker et al. Citation2014). The measurement begins with one blank run followed by two runs per chemical standard. The blank run undergoes the same FIGAERO-CIMS operation cycle as other runs but with a filter not loaded with any sample solution and later acts as a background measurement for the two subsequent sample runs. The average of two sample runs is used for the analysis of the data.
Data analysis method
FIGAERO-CIMS data are analyzed using the Tofware (Stark et al. Citation2015) package (version 2.5.11, Tofwerk, Switzerland, and Aerodyne) under Igor Pro software (v.6.37, Wavemetrics). Data are pre-averaged to 10 s before analysis. First, a unit mass resolution stick mass spectrum of a sample run minus the corresponding background run is constructed to identify the main products. Then for those main products, signals are normalized such that the sum of reagent ions (i.e., I- and H2OI-) is 106 count s−1 (cps). Figure S1A–C show results from thermal decomposition of malic acid iodide adduct (C4H6O5
I-) as an example, where the main decomposition product is maleic acid iodide adduct (C4H4O4
I-). Figure S1A exhibits the mass spectrum of malic acid. Figure S1B shows the time-series of malic acid iodide adduct and maleic acid iodide adduct, and Figure S1C displays their evolution as a function of temperature, known as a thermogram. Figure S1B is used to calculate the area under the curve, which gives the total count of a compound of interest and is referred to as the signal in this section. Figure S1C is used to find Tmax which is related to the volatility of a compound (Stark et al. Citation2017). Only compounds appearing as iodide adducts are examined in this study.
The fractions of four major species after the thermal desorption process are determined for each standard chemical compound to evaluate the pathway and the degree of thermal decomposition. These four major species are 1) decarboxylation product, 2) dehydration product, 3) parental compound, and 4) other. These four species are chosen based on results from previous studies and observations of thermal decomposition behavior of the tested chemical standards in this study. Previous studies on thermal decomposition of organic compounds showed dehydration and decarboxylation as the prominent thermal decomposition pathways (Canagaratna et al. Citation2015; Stark et al. Citation2017). These two previous studies also quantified the degree of thermal decomposition using the time traces of CO2, CO, and H2O concentrations. In our study, dehydration is defined as a loss of water (H2O) in the detected chemical formula and decarboxylation refers to a loss of carbon dioxide (CO2). Moreover, recent studies observed a high abundance of small compounds (MW < 80 g mol−1) such as formic acid (CH2O2) and glycolic acid (C2H4O3) in FIGAERO-CIMS mass spectra of ambient and chamber-generated SOA, possibly attributable to thermal decomposition (Chen et al. Citation2020; D'Ambro et al. Citation2017), which motivated our study to include the “other” category.
In this study, decarboxylation product refers to the summation of the primary (parental compound – CO2) and secondary decarboxylated (primary decarboxylated product – CO2) products. Dehydration product refers to the summation of the primary (parental compound – H2O) and secondary (primary dehydrated product – H2O) dehydrated products. Whether the compound undergoes dehydration or decarboxylation during the thermal desorption process directs the decomposition pathway, whereas the fraction of the parental compound to the sum of all major species illustrates the degree of thermal decomposition. Hence, the characterization of thermal decomposition inferred by the fraction of major species can elucidate these two essential insights about the thermal decomposition process. It is important to note that the reported fraction may not fully capture the true decomposition degree owing to variations in instrument sensitivity between a parental compound and its decomposition products. For instance, the fraction of thermal decomposition products can be underestimated if I-CIMS is less sensitive to the decomposed products. Moreover, for some compounds, the loss of functionalized groups after the thermal decomposition (e.g., a decomposed product of a monoacid) makes it nearly impossible for I-CIMS to detect the decomposed product.
To confirm that the dominant signals are from thermal decomposition products (i.e., dehydration and decarboxylation products) and the parental compound, the fraction of the summed signal of thermal decomposition products and the parental compound to the total detected signal (summation of the signals from all ions arising from the analyte after subtracting the signals from the blank measurement) is computed for each tested standard compound. For 22 out of 29 compounds, such fraction comes out to be 94%. Such a high fraction achieved elucidates that FIGAERO-CIMS is sensitive to most of the tested standard compounds. There are 4 compounds (i.e., mannitol, oxaloacetic acid, 1,3,5-cyclohexanetricarboxylic acid, and 1,3,5-benzenetricarboxylic acid) whose fraction is between 86 and 91%. These four compounds have on average about five orders of magnitude lower summed signal of decomposition products and the parental compound compared to the other 22 compounds. Thus, such fraction may have been lower as FIGAERO-CIMS is less sensitive to detecting these four compounds and their decomposition products, making the measurements more susceptible to background noise. It is worth noting that the remaining 6 to 14% of the total signal are unlikely real thermal decomposition products (e.g., Teflon filter’s background, unidentifiable background, or filter residual). The stick mass spectra of these 4 compounds are provided in Figure S2.
For the above 26 compounds, the fraction of each species is computed following EquationEquation (1)(1)
(1) .
(1)
(1)
where k refers to decarboxylation, dehydration, or parent. Following EquationEquation (1)
(1)
(1) , the fractions of decarboxylation product, dehydration product, and parental compound are calculated.
Three compounds (i.e., 1,2,3,4-butanetetracarboxylic acid, citric acid, and sucrose) do not follow the decomposition pattern described by EquationEquation (1)(1)
(1) . 1,2,3,4-butanetetracarboxylic and citric acids have 5.8% and 7.3% of signals coming from “other” products, lactic acid (MW = 91 g mol−1) and formic acid (MW = 46 g mol−1), respectively. For citric acid, another major “other” product arises from decarboxylation of the primary dehydration product, C5H6O4 (i.e., citric acid – H2O – CO2). For sucrose, 95.9% of signals are classified under “other”. Sucrose first breaks into two compounds and one of those compounds undergoes primary and secondary dehydration. Therefore, for these three compounds, the fraction of each species is computed following EquationEquation (2)
(2)
(2) .
(2)
(2)
where i refers to decarboxylation, dehydration, parent, or other. Following EquationEquation (2)
(2)
(2) , the fractions of decarboxylation product, dehydration product, parental compound, and other are calculated.
In addition to the fractions of major species, the average number of elements (carbon, hydrogen, and oxygen) (hereafter referred to as the measured number of elements) taking into account fractions of decomposition products are computed to determine the deviation from their true number of elements. Ideally, if thermal decomposition does not occur during thermal desorption, the mass spectrum would contain one single peak for a parental compound which will provide a true number of elements and the subsequently true molecular formula (MF). However, with thermal decomposition, the mass spectrum will contain peaks for decarboxylation, dehydration, and other products in addition to the parental compound. A larger deviation of the measured number of elements from the true number of elements indicates a higher degree of thermal decomposition and vice versa. An example calculation used to obtain the measured number of elements can be found in supplemental information (SI).
Ramping rate experiments
Experiments are conducted to investigate how the temperature ramping rate affects the magnitude and behavior of thermal decomposition, desorption temperature, and sensitivity. Specifically, three different ramping rates (40, 13.3, and 3.3 °C min−1) are evaluated while fixing the soaking time at 15 min and the cooling time at 10 min, corresponding to a total runtime of 30 min, 40 min, and 85 min, respectively. In these ramping rate experiments, citric acid is used as the sample compound for two main reasons. First, citric acid has been used as a standard in previous literature investigating thermal decomposition at a desorption temperature of 200 °C (Canagaratna et al. Citation2015; Stark et al. Citation2017). Second, citric acid exhibits a rich decomposition pattern that we can track down and use to explore how ramping rate affects decomposition. For each ramping rate experiment, it begins with a blank run at the ramping rate of interest, followed by two sample runs at the same ramping rate of interest. The blank-subtracted results from the two sample measurements are averaged.
Results and discussion
Effect of functional group on thermal decomposition
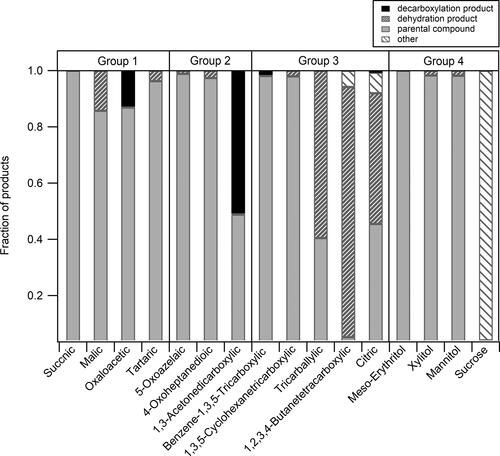
To systematically evaluate how different functional groups impact the thermal decomposition behavior, the standards are divided into five “Types” (), which are alcohols (compounds solely containing hydroxyl groups), monoacids (1 carboxyl group), diacids (2 carboxyl groups), polyacids (≥3 carboxyl groups), and multifunctional acids (≥2 types of functional groups). shows the fraction of the four major species detected for each standard compound.
Figure 3. Fraction of main species (decarboxylation product, dehydration product, parental compound, and other) after undergoing thermal desorption for compounds in each “Type” (functional group) (). For each type, the compounds are ordered in ascending O:C ratio. For each compound, the reported fraction value is the average of two experimental measurements. Note: Only one measurement is available for sucrose.
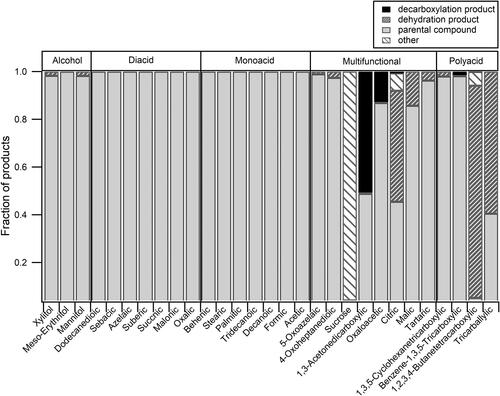
As seen in , for alcohols that solely contain hydroxyl groups, the thermal decomposition is minor regardless of the number of hydroxyl groups attached. For acids that solely contain carboxyl groups (monoacid, diacid, and polyacid), the number of carboxyl groups attached, and the structure of the compound are important. Specifically, if two or fewer carboxyl groups (number of carboxyl groups 2) are attached (monoacid and diacid), thermal decomposition is negligible. On the other hand, if three or more carboxyl groups (number of carboxyl groups
3) are attached (polyacid) and the compound has a linear structure, the compound undergoes significant thermal decomposition (i.e., 1,2,3,4-butanecarboxylic acid and tricarballylic acid). However, thermal decomposition for a ring-containing polyacid (e.g., 1,3,5-cyclohexanetricarboxylic acid and benzene-1,3,5-tricarboxylic acid) is negligible. Lastly, compounds classified under multifunctional type undergo a varying degree of thermal decomposition depending on the compounds’ molecular weights and combinations of functional groups.
A previous study using an aerosol mass spectrometer (AMS) found that alcohols undergo thermal decomposition even at a temperature as low as 200 °C (Canagaratna et al. Citation2015), but our study shows that alcohols only undergo minor thermal decomposition in FIGAERO-CIMS. The difference between flash vaporization in AMS used by Canagaratna et al. (Citation2015) and slow temperature ramping in FIGAERO-CIMS may explain the discrepancy. Based on the Tmax of these alcohols (Table S1), it is speculated that the majority of the compounds would have already evaporated before the temperature reaches 200 °C in our study. For monoacids and diacids, the negligible thermal decomposition makes them good vapor pressure calibration compounds for FIGAERO-CIMS (Lopez-Hilfiker et al. Citation2014; Ylisirniö et al. Citation2021). For linearly structured polyacids and multifunctional acids, consistent with the previous study using an instrument with desorption process, compounds that have high molecular weights with highly oxidized and functionalized groups attached undergo considerable thermal decomposition (Yatavelli et al. Citation2014).
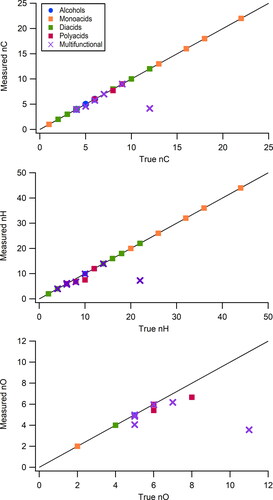
Next, we compare the measured number of elements (nC, nH, and nO) (calculated from Equations (S1-3 in the SI) with the true number of elements to investigate whether the number of elements can be a determining factor for the degree of thermal decomposition (). A larger deviation from the one-to-one line indicates a greater degree of thermal decomposition. Consistent with the results shown in , alcohols, monoacids, and diacids do not deviate from the one-to-one line. However, compounds classified under linearly structured polyacids and multifunctional acids undergo a considerable to a significant amount of thermal decomposition and deviate greatly from the one-to-one line. When the compound has nO ≤ 4, there is negligible thermal decomposition regardless of what functional group it contains. Thermal decomposition is more likely to occur for compounds with nO > 4 as the deviation increases accordingly.
Figure 4. Measured number of carbon (measured nC), hydrogen (measured nH), and oxygen (measured nO) plotted against the true number of carbon (true nC), hydrogen (true nH), and oxygen (true nO). The solid line corresponds to a one-to-one line. The data points are color-coded according to the functional groups.
After observing how the nO is an important factor for the extent of thermal decomposition, we investigate what other parameters could explain the degree of thermal decomposition. shows the scatter plots of fundamental parameters that can be easily obtained from FIGAERO-CIMS data. The standard compound is color-coded into three categories depending on the parental fraction remaining after the thermal desorption process: minor thermal decomposition (parental compound left: 85–100%), considerable thermal decomposition (parental compound left: 40–50%), and significant thermal decomposition (parental compound left: 0–10%). Explored parameters include the number of elements (nC, nH, nO), DBE, molecular weight (MW), and Tmax of the parental compound. DBE is indicative of the level of unsaturation (e.g., number of rings or double bonds). The only ring-containing compounds in this study are sucrose (DBE = 2), 1,3,5-cyclohexanetricarboxylic acid (DBE = 4), and benzene-1,3,5-tricarboxylic acid (DBE = 7). Except for sucrose, the other two compounds are categorized under polyacids type, and they undergo minor thermal decomposition (). Hence, for compounds that undergo considerable to significant decomposition in , DBE is indicative of having different numbers of double bonds rather than different numbers of rings (except for sucrose). Observations from 29 tested standard compounds suggest that the nO, DBE, and Tmax of the parental compound may be related to the degree of thermal decomposition. In accordance with the results shown in , the nO has to exceed four for considerable thermal decomposition to occur (nO > 4) and exceed seven for significant thermal decomposition to occur (nO > 7). Also, DBE has to be greater than or equal to two for considerable and significant thermal decomposition to take place (DBE 2). Moreover, Tmax has to be greater than or equal to 72 °C for considerable thermal decomposition to occur (Tmax
72 °C), and greater than or equal to 147 °C for significant thermal decomposition to take place (Tmax
147 °C). It should be noted though compounds that undergo minor decomposition can have various Tmax up to 137 °C (e.g., mannitol). summarizes these findings for minor, considerable, and significant amounts of thermal decomposition.
Figure 5. The scatter plots of various parameters including the nC, nO, nH, DBE, Tmax, and MW color-coded with the degree of thermal decomposition. The fraction on the y-axis indicates the fraction of parental compound left upon heating and is divided into three categories: (1) minor thermal decomposition (parental compound left: 85–100%, blue), (2) considerable thermal decomposition (parental compound left: 40–50%, purple), and (3) significant thermal decomposition (parental compound left: 0–10%, red).
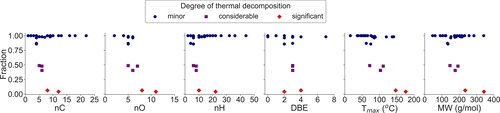
Table 2. Average effective MF and range of DBE, MW, nO, and Tmax for compounds exhibiting three different degrees of thermal decomposition: minor, considerable, and significant.
The previous investigation on thermal decomposition has demonstrated that Tmax > 120 °C is the condition at which the decarboxylation or dehydration reaction is likely to occur (Stark et al. Citation2017). This value is similar to the minimum Tmax for the significant thermal decomposition to take place for the standard compounds tested in this work (i.e., 147 °C). However, we recommend updating the safety cutline to 72 °C as we observe considerable thermal decomposition occurring for a compound with a Tmax at this temperature. Moreover, the nO and DBE should also be collectively considered for the possibility of thermal decomposition.
The five compounds that undergo considerable to significant thermal decomposition are sucrose, 1,2,3,4-butanecarboxylic acid, tricarboxylic acid, 1,3-acetonedicarboxylic acid, and citric acid. They are all classified as either multifunctional acids or polyacids. Also, except for sucrose (DBE = 2, nO > 4), these compounds have a commonality in that they all have at least three carbonyl groups with DBE 3 and nO > 4. This illustrates that DBE combined with nO may be useful in identifying multifunctional acids/polyacids that may undergo considerable to significant thermal decomposition. Therefore, in case the structures of compounds are unknown (e.g., FIGAERO-CIMS deployed in the field), these parameters may become useful for the FIGAERO-CIMS users to evaluate the extent of thermal decomposition.
There is a limitation in this method in that meeting the nO, DBE, and Tmax screening criteria discussed above do not guarantee that compounds will undergo considerable to significant thermal decomposition, although compounds that do experience considerable to significant thermal decomposition would meet these requirements. Moreover, given the limited extent of the dataset, there are only five compounds that experienced considerable to significant thermal decomposition out of 29 tested standard compounds, so further tests on more polyacids and multifunctional acids would be helpful to validate this observation. While these nO, DBE, and Tmax screening criteria are identified for organic compounds with functional groups limited to the carbonyl, carboxyl, hydroxyl, and acetal groups (as compounds tested in this study are limited to these functionalities), we expect the criteria to be applicable for OA in many ambient environments as OOA with these functionalities are common in the atmosphere (Chen et al. Citation2020; Dillner and Takahama Citation2015; Ditto et al. Citation2018; Takahama, Johnson, and Russell Citation2013). Our recent study that characterized SOA at a rural site in the Southeastern U.S. found that many of the standards tested in this study (e.g., malic acid, 1,3-acetonedicarboxylic acid, tricarballylic acid, glycolic acid, oxalic acid, 4-oxoheptanedioic acid) were abundant in the atmosphere (Chen et al. Citation2020). It was noted that a number of the C2 to C4 compounds (e.g., malic acid, oxalic acid, and glycolic acid) may be the thermal decomposition products from FIGAERO-CIMS.
Effect of chemical structure on thermal decomposition
A subset of compounds is classified into four “Groups” to evaluate the effect of chemical structure on thermal decomposition (, ). depicts the fraction of decarboxylated product, dehydrated product, parental compound, and other for each group of compounds.
Figure 6. Fraction of major species (decarboxylated product, dehydrated product, parental compound, and other) after undergoing thermal desorption for compounds in each “Group” ( and ). For each compound, the reported fraction value is the average of two experimental measurements. Note: Only one measurement is available for sucrose.
Group 1: Four carbon compounds with differing functional groups
All compounds in the first group have four carbons (C4) in the backbone and two carboxyl groups. This group allows for evaluating the effect of the addition of a hydroxyl or carbonyl functional group to a C4 diacid (succinic acid). As depicted in and discussed in the previous section, diacids alone (including succinic acid) do not experience thermal decomposition. However, adding a hydroxyl or carbonyl group to diacids enhances the degree of decomposition, but in different ways. Carbonyl-containing diacid (oxaloacetic acid) undergoes decarboxylation, whereas hydroxyl-containing diacid (malic acid) experiences dehydration. The degree of thermal decomposition in both cases is similar, with about 14% of the parental compound thermally decomposing. The addition of two hydroxyl groups (tartaric acid) leads to less decomposition, with only 4% of the parental compound decomposing to the dehydration product. It is noted that tartaric acid undergoing less thermal decomposition than malic acid is a nonsystemic behavior and future studies with different pairs of hydroxyl-containing diacid would be valuable.
Oxaloacetic acid undergoes decarboxylation as the presence of β-keto-carboxylic acid structure favors decarboxylation over dehydration (Gelles Citation1956). The presence of carbonyl in the beta position allows for the formation of enol, which is resonance-stabilized even after decarboxylation takes place (Nadler and Rappoport Citation1987). On the other hand, hydroxyl-containing diacids (hydroxy acids such as malic acid and tartaric acid) undergo dehydration. Results from the previous study supported that hydroxyl-containing dicarboxylic acids undergo dehydration (Moldoveanu Citation2010). Specifically, it has been reported that -hydroxy acids like malic acid commonly undergo 1) dehydration creating unsaturated acids or 2) simultaneous decarboxylation and dehydration forming alkenes as a common decomposition pathway. Only the first pathway is observed in our study, and this could be due to the selectivity of the iodide reagent ion. Also, Moldoveanu (Citation2010) stated that tartaric acid, a carboxylic acid with two hydroxyl groups, undergoes dehydration upon heating to around 200 °C, forming oxaloacetic acid.
Ketodicarboxylic acids such as oxaloacetic acid are present in marine aerosol (Gowda, Kawamura, and Tachibana Citation2016). Malic acid is a hydroxy acid originating dominantly from biogenic sources and abundantly detected in urban and remote settings (Chen et al. Citation2020; Röhrl and Lammel Citation2002). Malic acid is present in marine environments as well (Kawamura and Sakaguchi Citation1999). Also, tartaric acid, another hydroxy acid tested, is identified in continental aerosol (both in rural and urban locations) although it exists at a level of background concentration (Röhrl and Lammel Citation2002). Moreover, it would be difficult to discern whether C4-acids (e.g., tartaric acid, malic acid) are parental or decomposition products. For instance, Ylisirniö et al. (Citation2020) categorized extremely low volatility organic compounds with 3 to 7 carbons and 3 to 7 oxygens as products of thermal decomposition. Therefore, when FIGAERO-CIMS is deployed in field studies at marine and continental sites, careful attention must be given to the possibility of thermal decomposition of these keto-dicarboxylic acids (decarboxylation) and hydroxy acids (dehydration) and to discern whether C4-acids are actual compounds present at the site or thermal decomposition products.
Group 2: Compounds with the same functional groups but with differing numbers of carbon
Group 2 compounds possess two carboxyl groups on each end and one carbonyl attached to the center carbon. However, the number of backbone carbons differs with the maximum being 9 carbons (5-oxoazelaic acid), descending to 7 carbons (4-oxoheptanedioic acid), and 5 carbons (1,3-acetonedicarboxylic acid). As the number of carbon decreases, there is an increase in the proximity of carbonyl groups in mono-substituted dicarboxylic acids, and the degree of thermal decomposition increases. Negligible dehydration (only ∼2% of the parental compounds) is observed for 5-oxoazaleic and 4-oxoheptanedioaic acids, whereas 1,3-acetonedicarboxylic acid undergoes a considerable amount of decarboxylation (∼50% of the parental compound).
1,3-acetonedicarboxylic acid is the only compound in this group that undergoes decarboxylation. Just like oxaloacetic acid, 1,3-acetonedicarboxylic acid also contains β-keto-carboxylic acid. Our finding reconfirms that compounds containing β-keto-carboxylic acid favor decarboxylation over dehydration (Chattopadhyay and Ziemann Citation2005). Another notable point is that Group 2 results are generally consistent with those from a previous study about the relationship between the structure of chemical compounds and their vapor pressures. Chattopadhyay and Ziemann (Citation2005) demonstrated that for mono-substituted diacids, adding a carbonyl group at a more distant place from carboxylic acids decreases the vapor pressure of a compound. Since vapor pressure and Tmax are inversely related (Chattopadhyay and Ziemann Citation2005; Stark et al. Citation2017), we evaluate if a similar pattern exists between Tmax and the structure of the mono-substituted diacids. Tmax of all compounds is shown in Table S1. Specifically, Tmax of 1,3-acetonedicarboxylic acid, 4-oxoheptanediodic acid, and 5-oxoazaleic acid is 72 °C, 88 °C, and 86 °C, respectively. Although such a pattern is not prominent between 4-oxoheptanediodic and 5-oxoazaleic acid, the Tmax increases from 1,3-acetonedicarboxylic acid to 4-oxoheptanediodic acid which is in line with previous studies (Chattopadhyay and Ziemann Citation2005). Such a pattern may not be evident between 4-oxoheptanediodic acid and 5-oxoazaleic acid as their O:C ratios do not vary much from each other (| = 0.15) as it does for 4-oxoheptanedioic acid and 1,3-acetonedicarboxylic acid (|
| = 0.29). As volatility and O:C ratio is generally inversely correlated (Jimenez et al. Citation2009), the difference in O:C ratio between 4-oxoheptanediodic and 5-oxoazaleic acid might not have been substantial enough to exhibit a large difference in volatility values, leading to similar Tmax values.
Group 3A: Linear and ring-containing polyacids
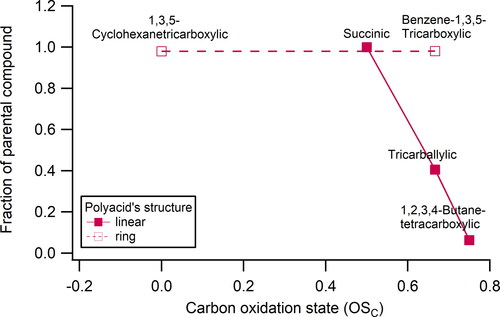
The first comparison for compounds in Group 3 is the difference between linear and ring-structured compounds containing solely carboxyl groups. depicts the result of the fraction of the parental compound vs. OSC of polyacids. This figure exhibits that the linearly structured polyacids decompose more as OSC increases, consistent with previous studies stating that more-oxidized compounds are more susceptible to thermal decomposition (Canagaratna et al. Citation2015; Yatavelli et al. Citation2014). On the other hand, for the ring-containing compounds, both compounds barely decompose (<2% thermal decomposition) despite an increase in OSC. This result is consistent with the assertion in the previous section that the degree of thermal decomposition also varies with the structure (i.e., ring vs. linear) of a compound.
Figure 7. Fraction of parental compound detected by FIGAERO-CIMS after desorption process vs. the carbon oxidation state of polyacids. Note: succinic acid (diacid) is not classified as polyacid but added in this figure as it shows the effect of adding more acids to the diacid.
Group 3B: The effect of adding hydroxyl group to linearly structured polyacids
The second investigation in Group 3 is to test the effect of an additional hydroxyl-group on the tricarballylic acid (tricarballylic acid vs. citric acid, compound J vs. L). Tricarballylic acid contains purely three carboxyl groups, whereas citric acid is mono-substituted with a hydroxyl group in addition to three carboxyl groups. Both compounds have six carbons, so the only difference is the presence of a hydroxyl-group in citric acid. The result exhibits that tricarballylic acid undergoes exclusively dehydration whereas citric acid decomposes to primary dehydration product (C6H6O6) and that the first dehydrated compound either undergoes decarboxylation (C5H6O4) or dehydration (C6H4O5). This is consistent with the previously proposed thermal decomposition mechanism for citric acid (Apelblat Citation2014; Labet and Thielemans Citation2012). Citric acid undergoing dehydration is also consistent with Group 1 finding in that hydroxyl-containing compounds undergo the dehydration pathway.
It should be noted that the only compounds that undergo decarboxylation in Group 3 are citric acid and benzene-1,3,5-tricarboxylic acid. For citric acid, decarboxylation is possible since β, γ-unsaturated aconitic acid is capable of forming a stable 6-membered ring (Bigley and Clarke Citation1982). Such finding is in accord with Group 1 observation. For carboxyl-containing aromatic compounds, a previous study found that when the steric condition is favorable (e.g., 1,2-benzenedicarboxylic acid and 1,2,3-tricarboxylic acid), dehydration is favored to form an anhydride, and when the steric condition is unfavorable (e.g., 1.3-benzenedicarboxylic acid), decarboxylation takes place (Moldeveanu 2010). Since benzene-1,3,5-tricarboxylic acid’s steric condition is not favorable, it undergoes decarboxylation.
Group 4: Hydroxyl-containing compounds
The first comparison group of Group 4 is composed of three polyalcohols with differing OSC, including meso-erythritol, xylitol, and mannitol. In general, the degree of decomposition (parental compound left: 98%) is minuscule for these three polyalcohols without noticeable differences.
The second comparison is between pure hydroxyl-containing compounds and sucrose, which has both acetal and hydroxyl groups. Pure alcohols retain greater than 98% of the parental compound on average, but for sucrose, only about 6% is detected as the parental compound. In , the decomposition product of sucrose is classified as “other” as it undergoes atypical thermal decomposition. Its acetal bond breaks and the product subsequently undergoes dehydration to form levoglucosan. Consequently, the presence of other functional groups (e.g., acetal) in addition to alcohol appears to enhance the degree of thermal decomposition. A previous study found that acetal oligomers with alkyl-groups attached do not decompose during the desorption process (Claflin and Ziemann Citation2019). This study shows that if a hydroxyl-group is added to acetal-containing compounds, substantial decomposition can take place.
Previous studies asserted that highly functionalized molecules are more susceptible to thermal decomposition during the heating process (Canagaratna et al. Citation2015; Stark et al. Citation2017). However, our finding in Group 4 demonstrates that even alcohols containing up to 6 hydroxyl groups (e.g., mannitol) experience minor thermal decomposition. A significant amount of thermal decomposition occurs only when acetal is added to hydroxyl-containing compounds (e.g., sucrose). This result highlights that the types and number of functional groups attached in addition to the oxidation state are important in determining the degree of thermal decomposition.
Impact of thermal decomposition on measured bulk SOA properties and evaluation of ambient data
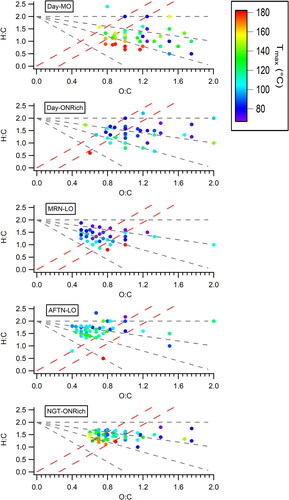
Since thermal decomposition affects the relative fraction of compounds measured, bulk SOA properties such as O:C and H:C ratios could be subjected to systematic bias. To quantify how much variation one can expect between measured and true bulk SOA properties, the bias is calculated for each compound (Table S2). The bias (%) is defined as the measured value minus true value divided by true value and is calculated for O:C ratio, H:C ratio, and OSC. Combining the result of such bias and the classification of the compounds as LO-OOA, OOA, or MO-OOA (), the following observations are made. Compounds categorized as LO-OOA do not undergo thermal decomposition. These compounds belong to polyalcohols, monoacids, and diacids, and the biases of their elemental ratios are 0%. It should be noted that based on results from this study alone, we cannot conclude that the thermal decomposition would be negligible if FIGAERO-CIMS is deployed in an environment mostly composed of LO-OOA, as LO-OOA that are polyacids and multifunctional acids are not tested. However, for compounds categorized as MO-OOA or OOA, the degree of thermal decomposition and bias vary. The average O:C and H:C biases are higher for compounds classified as MO-OOA (bias of O:C = −3.4%, H:C = −2.9%, OSC = −4.0%) as compared to those compounds categorized as OOA (bias of O:C = −0.3%, H:C = −0.2%, OSC = 0.2%). The degree of biases varies substantially for compounds in the MO-OOA category. For instance, benzene-1,3,5-tricarboxylic acid and tricarballylic acid both have the same number of carbon (nC = 9), OSC value (OSC = 0.67), and they are classified as MO-OOA, but tricarballylic acid undergoes considerable dehydration process (bias of O:C = −9.8%, H:C = −14.9%, OSC = 0.3%) whereas benzene-1,3,5-tricarboxylic acid undergoes minor decarboxylation (bias of O:C = −0.4%, H:C = 0.2%, OSC = −1.1%). The observed range of biases of compounds classified as MO-OOA spans from −13.5% to 0% for O:C ratio, −21.8% to 11.4% for H:C ratio, and −45.4% to 0.3% for OSC and those of OOA ranges from −0.4% to −0.2% for O:C ratio, −0.3% to −0.1% for H:C ratio, and 0% to 0.5% for OSC. This shows that the measured elemental ratios by FIGAERO-CIMS in an environment rich with MO-OOA and OOA can be potentially underestimated except for the H:C ratio of MO-OOA which can be either under- or over-estimated.
The impact of thermal decomposition can be observed in actual field data. shows the Van Krevelen diagram of five FIGAERO-CIMS OA factors deconvolved by PMF reported in Chen et al. (Citation2020). Data points shown for each factor correspond to the masses with enhanced signals compared to the average mass spectrum. The Day-MO factor, representative of the AMS MO-OOA factor, contains many compounds below the cutline of OSC = 0, whereas the MRN-LO and AFTN-LO factors, representative of the AMS LO-OOA factor, are dominated by those above the line of OSC = −0.5. This suggests that the categorization of the standard compounds used in this study is appropriate. Moreover, the presence of a greater number of compounds with higher Tmax in the Day-MO factor than in the MRN-LO and AFTN-LO factors indicates that there may be more compounds prone to thermal decomposition in the MO-OOA factor, which is consistent with our result. However, this does not necessarily entail that the compounds identified as LO-OOA do not experience thermal decomposition. For instance, for the AFTN-LO factor, many compounds that reside above the OSC = 0 line have Tmax ranging from 100 to 140 C (100
C
Tmax
140
C). As results from our tested standard compounds show that considerable thermal decomposition could take place for compounds with Tmax
72
C, those compounds shall be carefully evaluated for potential thermal decomposition. This is when the screening criteria may become useful for the users. As an example, one compound (C5H8O6) is selected from the AFTN-LO factor as it meets the screening criteria. To check for the presence of thermal decomposition, the thermogram is plotted for the parental compound (C5H8O6) and possibly its decarboxylation product (C4H8O4) (Figure S3). As the figure shows, the suspected decarboxylation product has a Tmax higher than that of C5H8O6. A smaller compound having a higher Tmax indicates that C4H8O4 may be a decomposition product rather than an actual compound present in the field. The distance of Tmax between C5H8O6 and C4H8O4 is about 10
C, and such a distance between the parental compound and its decarboxylation product is consistently observed in tested standards that exclusively undergo decarboxylation (e.g., oxaloacetic acid and benzene-1,3,5-tricarboxylic acid). Also, it is noted that C5H8O6 itself could already be a thermal decomposition product of a larger compound as its thermogram exhibits a broad tailing (Buchholz et al. Citation2020; Schobesberger et al. Citation2018). By employing the screening criteria to identify a compound that may undergo considerable thermal decomposition, two compounds that could be the artifacts of thermal decomposition were identified. This example illustrates how the screening criteria proposed in this work combined with thermogram data can be employed as practical and useful tools to examine the presence of thermal decomposition in the ambient datasets.
Figure 8. Van Krevelen diagrams of the average mass spectra of each OA factor resolved by PMF analysis of FIGAERO-CIMS data acquired at a field campaign in Yorkville, GA (Chen et al. Citation2020). The data points are colored by Tmax. The five factors are daytime more oxidized (Day-MO), daytime organic-nitrate-rich (Day-ONRich), morning less oxidized (MRN-LO), afternoon less oxidized (AFTN-LO), and nighttime organic-nitrate-rich (NGT-ONRich).
Effect of ramping rate on thermal decomposition
The ramping rate is an important parameter in the experimental setting. The recommended empirically determined ramping rate of FIGAERO-CIMS is 10 − 50 C min−1 (Lopez-Hilfiker et al. Citation2014). In this work, we investigate the effect of three different ramping rates (40, 13.3, and 3.3
C min−1) on thermal decomposition behavior using citric acid.
The effect of ramping rate on the degree of thermal decomposition is investigated to evaluate which ramping rate results in the least thermal decomposition of the chemical compounds. Next, the effect of ramping rate on the Tmax is identified, as it is an important parameter often used to estimate the vapor pressure of a chemical compound (Bannan et al. Citation2019; D'Ambro et al. Citation2017; Lopez-Hilfiker et al. Citation2014, Citation2016). Previously, Ylisirniö et al. (Citation2021) examined the effect of two ramping rates (11.4 C min−1 and 6.3
C min−1) on Tmax of polyethylene glycols and showed that Tmax for the faster ramping rate experiment is 5
C higher. We aim to evaluate whether a similar pattern is observed using three distinctive ramping rates on citric acid. Lastly, sensitivity is selected as another parameter to evaluate whether a certain ramping rate can optimize the sensitivity of FIGAERO-CIMS toward the chemical compounds.
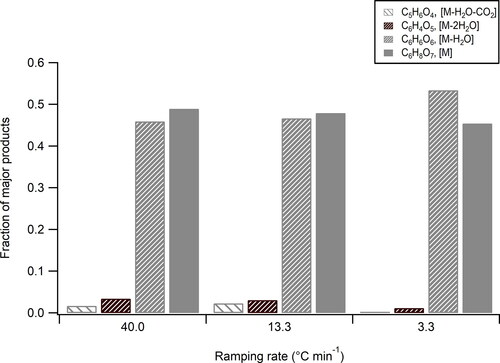
depicts the measured fraction of four species (C6H8O7 (parental compound), C6H6O6 (primary dehydration product), C6H4O5 (secondary dehydration product), and C5H6O4 (decarboxylation product of primary dehydration product)) at three distinctive ramping rates. Ramping rates of 40 C min−1 (fastest ramping rate) and 13.3
C min−1 (normal ramping rate) lead to a similar degree of thermal decomposition, where 51% and 51.3% of the parental compound decomposes, respectively. Both ramping rates result in the same decomposition products as discussed earlier, where the major decomposed product is the 1st dehydration product with minor products from its further dehydration and decarboxylation. On the other hand, for a ramping rate of 3.3
C min−1 (slowest ramping rate), a slightly higher degree (54.6%) of the parental compound decomposes. Also, there is a smaller number of products formed after the desorption process, in that it creates only the primary and secondary dehydration products with no decarboxylation product. Concerning the relationship between the ramping rate and the degree of thermal decomposition, a previous study using FIGAERO-CIMS to study organosulfates identified the degree of fragmentation of the compound to be positively correlated with the ramping rate (Le Breton et al. Citation2018). However, our study finds that although minuscule, the faster ramping rate leads to the least decomposition of the parental compound yet a larger number of decomposed products. These different observations could arise from the different compounds tested in the two studies. Future studies with additional compounds at different ramping rates are warranted to obtain further insights into the relationship between the degree of thermal decomposition and ramping rate.
Figure 9. Fraction of four species (C6H8O7 (parental compounds denoted as M), C6H6O6 (primary dehydration product), C6H4O5 (secondary dehydration product), and C5H6O4 (decarboxylation product of primary dehydration product)) for ramping rate of 3.3 C min−1, 13.3
C min−1, and 40
C min−1.
A previous study on FIGAERO-CIMS thermal decomposition using citric acid found that up to about 65% of the standard undergoes thermal decomposition for a ramping rate of 20 C min−1 (Stark et al. Citation2017), whereas in this study about 51% of the citric acid undergoes thermal decomposition for the ramping rates of 13.3 and 40
C min−1. A potential reason for such discrepancy is the difference in methods used for calculating the extent of decomposition. Stark et al. (Citation2017) measured CO, CO2, and H2O as decomposed products to estimate the decomposition of citric acid. On the other hand, our study relies on the ratio of the signals of organic moiety as decomposed products to citric acid to quantify the degree of thermal decomposition. As noted earlier, the instrument sensitivity could differ between a parental compound and its decomposition products. In particular, I-CIMS is known to be sensitive toward polar organic compounds, and its sensitivity could vary by up to several orders of magnitude (Aljawhary, Lee, and Abbatt Citation2013; Lee et al. Citation2014). Since decomposition products contain a smaller number of polar functional groups, their sensitivity is expected to be lower, and thus their abundance may be underestimated. Therefore, it is reasonable that the estimation of thermal decomposition degree in this study is slightly less than that in Stark et al. (Citation2017).
presents the thermograms of citric acid obtained using ramping rates of 4013.3, and 3.3
C min−1. Table S3 presents the integrated signals for three ramping rates. The broad tails and peaks of decomposition products across all ramping rates in the thermograms are consistent with the previous finding that such features are evidence of artificially created products (Schobesberger et al. Citation2018). Similar to the result for the degree of thermal decomposition, ramping rates of 40 and 13.3
C min−1 both demonstrate similar thermograms in terms of peak shape. A previous study on FIGAERO-CIMS recommends a ramping rate between 10 and 50
C min−1 as it balances well between the S/N ratio and resolution (Lopez-Hilfiker et al. Citation2014). The faster ramping rate is known for amplifying the S/N ratio and the slower ramping rate is better at separating compounds in the volatility space. As shown in , a thermogram of 40 °C min−1 exhibits the least noise and that of 3.3 °C min−1 demonstrates the most noise. In terms of the separation of compounds in the volatility space, the fastest ramping rate shows the widest peak width, whereas the slowest ramping rate exhibits the narrowest peak width. So, the resolution is indeed better at the slowest ramping rate and vice versa. However, it should be noted that the
Tmax between primary dehydration product and citric acid is 33 °C and
Tmax between secondary dehydration product and citric acid is 46 °C for both the fastest and the normal ramping rate. On the other hand, those of the slowest ramping rate are 31 °C and 34 °C, respectively. Taken together, although resolution gets better with a slow ramping rate,
Tmax also gets smaller, which offsets the better resolution in terms of separating compounds by volatility. Therefore, we conclude that there is little benefit to using the slowest ramping rate.
Figure 10. Thermal desorption profiles (thermograms) of citric acid for ramping rate of (a) 40 C min−1, (b) 13.3
C min−1, and (c) 3.3
C min−1.
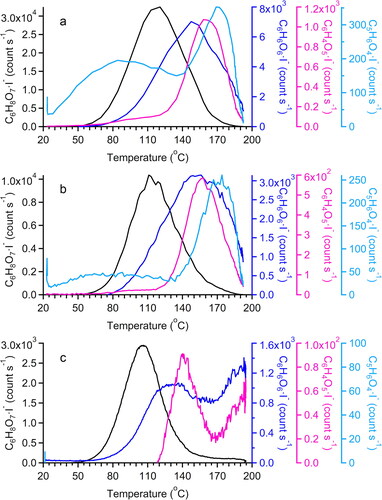
It should be noted that the fronting of C5H6O4 in the thermograms of the fastest and the normal ramping rates may be due to contamination (i.e., decomposition of the leftover compound (C6H6O6) from the preceding experiments). Moreover, it is worth noting that the thermogram obtained for the slowest ramping rate exhibits tailing for two thermal decomposition products (e.g., C6H6O6 and C6H4O5). According to Thornton et al. (Citation2020), tailing refers to when more signal than expected is detected after Tmax. The same study explained that tailing can be caused by desorbed vapors interacting with the instrument’s surface. Therefore, we postulate that the desorbed vapors get transported to the instrument’s surface during the slowest ramping rate experiment, leading to a unique interaction with the metal surface and causing tailing to appear in the thermogram.
depicts the Tmax of the major decomposition products for each ramping rate. The result demonstrates that the Tmax of citric acid and its thermally decomposed products are all different depending on the ramping rate. Again, Tmax for the fastest and the normal ramping rates are relatively similar, but those with the slowest rate are distinctive from others. Generally, as the ramping rate decreases, the Tmax of decomposition products decreases, consistent with a prior study (Ylisirniö et al. Citation2021). Therefore, the Tmax across different studies cannot be directly compared since a variety of factors, including the FIGAERO-CIMS ramping rate, affect the desorption temperature. In general, calibration measurements using compounds with known volatilities and low thermal decomposition to achieve a volatility scale should be performed when comparison to other studies is desired. The effect of ramping rate on instrument sensitivity is also evaluated. In this study, the cps normalized to the sum of I- and H2OI- divided by the amount of standard deposited onto the filter in parts per trillion (ppt) is defined as sensitivity.
Table 3. Tmax of citric acid (C6H8O7), its primary dehydration product (C6H6O6), secondary dehydration product (C6H4O5), and decarboxylation product of its primary dehydration product (C5H6O4).
The sensitivity of FIGAERO-CIMS instrument is consistent across different ramping rates, with the parental compound of the fastest ramping rate having the sensitivity of 6.61 (0.44) cps ppt−1, the normal ramping rate with 6.13 (
0.81) cps ppt−1, and the slowest ramping rate with 5.95 (
0.59) cps ppt−1. The sensitivities are relatively similar to each other when uncertainty is taken into account. This level of uncertainty is also observed in a study that used FIGAERO-CIMS (Lee et al. Citation2014).
In summary, 40 °C min−1 behaves similarly to 13.3 °C min−1. Therefore, if time resolution is a priority during deployments, 40 °C min−1 can be used instead of 13.3 °C min−1. 3.3 °C min−1 behaves distinctively from the other two ramping rates with the most parental compound decomposition. Hence, our results provide additional support to the recommended 10–50 °C min−1 ramping rate. Lastly, a recent study identified that Tmax values can differ up to 15 C between syringe deposition and using atomized calibration compounds (Ylisirniö et al. Citation2021). For future work, it would be valuable to explore whether the degree and pathway of thermal decomposition differ when particles are generated from the analyte solution utilizing a nebulizer and then collected on the filter.
Summary
We characterize the thermal decomposition degree and pathways (decarboxylation and dehydration) of atmospherically relevant oxygenated organic compounds containing carbonyl, carboxyl, hydroxyl, and acetal groups in FIGAERO-CIMS. Monoacids and diacids do not undergo thermal decomposition, whereas polyacids and multifunctional acids undergo thermal decomposition. These findings suggest that the number and types of functional groups are important determinants for thermal decomposition.
We parametrize the thermal decomposition behaviors of 29 oxygenated organic compounds with parameters (e.g., nC, nH, nO, DBE, MW, Tmax) that can be readily obtained from mass spectra and thermogram results of FIGAERO-CIMS. The nO, DBE, and Tmax are found to be determining factors that distinguish compounds that undergo considerable (parental compound left: 40–50%) to significant (parental compound left: 0–10%) thermal decomposition from compounds that undergo minor thermal decomposition. The nO has to be greater than 4 (nO > 4) for considerable and greater than 7 (nO > 7) for significant thermal decomposition to take place. Compounds that undergo considerable to significant thermal decompositions have DBE between 2 and 4. Lastly, compounds with Tmax as low as 72 C can undergo considerable thermal decomposition (Tmax
72
C) and Tmax is higher for the ones undergoing significant thermal decomposition (Tmax
147
C). When FIGAERO-CIMS is deployed in a field or laboratory setting, we suggest using such nO, DBE, and Tmax information as the screening criteria to identify compounds that may possibly undergo considerable to significant thermal decomposition. After identifying compounds that meet the screening criteria for considerable thermal decomposition (DBE
2, Tmax
72
C, and nO > 4), then one can further investigate thermograms (e.g., presence of bimodal peaks, broad tailing, and fronting) of decomposition products to confirm the presence of thermal decomposition.
To gain further insights, we investigate the effect of the degree of oxidation of compounds on thermal decomposition and biases in the elemental composition, where the compounds are categorized as LO-OOA, OOA, or MO-OOA depending on their OSC. It should be noted that the tested compounds categorized as LO-OOA in this work exclusively belong to polyalcohols, monoacids, and diacids. Future studies investigating LO-OOA that are polyacids and multifunctional acids are warranted to further characterize the thermal decomposition behavior of LO-OOA. Compounds categorized as LO-OOA do not experience thermal decomposition (average biases of O:C, H:C = 0%), those categorized as OOA experience minor thermal decomposition (average biases of O:C = −0.3%, H:C = −0.2%) and compounds classified as MO-OOA undergo most thermal decomposition (average biases of O:C = −3.4% %, H:C = −2.9%). It is noted that OOA’s O:C and H:C ratios and MO-OOA’s O:C ratio are underestimated whereas MO-OOA’s H:C ratio can be either under- or over-estimated for the standard compounds tested. Hence, when analyzing FIGAERO-CIMS data taken from field sites where MO-OOA is abundant, the user shall carefully scrutinize the data for the possibility of thermal decomposition and evaluate its impacts on the measured elemental ratios.
In terms of the thermal decomposition pathway, most of the tested standard compounds undergo dehydration. We identified two cases of compounds that favor decarboxylation over dehydration: 1) -keto-carboxylic acid (e.g., oxaloacetic acid and 1.3-acetonedicarboxylic acid), and 2) carboxyl-containing aromatic compound with an unfavorable steric condition (e.g., benzene-1,3,5-tricarboxylic acid). Therefore, we conclude that whether a compound undergoes decarboxylation vs. dehydration depends on the structure and steric condition of the chemical compound.
Lastly, we evaluate the effect of ramping rate on the degree of thermal decomposition, Tmax, and instrument sensitivity. The sensitivity of the instrument is similar across these three different ramping rates. 40 C min−1 behaves very closely to 13.3
C min−1, with similar Tmax values and degree of thermal decomposition. Thus, if a shorter runtime of FIGAERO-CIMS is desired during deployments, 40
C min−1 can be used instead of 13.3
C min−1. On the other hand, the result for 3.3
C min−1 is distinctive from the two other ramping rates (e.g., decomposition products and Tmax) and it leads to the most thermal decomposition of the parental compound. Therefore, we do not recommend the 3.3
C min−1 ramping rate. Taken together, comparisons of results among different FIGAERO-CIMS studies with different instrument settings should be conducted with care.
Supplemental Material
Download MS Word (618 KB)Acknowledgment
The authors thank M. Canagaratna for helpful discussions.
Additional information
Funding
References
- Aljawhary, D., A. K. Y. Lee, and J. P. D. Abbatt. 2013. High-resolution chemical ionization mass spectrometry (ToF-CIMS): Application to study SOA composition and processing. Atmos. Meas. Techl. 6 (11):3211–24. doi:10.5194/amt-6-3211-2013.
- Apelblat, A. 2014. Citric acid. New York: Springer.
- Bannan, T. J., M. L. Breton, M. Priestley, S. D. Worrall, A. Bacak, N. A. Marsden, A. Mehra, J. Hammes, M. Hallquist, M. R. Alfarra, et al. 2019. A method for extracting calibrated volatility information from the FIGAERO-HR-ToF-CIMS and its experimental application. Atmos. Meas. Tech. 12 (3):1429–39. doi:10.5194/amt-12-1429-2019.
- Bertram, T. H., J. R. Kimmel, T. A. Crisp, O. S. Ryder, R. L. N. Yatavelli, J. A. Thornton, M. J. Cubison, M. Gonin, and D. R. Worsnop. 2011. A field-deployable, chemical ionization time-of-flight mass spectrometer. Atmos. Meas. Tech. 4 (7):1471–9. doi:10.5194/amt-4-1471-2011.
- Bigley, D. B., and M. J. Clarke. 1982. Studies in decarboxylation. Part 14. The gas-phase decarboxylation of but-3-enoic acid and the intermediacy of isocrotonic (cis-but-2-enoic) acid in its isomerization to crotonic (trans-but-2-enoic) acid. J. Chem. Soc., Perkin Trans. 2. 2 (1):1–6. doi:10.1039/p29820000001.
- Buchholz, A., A. Ylisirniö, W. Huang, C. Mohr, M. Canagaratna, D. Worsnop, S. Schobesberger, and A. Virtanen. 2020. Deconvolution of FIGAERO-CIMS thermal desorption profiles using positive matrix factorization to identify chemical and physical processes during particle evaporation. Atmos. Chem. Phys. 20 (13):7693–716. doi:10.5194/acp-20-7693-2020.
- Canagaratna, M. R., J. L. Jimenez, J. H. Kroll, Q. Chen, S. H. Kessler, P. Massoli, L. Hildebrandt Ruiz, E. Fortner, L. R. Williams, K. R. Wilson, et al. 2015. Elemental ratio measurements of organic compounds using aerosol mass spectrometry: Characterization, improved calibration, and implications. Atmos. Chem. Phys. 15 (1):253–72. doi:10.5194/acp-15-253-2015.
- Chattopadhyay, S., and P. J. Ziemann. 2005. Vapor pressures of substituted and unsubstituted monocarboxylic and dicarboxylic acids measured using an improved thermal desorption particle beam mass spectrometry method. Aerosol Sci. Technol 39 (11):1085–100. doi:10.1080/02786820500421547.
- Chen, Y., M. Takeuchi, T. Nah, L. Xu, M. R. Canagaratna, H. Stark, K. Baumann, F. Canonaco, A. S. H. Prévôt, L. G. Huey, et al. 2020. Chemical characterization of secondary organic aerosol at a rural site in the southeastern US: Insights from simultaneous high-resolution time-of-flight aerosol mass spectrometer (HR-ToF-AMS) and FIGAERO chemical ionization mass spectrometer (CIMS) measur. Atmos. Chem. Phys. 20 (14):8421–40. doi:10.5194/acp-20-8421-2020.
- Chhabra, P. S., N. L. Ng, M. R. Canagaratna, A. L. Corrigan, L. M. Russell, D. R. Worsnop, R. C. Flagan, and J. H. Seinfeld. 2011. Elemental composition and oxidation of chamber organic aerosol. Atmos. Chem. Phys. 11 (17):8827–45. doi:10.5194/acp-11-8827-2011.
- Claflin, M. S., and P. J. Ziemann. 2019. Thermal desorption behavior of hemiacetal, acetal, ether, and ester oligomers. Aerosol Sci. Technol. 53 (4):473–84. doi:10.1080/02786826.2019.1576853.
- D’Ambro, E. L., B. H. Lee, J. Liu, J. E. Shilling, C. J. Gaston, F. D. Lopez-Hilfiker, S. Schobesberger, R. A. Zaveri, C. Mohr, A. Lutz, et al. 2017. Molecular composition and volatility of isoprene photochemical oxidation secondary organic aerosol under low- and high-NOx conditions. Atmos. Chem. Phys. 17 (1):159–74. doi:10.5194/acp-17-159-2017.
- D’Ambro, E. L., S. Schobesberger, C. J. Gaston, F. D. Lopez-Hilfiker, B. H. Lee, J. Liu, A. Zelenyuk, D. Bell, C. D. Cappa, T. Helgestad, et al. 2019. Chamber-based insights into the factors controlling epoxydiol (IEPOX) secondary organic aerosol (SOA) yield, composition, and volatility. Atmos. Chem. Phys. 19 (17):11253–65. doi:10.5194/acp-19-11253-2019.
- Dillner, A. M., and S. Takahama. 2015. Predicting ambient aerosol thermal-optical reflectance (TOR) measurements from infrared spectra: Organic carbon. Atmos. Meas. Tech. 8 (3):1097–109. doi:10.5194/amt-8-1097-2015.
- Ditto, J. C., E. B. Barnes, P. Khare, M. Takeuchi, T. Joo, A. A. T. Bui, J. Lee-Taylor, G. Eris, Y. Chen, B. Aumont, et al. 2018. An omnipresent diversity and variability in the chemical composition of atmospheric functionalized organic aerosol. Commun. Chem. 1 (1):1–13.
- Gelles, E. 1956. 925. Kinetics of the decarboxylation of oxaloacetic acid. J. Chem. Soc. 4736–9. doi:10.1039/jr9560004736.
- Gowda, D., K. Kawamura, and E. Tachibana. 2016. Identification of hydroxy- and keto-dicarboxylic acids in remote marine aerosols using gas chromatography/quadruple and time-of-flight mass spectrometry. Rapid Commun. Mass Spectrom. 30 (7):992–1000. doi:10.1002/rcm.7527.
- Hammes, J., A. Lutz, T. Mentel, C. Faxon, and M. Hallquist. 2019. Carboxylic acids from limonene oxidation by ozone and hydroxyl radicals: Insights into mechanisms derived using a FIGAERO-CIMS. Atmos. Chem. Phys. 19 (20):13037–52. doi:10.5194/acp-19-13037-2019.
- Heald, C. L., J. H. Kroll, J. L. Jimenez, K. S. Docherty, P. F. DeCarlo, A. C. Aiken, Q. Chen, S. T. Martin, D. K. Farmer, and P. Artaxo. 2010. A simplified description of the evolution of organic aerosol composition in the atmosphere. Geophys. Res. Lett. 37 (8):L08803. doi:10.1029/2010GL042737.
- Hearn, J. D., and G. D. Smith. 2004. A chemical ionization mass spectrometry method for the online analysis of organic aerosols. Anal. Chem. 76 (10):2820–6. doi:10.1021/ac049948s.
- Huang, W., H. Saathoff, A. Pajunoja, X. Shen, K. H. Naumann, R. Wagner, A. Virtanen, T. Leisner, and C. Mohr. 2018. α-Pinene secondary organic aerosol at low temperature: chemical composition and implications for particle viscosity. Atmos. Chem. Phys. 18 (4):2883–98. doi:10.5194/acp-18-2883-2018.
- Huey, L. G., D. R. Hanson, and C. J. Howard. 1995. Reactions of SF6- and I- with atmospheric trace gases. J. Phys. Chem. 99 (14):5001–8. doi:10.1021/j100014a021.
- Jimenez, J. L., M. R. Canagaratna, N. M. Donahue, A. S. H. Prevot, Q. Zhang, J. H. Kroll, P. F. DeCarlo, J. D. Allan, H. Coe, N. L. Ng, et al. 2009. Evolution of organic aerosols in the atmosphere. Science 326 (5959):1525–9. doi:10.1126/science.1180353.
- Joo, T., J. C. Rivera-Rios, M. Takeuchi, M. J. Alvarado, and N. L. Ng. 2019. Secondary organic aerosol formation from reaction of 3-methylfuran with nitrate radicals. ACS Earth Space Chem. 3 (6):922–34. doi:10.1021/acsearthspacechem.9b00068.
- Kawamura, K., and F. Sakaguchi. 1999. Molecular distributions of water soluble dicarboxylic acids in marine aerosols over the Pacific Ocean including tropics. J. Geophys. Res. 104 (D3):3501–9. doi:10.1029/1998JD100041.
- Kercher, J. P., T. P. Riedel, and J. A. Thornton. 2009. Chlorine activation by N2O5: Simultaneous, in situ detection of ClNO2 and N2O5 by chemical ionization mass spectrometry. Atmos. Meas. Tech. 2 (1):193–204. doi:10.5194/amt-2-193-2009.
- Kroll, J. H., N. M. Donahue, J. L. Jimenez, S. H. Kessler, M. R. Canagaratna, K. R. Wilson, K. E. Altieri, L. R. Mazzoleni, A. S. Wozniak, H. Bluhm, et al. 2011. Carbon oxidation state as a metric for describing the chemistry of atmospheric organic aerosol. Nat. Chem. 3 (2):133–9. doi:10.1038/nchem.948.
- Labet, M., and W. Thielemans. 2012. Citric acid as a benign alternative to metal catalysts for the production of cellulose-grafted-polycaprolactone copolymers. Polym. Chem. 3 (3):679–84. doi:10.1039/c2py00493c.
- Le Breton, M., M. Psichoudaki, M. Hallquist, K. Watne, A. Lutz, and M. Hallquist. 2019. Application of a FIGAERO ToF CIMS for on-line characterization of real-world fresh and aged particle emissions from buses. Aerosol Sci. Technol. 53 (3):244–59. doi:10.1080/02786826.2019.1566592.
- Le Breton, M., Y. Wang, A. M. Hallquist, R. Kant Pathak, J. Zheng, Y. Yang, D. Shang, M. Glasius, T. J. Bannan, Q. Liu, et al. 2018. Online gas- and particle-phase measurements of organosulfates, organosulfonates and nitrooxy organosulfates in Beijing utilizing a FIGAERO ToF-CIMS. Atmos. Chem. Phys. 18 (14):10355–71. doi:10.5194/acp-18-10355-2018.
- Lee, B. H., F. D. Lopez-Hilfiker, E. L. D'Ambro, P. Zhou, M. Boy, T. Petäjä, L. Hao, A. Virtanen, and J. A. Thornton. 2018. Semi-volatile and highly oxygenated gaseous and particulate organic compounds observed above a boreal forest canopy. Atmos. Chem. Phys. 18 (15):11547–62. doi:10.5194/acp-18-11547-2018.
- Lee, B. H., F. D. Lopez-Hilfiker, C. Mohr, T. Kurtén, D. R. Worsnop, and J. A. Thornton. 2014. An iodide-adduct high-resolution time-of-flight chemical-ionization mass spectrometer: Application to atmospheric inorganic and organic compounds. Environ. Sci. Technol. 48 (11):6309–17. doi:10.1021/es500362a.
- Lee, B. H., C. Mohr, F. D. Lopez-Hilfiker, A. Lutz, M. Hallquist, L. Lee, P. Romer, R. C. Cohen, S. Iyer, T. Kurtén, et al. 2016. Highly functionalized organic nitrates in the southeast United States: Contribution to secondary organic aerosol and reactive nitrogen budgets. Proc. Natl. Acad. Sci. U S A 113 (6):1516–21. doi:10.1073/pnas.1508108113.
- Liu, X., and J. Wang. 2010. How important is organic aerosol hygroscopicity to aerosol indirect forcing? Environ. Res. Lett. 5 (4):044010. doi:10.1088/1748-9326/5/4/044010.
- Lopez-Hilfiker, F. D., C. Mohr, E. L. D’Ambro, A. Lutz, T. P. Riedel, C. J. Gaston, S. Iyer, Z. Zhang, A. Gold, J. D. Surratt, et al. 2016. Molecular composition and volatility of organic aerosol in the Southeastern U.S.: Implications for IEPOX Derived SOA. Environ. Sci. Technol. 50 (5):2200–9. doi:10.1021/acs.est.5b04769.
- Lopez-Hilfiker, F. D., C. Mohr, M. Ehn, F. Rubach, E. Kleist, J. Wildt, T. F. Mentel, A. J. Carrasquillo, K. E. Daumit, J. F. Hunter, et al. 2015. Phase partitioning and volatility of secondary organic aerosol components formed from α-pinene ozonolysis and OH oxidation: The importance of accretion products and other low volatility compounds. Atmos. Chem. Phys. 15 (14):7765–76. doi:10.5194/acp-15-7765-2015.
- Lopez-Hilfiker, F. D., C. Mohr, M. Ehn, F. Rubach, E. Kleist, J. Wildt, T. F. Mentel, A. Lutz, M. Hallquist, D. Worsnop, et al. 2014. A novel method for online analysis of gas and particle composition: Description and evaluation of a filter inlet for gases and AEROsols (FIGAERO). Atmos. Meas. Tech. 7 (4):983–1001. doi:10.5194/amt-7-983-2014.
- Mauderly, J. L., and J. C. Chow. 2008. Health effects of organic aerosols. Inhal. Toxicol. 20 (3):257–88. doi:10.1080/08958370701866008.
- McNeill, V. F., G. M. Wolfe, and J. A. Thornton. 2007. The oxidation of oleate in submicron aqueous salt aerosols: Evidence of a surface process. J. Phys. Chem. A 111 (6):1073–83. doi:10.1021/jp066233f.
- Moldoveanu, S. C. 2010. Pyrolysis of carboxylic acids. Tech. Instrum. Anal. Chem. 28:471–526. doi:10.1016/S0167-9244(09)02817-0.
- Nadler, E. B., and Z. Rappoport. 1987. Stable simple enols. Polar and resonance substituent effects of α-aryl groups on keto ⇆ enol equilibria of stable enols. J. Am. Chem. Soc. 109 (7):2112–27. doi:10.1021/ja00241a032.
- Nah, T., J. Sanchez, C. M. Boyd, and N. L. Ng. 2016. Photochemical aging of α-pinene and β-pinene secondary organic aerosol formed from nitrate radical oxidation. Environ. Sci. Technol. 50 (1):222–31. doi:10.1021/acs.est.5b04594.
- Nah, T., L. Xu, K. A. Osborne-Benthaus, S. M. White, S. France, and N. L. Ng. 2019. Mixing order of sulfate aerosols and isoprene epoxydiols affects secondary organic aerosol formation in chamber experiments. Atmos. Environ. 217:116953. doi:10.1016/j.atmosenv.2019.116953.
- Ng, N. L., M. R. Canagaratna, J. L. Jimenez, P. S. Chhabra, J. H. Seinfeld, and D. R. Worsnop. 2011. Changes in organic aerosol composition with aging inferred from aerosol mass spectra. Atmos. Chem. Phys. 11 (13):6465–74. doi:10.5194/acp-11-6465-2011.
- Ng, N. L., M. R. Canagaratna, Q. Zhang, J. L. Jimenez, J. Tian, I. M. Ulbrich, J. H. Kroll, K. S. Docherty, P. S. Chhabra, R. Bahreini, et al. 2010. Organic aerosol components observed in northern hemispheric datasets from aerosol mass spectrometry. Atmos. Chem. Phys. 10 (10):4625–41.
- Rastak, N., A. Pajunoja, J. C. Acosta Navarro, J. Ma, M. Song, D. G. Partridge, A. Kirkevåg, Y. Leong, W. W. Hu, N. F. Taylor, et al. 2017. Microphysical explanation of the RH-dependent water affinity of biogenic organic aerosol and its importance for climate. Geophys. Res. Lett. 44 (10):5167–77. doi:10.1002/2017GL073056.
- Riva, M., L. Heikkinen, D. M. Bell, O. Peräkylä, Q. Zha, S. Schallhart, M. P. Rissanen, D. Imre, T. Petäjä, J. A. Thornton, et al. 2019. Chemical transformations in monoterpene-derived organic aerosol enhanced by inorganic composition. NPJ Clim. Atmos. Sci. 2 (1):1–9.
- Röhrl, A., and G. Lammel. 2002. Determination of malic acid and other C4 dicarboxylic acids in atmospheric aerosol samples. Chemosphere 46 (8):1195–9. doi:10.1016/S0045-6535(01)00243-0.
- Schobesberger, S., E. L. D'Ambro, F. D. Lopez-Hilfiker, C. Mohr, and J. A. Thornton. 2018. A model framework to retrieve thermodynamic and kinetic properties of organic aerosol from composition-resolved thermal desorption measurements. Atmos. Chem. Phys. 18 (20):14757–85. doi:10.5194/acp-18-14757-2018.
- Seinfeld, J. H., and S. N. Pandis. 2016. Atmospheric chemistry and physics: from air pollution to climate change. New Jersey: John Wiley & Sons.
- Stark, H., R. L. N. Yatavelli, S. L. Thompson, H. Kang, J. E. Krechmer, J. R. Kimmel, B. B. Palm, W. Hu, P. L. Hayes, D. A. Day, et al. 2017. Impact of thermal decomposition on thermal desorption instruments: Advantage of thermogram analysis for quantifying volatility distributions of organic species. Environ. Sci. Technol. 51 (15):8491–500. doi:10.1021/acs.est.7b00160.
- Stark, H., R. L. N. Yatavelli, S. L. Thompson, J. R. Kimmel, M. J. Cubison, P. S. Chhabra, M. R. Canagaratna, J. T. Jayne, D. R. Worsnop, and J. L. Jimenez. 2015. Methods to extract molecular and bulk chemical information from series of complex mass spectra with limited mass resolution. Int. J. Mass Spectrom. 389:26–38. doi:10.1016/j.ijms.2015.08.011.
- Takahama, S., A. Johnson, and L. M. Russell. 2013. Quantification of carboxylic and carbonyl functional groups in organic aerosol infrared absorbance spectra. Aerosol Sci. Technol. 47 (3):310–25. doi:10.1080/02786826.2012.752065.
- Takeuchi, M., and N. L. Ng. 2019. Chemical composition and hydrolysis of organic nitrate aerosol formed from hydroxyl and nitrate radical oxidation of α-pinene and β-pinene. Atmos. Chem. Phys. 19 (19):12749–66. doi:10.5194/acp-19-12749-2019.
- Thompson, S. L., R. L. N. Yatavelli, H. Stark, J. R. Kimmel, J. E. Krechmer, D. A. Day, W. Hu, G. Isaacman-VanWertz, L. Yee, A. H. Goldstein, et al. 2017. Field intercomparison of the gas/particle partitioning of oxygenated organics during the Southern Oxidant and Aerosol Study (SOAS) in 2013. Aerosol Sci. Technol. 51 (1):30–56. doi:10.1080/02786826.2016.1254719.
- Thornton, J. A., C. Mohr, S. Schobesberger, E. L. D. Ambro, B. H. Lee, and F. D. Lopez-Hilfiker. 2020. Evaluating organic aerosol sources and evolution with a combined molecular composition and volatility framework using the Filter Inlet for Gases and Aerosols (FIGAERO). Acc. Chem. Res. 53 (8):1415–26. doi:10.1021/acs.accounts.0c00259.
- Van Krevelen, D. W. 1950. Graphical-statistical method for the study of structure and reaction processes of coal. Fuel 29:269–84.
- Wang, D. S., and L. Hildebrandt Ruiz. 2018. Chlorine-initiated oxidation of n-alkanes under high-NOx conditions: insights into secondary organic aerosol composition and volatility using a FIGAERO-CIMS. Atmos. Chem. Phys. 18 (21):15535–53. doi:10.5194/acp-18-15535-2018.
- Wang, M., D. Chen, M. Xiao, Q. Ye, D. Stolzenburg, V. Hofbauer, P. Ye, A. L. Vogel, R. L. Mauldin, III, A. Amorim, et al. 2020. Photo-oxidation of aromatic hydrocarbons produces low-volatility organic compounds. Environ. Sci. Technol. 54 (13):7911–21. doi:10.1021/acs.est.0c02100.
- Yatavelli, R. L. N., F. D. Lopez-Hilfiker, J. D. Wargo, J. R. Kimmel, M. J. Cubison, T. H. Bertram, J. L. Jimenez, M. Gonin, D. R. Worsnop, and J. A. Thornton. 2012. A chemical ionization high-resolution time-of-flight mass spectrometer coupled to a micro orifice volatilization impactor (MOVI-HRToF-CIMS) for analysis of gas and particle-phase organic species. Aerosol Sci. Technol. 46 (12):1313–27. doi:10.1080/02786826.2012.712236.
- Yatavelli, R. L. N., H. Stark, S. L. Thompson, J. R. Kimmel, M. J. Cubison, D. A. Day, P. Campuzano-Jost, B. B. Palm, and J. A. Thornton. 2014. Semi-continuous measurements of gas/particle partitioning of organic acids in a ponderosa pine forest using a MOVI-HRToF-CIMS. Atmos. Chem. Phys. 13 (6):17327–74.
- Ylisirniö, A., L. M. Barreira, I. Pullinen, A. Buchholz, J. Jayne, J. E. Krechmer, D. R. Worsnop, A. Virtanen, and S. Schobesberger. 2021. On the calibration of FIGAERO-ToF-CIMS: Importance and impact of calibrant delivery for the particle-phase calibration. Atmos. Meas. Tech. 14 (1):355–67. doi:10.5194/amt-14-355-2021.
- Ylisirniö, A., A. Buchholz, C. Mohr, Z. Li, L. Barreira, A. Lambe, C. Faiola, E. Kari, T. Yli-Juuti, S. A. Nizkorodov, et al. 2020. Composition and volatility of secondary organic aerosol (SOA) formed from oxidation of real tree emissions compared to simplified volatile organic compound (VOC) systems. Atmos. Chem. Phys. 20 (9):5629–44. doi:10.5194/acp-20-5629-2020.
- Zhang, Q., J. L. Jimenez, M. R. Canagaratna, J. D. Allan, H. Coe, I. Ulbrich, M. R. Alfarra, A. Takami, A. M. Middlebrook, Y. L. Sun, et al. 2007. Ubiquity and dominance of oxygenated species in organic aerosols in anthropogenically‐influenced Northern Hemisphere midlatitudes. Geophys. Res. Lett. 34 (13):L029979. doi:10.1029/2007GL029979.