Abstract
Red marrow dosimetry is essential during radioimmunotherapy and a reliable method is essential in order to find a measure correlated to the toxic effect observed. The aim of this study was to calculate the absorbed dose to red marrow with different methods for the same patients and to compare the results. Patients diagnosed with B-cell lymphoma were treated with 131I-labelled monoclonal antibodies (LL2, anti-CD22). Blood samples were collected, scintillation camera images were taken and single probe measurements were carried out at different points in time after administration of the radiopharmaceutical. The absorbed dose to red marrow per unit activity administered was calculated using four varieties of the blood method and from activity quantification in the sacrum in the scintillation camera images. The absorbed dose to the total body per unit activity, sometimes used as a measure for determining the toxic effect in red marrow, was calculated from both the scintillation camera images and the single probe measurements. The results from the different methods of calculating the absorbed dose for the same patient and treatment were compared. The ratio of the maximum and the minimum absorbed dose to red marrow calculated using the four variations of the blood method and the sacrum imaging method for one and the same patient varied between 1.8 and 2.8. The correlation coefficients for all the possible combinations of the dosimetry methods, including total body measurements, varied from 0.51 to 0.99. The results show that the variability of the absorbed dose to the bone marrow is dependent on both method and patient.
Bone marrow is the most radiation-sensitive tissue in the body and is usually the dose-limiting tissue during radioimmunotherapy (RIT) if stem cell support is not given. Therefore, there is a great need for a reliable method of bone marrow dosimetry, making it possible to correlate the absorbed dose to the toxic effect.
Several methods have been suggested for red marrow dosimetry. The absorbed dose to the total body is one of the measures that has been used for the prediction of bone marrow toxicity Citation[1]. Methods that directly determine the absorbed dose to red marrow should, however, give a better correlation to biologic response. The blood method is one such a method, where the absorbed dose to red marrow is based on measurements of the activity concentration in blood. The activity concentration in blood is assumed to be related to the activity concentration in red marrow by a specific factor, the red-marrow-to-blood ratio (RMBLR) Citation[2–4]. Quantification of activity in the red-marrow-rich regions, such as the sacrum or lumbar vertebrae, in scintillation camera images is another method of determining the absorbed dose to red marrow Citation[5–7].
The aim of the present investigation was to analyse the variation in the calculated absorbed dose for the methods described above in a series of B-cell lymphoma patients undergoing RIT with 131I-mouse anti-CD22-MAb (LL2) Citation[8].
Materials and methods
Patients
The study was performed on a group of patients undergoing RIT with 131I-labelled anti-CD22 (131I-LL2; Immunomedics Inc, NJ, USA) for B-cell lymphoma after failing chemotherapy Citation[8]. In total, eleven patients received RIT. Six patients received more than one course of treatment, which means that in total dosimetric calculations were performed on 18 courses of treatment.
Two patients had previously undergone high-dose chemotherapy with stem cell rescue as consolidation after second-line chemotherapy. Three had received two regimens and six only one previous regimen. All patients but one had undergone combination chemotherapy. Only one of the included patients showed bone marrow involvement (25%, as determined by biopsy, flow cytometry and immunohistochemistry). The percentage of B cells in unseparated bone marrow ranged from 1% to 9%, and four of the 11 patients had ≤2% B cells in the bone marrow. Two patients developed HAMA (production of human antibodies against mouse antibodies). Patient no. 2 was retreated a year later with the same activity and antibody. Patient no. 5 was retreated with a humanized antibody. Three patients had had previous radiotherapy in which the para-aortic nodes were included in two cases. The third patient received radiotherapy including the neck and upper mediastinum, i.e. also involving the cervical and thoracic spine. None of the patients received external radiotherapy involving the sacrum, and none had a known disease manifestation projecting over the sacrum.
Radioiodination with 131I was performed according to the iodogen method. The specific activity was approximately 370 MBq/mg antibody. High-performance liquid chromatography was used for determination of the identity of the labelled antibody as well as radiochemical purity. An additional test to determine the amount of free iodine in the radiopharmaceutical was performed using instant thin layer chromatography. The radiochemical purity should not be less than 95%.
The prescribed activity of 131I (1330 MBq/m2 body surface) was intravenously administered to all but two patients due to suboptimal labelling. These two patients received 67% of the prescribed activity. Administration of the 131I-labelled antibody was always preceded by injection of 20 mg non-radiolabelled anti-CD22 antibody. Of the eleven patients, five patients were retreated once and one patient twice. At retreatment the activity was reduced by 50% in two patients (nos 4 and 7).
Data collection
The day before the administration of 131I-anti-CD22 MAb, the patients underwent a CT scan of the abdomen and pelvis. Immediately after administration and at predefined times, the patients underwent external single probe measurements, blood sampling and scintillation camera imaging. All patients followed the same protocol for data collection. In exceptional cases, however, minor changes were necessary due to public holidays and patient compliance.
The total body clearance of the activity was measured using an external probe (an energy-compensated proportional counter, LB133, Berthold) at 5 minutes, 4, 24, 48 and 144 hours after injection. The first measurement was performed immediately after completion of the administration of the radiopharmaceutical and was used as the reference level for 100% of administered activity in the total body.
Whole-body scanning with a scintillation camera (Siemens, DIACAM) was performed at 4, 24, 48 and 144 hours after administration. The scans were performed with the scintillation camera equipped with a high-energy collimator. The energy window was centred at 364 keV with a width of 15%. The scan speed was either 10 cm/minute or 20 cm/minute.
For all the patients, blood samples were taken before the administration of the radiopharmaceutical and at nine time points within the 144 first hours after completion of the administration. For eight treatments, blood samples were drawn at even later points in time. All blood samples were separated into red blood cells and plasma by a mild centrifugation. The whole blood, red blood cells and plasma were weighed and measured for 131I-activity in a calibrated well-type NaI(Tl)-detector to get the activity concentration. The hematocrit (HCT) was determined for all blood samples.
Dosimetry
The red marrow dosimetry was performed by three main methods and variations of them, the blood method (BL1–BL4), the imaging method (IM) and the total body approximation-method (TB1–TB2). The main characteristics of the total seven dosimetry methods are summarized in and are explained in detail below.
Table I. Abbreviations.
Table II. A summary of the methods used for calculating the absorbed dose and the median, minimum and maximum of the absorbed dose per unit of injected activity for all ad of the radiopharmaceutical (131I-LL2).
The mean absorbed dose to red marrow (DRM) was calculated as the sum of the self-absorbed dose in red marrow (DRM←RM) and the absorbed dose to red marrow from activity in the remainder of the body (DRM←RB) and the fraction of self absorbed dose was subsequently calculated as the ratio of the self absorbed dose in red marrow and the total absorbed dose in red marrow (DRM←RM/DRM).(All abbreviations in the text and in the equations are summarized in .)
The 70 kg phantom and the non-pregnant female phantom in MIRDOSE3 were used to obtain S values for the red marrow and total body for male and female patients Citation[9]. The S value for red marrow was scaled to the assumed weight of the red marrow in each patient as:However, it is not necessary to establish the actual mass of each patient's red marrow for the blood methods (BL1–BL4) since it is cancelled out in the final equations (Equation 5–8). This is, however, necessary for the imaging method (Equation 10).
The total body S value was recalculated and scaled by patient weight to give the S values for the remainder of the body (SRM←RB).The mass of the remainder of the body for each patient was assumed to equal the total body weight of the patient minus the red marrow weight of the phantom. This should be a reasonable approximation of the actual weight of the remainder of the body since the patient weight is large compared with that of the red marrow.
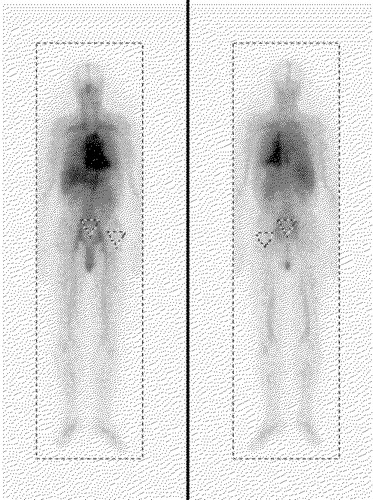
The cumulated activity in red marrow (ÃRM) was calculated using the blood- and imaging methods and the cumulated activity in the total body (ÃTB) was calculated from the single probe measurements and the whole-body scans. The ROI for total body can be seen in . The cumulated activity in the remainder of the body (ÃRB) was calculated by subtracting the cumulated activity in the red marrow from the cumulated activity in the total body.
Figure 1. Whole-body images (left: anterior, right: posterior) 24 hours after administration for patient:treatment number 6:1. The total body ROI, the sacrum ROI and the ROI for background correction are shown.
The blood methods
Four variations of the blood method were used in this work (BL1–BL4). The activity concentration in red marrow was calculated by multiplying the activity concentration in blood by a constant, time-independent factor, denoted the red-marrow-to-blood ratio (RMBLR). The cumulated activity in red marrow (ÃRM) was thus calculated by integration of a monoexponential equation fitted to the activity concentration-time curve for blood ([ÃBL]). Two values of the RMBLR previously reported in the literature were used to calculate the activity in red marrow. Sgouros Citation[2] used a value of 0.36, (this method is denoted BL1 below) while Siegel et al. Citation[5] assumed the RMBLR to equal 1 (denoted BL2 below). The self-absorbed dose to red marrow was then calculated:A RMBLR of 0.36 is based on a standard value of the haematocrit (HCT = 0.47), therefore, a more patient-specific variation of the blood method is obtained by replacing the haematocrit standard value by each patient's actual haematocrit (denoted BL3 below).
HCTpat is the mean value calculated from all blood samples taken during the treatment of the patient.
Another variation of the blood method is to base the calculation of the activity in the red marrow on the activity concentration in plasma. The factor used for the transformation of activity concentration in extracellular fluid to activity concentration in red marrow (RMECFF) was reported by Sgouros Citation[2] to be 0.19 (this variation of the blood method is denoted BL4).
The conjugate view method
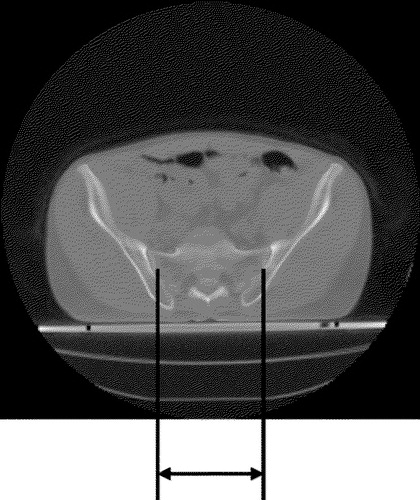
The activity in the sacrum was quantified in the scintillation camera images using the method reported by Siegel et al.Citation[5]. A region of interest (ROI) was drawn to obtain the number of counts in the sacrum region. The size of the ROI was based on measurements on each patient's CT-images (). All ROIs were drawn manually and it was ensured that the bladder was not included. Another equally shaped ROI was drawn laterally at the level of the hip joint, avoiding any area with large blood vessels or bone marrow. This ROI was used for correction of activity in over- and underlying tissues. shows an example of a scintillation camera image where the ROI can be seen. The attenuation correction was based on the patient thickness over the sacrum region (T), as measured in the CT image, and on the effective attenuation coefficient for 131I reported by Siegel et al. Citation[5] (0.0983 cm−1). The scintillation camera sensitivity (k, [cps/MBq]) for 131I was measured and used to transform the number of background and attenuation-corrected counts per second into activity in the sacrum. The total activity in red marrow was calculated by assuming that 9.9% of the total red marrow volume is present in the sacrum (fsacrum) (for adults aged 40 and above, according to Cristy Citation[10]).
Figure 2. The CT scan of the sacral region for patient:treatment 6:1. Since the sacroiliac joint moves sagittally oblique the distance between the ventral and dorsal measurements differs. The mean of the ventral and dorsal measures was used when determining the width of the sacrum in order to correct for this difference.
The cumulated activity was calculated by integration of a monoexponential function fitted to the activity in red marrow determined at the different points in time. The method using the scintillation camera images for red marrow dosimetry is denoted IM.
The total mean absorbed dose in red marrow (D(IM)RM) calculated using the imaging method was, as by all the blood methods, based on Equation 2. In the imaging method the weight of each patient's red marrow is not present in the equation describing the cumulated activity in red marrow, and hence the weight of red marrow does not cancel out in the final equations. Since the weight if each patient's red marrow is hard to estimate and may, because of earlier treatments of their disease, vary, it was decided not to scale the S value (SRM←RM,ph).
The total body approximation methods
The mean absorbed dose to the total body has been used as an approximation of the absorbed dose to red marrow, as reported by Wahl et al. Citation[1]. The cumulated activity in the total body was calculated by integrating a monoexponential function describing the activity clearance from the total body. These calculations were performed on data obtained from the external probe measurements (denoted TB1) and the scintillation camera whole-body scans (denoted TB2). Since the first scintillation camera investigation was performed 4 hours post injection, the monoexponential fit had to be extrapolated to the time of administration. The extrapolated activity in the total body was set to equal the administered activity.
The total body S value (STB←TB) was scaled according to each patient's body weight. The product of the cumulated activity and the S value equals the mean absorbed dose to the total body (DTB), which was used as an approximation of the absorbed dose to the red marrow (DRM).
Results
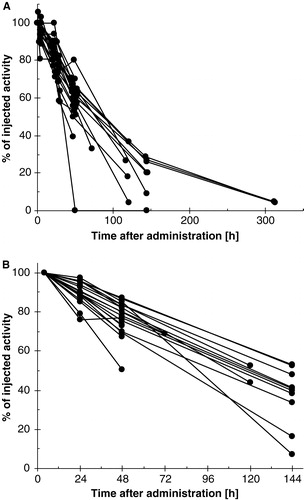
The measured activity concentration in blood and plasma as a function of time after administration for all the patients is shown in a and 3b, respectively. The activity concentrations were utilised for determination of absorbed dose for the blood methods (BL1–BL4). The percent of injected activity that is present in the sacrum as determined by the geometric mean method from the scintillation camera images at the different time points is seen in . These data served as a base for determining the bone marrow absorbed dose by the imaging method (IM). shows the kinetic data used in the calculations of whole body absorbed dose (TB1–TB2). a shows the percent of injected activity in whole body as a function of time measured by the single probe and b shows the data from the whole body scans.
Figure 3. The percent of injected activity per millilitre of a) blood and b) plasma as a function of time for all the patients. (Please note that the x-axes are shortened to make the data in the figures clearer.)
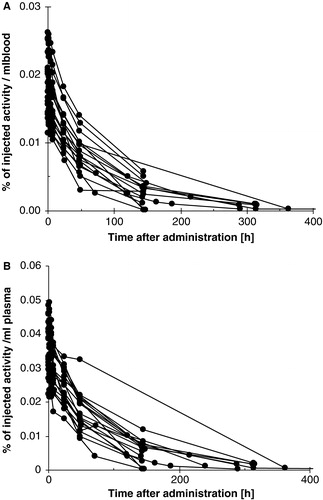
Figure 4. The percent of injected activity that is present in sacrum as a function of time for all the patients. The activity was determined from scintillation camera images by the geometric mean method.
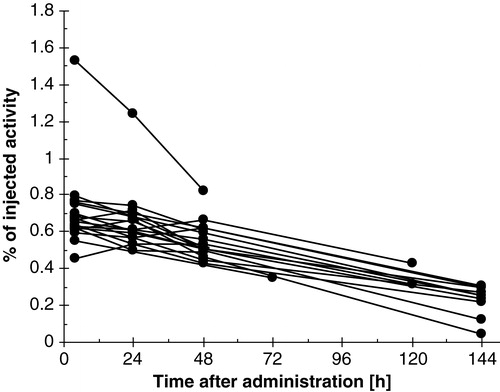
Figure 5. The percent of injected activity in whole body as a function of time after administration for all the patients. The data was determined from a) single probe measurements and b) scintillation camera whole body-scans.
Blood method number two, assuming the RMBLR = 1, results in the largest median value of DRM/A0 (BL2, median = 0.72 mGy/MBq) of the five dosimetry methods for determination of absorbed dose to red marrow (BL1–BL4 and IM). The median value of DRM/A0 is smallest for blood method number one (BL1, median = 0.34 mGy/MBq). The median value of DTB/A0 is, as expected, lower than DRM/A0. The median, minimum and maximum values of absorbed dose per unit injected activity for all the investigated methods are summarized in .
The absorbed dose per unit administered activity for the same RIT treatment differed significantly depending on the choice of method, as can be seen in . In the figure the results for the RIT treatments are presented in the same order for each method, beginning with patient 1, treatment 1 (1:1). The ratio of the maximum to the minimum absorbed dose to red marrow per unit administered activity (DRM/A0), calculated using the five varieties of the red marrow dosimetry methods (BL1–BL4 and IM), for one RIT treatment varies between 1.8 and 2.8 as is shown in . The results of the absorbed dose to total body per unit administered activity (DTB/A0) for the total body methods (TB1 and TB2) are presented in .
Figure 6. Interpatient variability: Absorbed dose to bone marrow per unit injected activity calculated with the four variations of the blood method (BL1–BL4) and the imaging method (IM) and absorbed dose to the total body per unit injected activity, calculated based on either external probe measurements (TB1) or the total body counts in scintillation camera images (TB2). The order of the patients is the same for all methods.
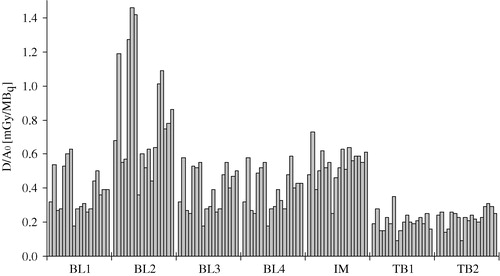
Table IIIa. Absorbed dose to red marrow per unit administered activity for all patients and RIT treatments using the blood methods and the sacrum imaging method.
Table IIIb. Absorbed dose to total body per unit administered activity for all patients and RIT treatments using the total body approximation methods.
The self-absorbed dose is generally the dominant contributor to the total absorbed dose to red marrow for patients undergoing RIT with 131I-LL2. The median value of the self-absorbed fraction is over 0.64 for all methods and BL2 shows the largest median value of the self-absorbed fraction (0.84). The self absorbed fraction varies, however, as much as between 0.38 and 0.95 ().
Table IV. Fraction of self-absorbed dose to the total absorbed dose to the red marrow (DRM←RM/DRM).
The patient's haematocrits (HCTpat) vary between 37% and 63%, which causes a variation in the RMBLR between 0.30 and 0.51 (RMBLR was calculated according to Equation 7) as is shown in . The median of the HCT was 50%. No variation of the haematocrit with time post injection was observed for any of the patients.
Table V. Variation of HCTpat and the calculated RMBLR for all patients and RIT treatments. (RMBLR = 0.19/(1-HCTpat))
The correlation coefficients for all combinations of the dosimetry methods used in this work can be seen in . The coefficients vary between 0.51 (IM–BL2) and 0.99 (BL1–BL2). The four variations of the blood method show correlations to each other that are over 0.89, and the two methods for determination of the absorbed dose to the total body show a correlation of 0.57. The imaging method correlates best to BL3 and BL4, which are the two most patient-specific variations of the blood methods (0.68 and 0.67, respectively).
Table VI. The correlation coefficients of the absorbed dose per unit injected activity for all the methods investigated for red marrow dosimetry.
The relative standard deviation for the self-absorbed dose to bone marrow per unit injected activity is smaller when the calculations are based on data from scintillation camera images; i.e. 0.23 compared with values of 0.40 to 0.47 for BL1-BL4 (BL1, 0.47; BL2, 0.47; BL3, 0.43; BL4, 0.40).
In are the correlation coefficients for the absorbed dose and toxicity shown. The correlation to the maximum drop in number of platelets is about the same for all dosimetry methods, whilst the correlation to the time to platelet nadir is poorer and varies more.
Table VII. The correlation coefficients of the absorbed dose and the maximum drop in number of platelets and the absorbed dose and the time to nadir.
Discussion
In the present study the absorbed dose was determined by three main methods: the total body approximation, the blood method and by activity quantification from scintillation camera images. In the ideal situation the calculated absorbed doses to red marrow using the different methods should result in the same values for the same treatment on one patient. The results in a and b, however, show that the absorbed dose per unit injected activity varies substantially between the different methods for the same patient. The ratio of the maximum and the minimum of the calculated total absorbed dose to red marrow for the same treatment varies between 1.8 and 2.8 (a). The ratio of the maximum and the minimum of the calculated absorbed dose to the total body for the same treatment varies between 1.0 and 1.6 ().
The scintillation camera imaging method (IM) is the only one of the investigated methods that can consider the regional variability of the radionuclide distribution. The regional variability of the activity uptake might be large if there is bone marrow involvement of the disease Citation[11], which is rather common in lymphoma patients. In the present study only one patient (no. 2) had a significant bone marrow involvement (25%, as determined by biopsy, flow cytometry and immunohistochemistry). The absorbed dose to red marrow determined by the imaging method was not, however, significantly higher than that given by the blood method for this patient. One reason for this might be that the bone marrow involvement of the disease was minimal in the sacrum, which was the only location used for activity quantification.
The choice of the value of the RMBLR, the factor translating the activity concentration in blood or plasma into the activity in red marrow, greatly influenced the value of the calculated absorbed dose using the blood method, as can be seen in the results in and . The often used RMBLR of 0.36 is based on an HCT of 47%, which differs slightly from the median of the HCT of the patients included in this study which was 50%. This variation could, however, be explained by the small number of patients in this study. The use of each patient's HCT (BL3) provides the opportunity for more patient-specific dosimetry, and is the method showing the best correlation to the results calculated using the imaging method (IM). The imaging method could, however, be further developed by taking into account the trabecular bone volume measured from CT images Citation[7].
The total body absorbed dose was determined both from measurements with a handheld probe (TB1) and from scintillation camera images (TB2). The correlation between these two methods was 0.57, which was lower than expected. A closer analysis of the results in shows that the total body absorbed dose, for this radiopharmaceutical and using these two methods, differed depending on the time at which the last determination of the total body activity was made.
The absorbed dose to the total body may be utilized for the determination of the activity to be administered during RIT. The absorbed dose to the total body was not only a valuable tool during the development of BexxarTM but it is also the basis for clinical dosing of this radiopharmaceutical Citation[12], Citation[13]. The correlation coefficients between absorbed dose to the total body and the absorbed dose to red marrow in the present study had values between 0.53 and 0.75 for the different combinations of methods used for total body and red marrow dosimetry.
The correlations between the mean absorbed dose per unit activity administered for combinations of the four blood methods are high (0.89–0.98), as expected, as the results are based on the same data. The correlation between the imaging method and the blood methods was highest for BL3, i.e. the blood method considering each patient's HCT (0.68). The absorbed dose to red marrow based on the activity in plasma (BL4) showed the second highest correlation to the results from the imaging study (0.67).
The results here presented, show that the variability of the absorbed dose to bone marrow is dependent on both method and patient. The method of choice for bone marrow dosimetry must of course be the one that gives the best correlation between absorbed dose and the biologic response to radiation. The correlation between platelet toxicity and absorbed dose to the bone marrow for this limited number of patients varied between −0.53 and −0.58. One can, however, conclude that the dosimetric method influences the value of the calculated absorbed dose obtained.
References
- Wahl RL, Kroll S, Zasadny KR. Patient-specific whole-body dosimetry: Principles and a simplified method for clinical implementation. J Nucl Med 1998; 39: 14s–20s
- Sgouros G. Bone marrow dosimetry for radioimmunotherapy: Theoretical considerations. J Nucl Med 1993; 34: 689–94
- Siegel JA, Wessels BW, Watson EE, Stabin MG, Vriesendorp HM, Bradley EW, et al. Bone marrow dosimetry and toxicity for radioimmunotherapy. Antibody, immunoconjugates and Radiopharmaceuticals 1990; 3: 213–33
- Hindorf C, Lindén O, Tennvall J, Wingårdh K, Strand S-E. Time dependence of activity concentration ratio of red marrow to blood and implications for red marrow dosimetry. Cancer supplement 2002; 94: 1235–9
- Siegel JA, Lee RE, Pawlyk DA, Horowitz JA, Sharkey RM, Goldenberg DM. Sacral scintigraphy for bone marrow dosimetry in radioimmunotherapy. Nucl Med Biol 1989; 16: 553–9
- Sgouros G, Stabin M, Erdi Y, Akabani G, Kwok C, Brill AB, et al. Red marrow dosimetry for radiolabeled antibodies that bind to marrow, bone, or blood components. Med Phys 2000; 27: 2150–64
- Shen S, Meredith RF, Duan J, Macey DJ, Khazaeli MB, Robert F, et al. Improved prediction of myelotoxicity using a patient-specific imaging dose estimate for non-marrow-targeting 90Y-antibody therapy. J Nucl Med 2002; 43: 1245–53
- Lindén O, Tennvall J, Cavallin-Ståhl E, Darte L, Garkavij M, Lindner K-J, et al. Radioimmunotherapy using 131I-labeled anti-CD22 monoclonal antibody (LL2) in patients with previously treated B-cell lymphomas. Clin Cancer Res 1999; 5: 3287s–91s
- Stabin MG. MIRDOSE: Personal Computer Software for Internal Dose Assessment in Nuclear Medicine. J Nucl Med 1996; 37: 538–46
- Cristy M. Active bone marrow distribution as a function of age in humans. Phys Med Biol 1981; 26: 389–400
- Sgouros G, Jureidini IM, Scott AM, Graham MC, Larson SM, Scheinberg DA. Bone Marrow Dosimetry: Regional variability of marrow-localizing antibody. J Nucl Med 1996; 37: 695–8
- Seldin DW. Techniques for Using Bexxar for the Treatment of Non-Hodgkin's Lymphoma. J Nucl Med Technol 2002; 30: 109–14
- Wahl RL. The clinical importance of dosimetry in radioimmunotherapy with tositumomab and iodine I 131 tositumomab. Semin Oncol 2003; 30: 31–8