Abstract
Theoretical modelling of tumour response is increasingly used for the prediction of treatment result and has even been proposed as ranking criteria in some algorithms for treatment planning. Tumour response to radiation is greatly influenced by the details of tumour microenvironment, especially hypoxia, that unfortunately are not always taken into consideration for these simulations. This paper intends to investigate the effects of various assumptions regarding hypoxia distribution in tumours on the predictions of treatment outcome. A previously developed model for simulating theoretically the oxygenation in biologically relevant tissues, including results from oxygen diffusion, consumption and perfusion limitations in tumours, was used to investigate the effects of the different aspects of hypoxia on the predictions of treatment outcome. Thus, both the continuous distribution of values and the temporal variation of hypoxia patterns were taken into consideration and were compared with a ‘black-and-white’ simplification with a fully hypoxic compartment and a fully oxic one. It was found that the full distribution of oxygenation in the tissue is needed for accurate results. The ‘black-and-white’ simplification, while showing the same general trends for the predictions of radiation response, could lead to serious overestimations of the tumour control probability. It was also found that the presence of some hypoxia for every treatment fraction leads to a decrease in the predicted local control, regardless of the change of the hypoxic pattern throughout the duration of the whole treatment. The results thus suggest that the assumptions regarding tumour hypoxia influence very much the predictions of treatment outcome and therefore they have to be very carefully incorporated into the theoretical modelling.
Theoretical modelling of tissue response has mainly been used for the comparison of fractionated treatments in terms of iso-effects. The advent of functional imaging modalities with good geometrical resolution makes it possible that specific biological information is included into treatment planning algorithms that use biological criteria for the analysis and ranking of plans.
This particular application imposes strict requirements with respect to the accuracy of the results of theoretical modelling. These requirements can be met successfully if several main conditions are satisfied. One of them is that relevant biological parameters should be used as input for the simulations. Accurate parameters for modelling tissue response in vivo are however scarce, as it is well known that parameters derived from cells grown in vitro may not be useful for describing the behaviour of cells in tissues. The most used source of in vivo parameters are clinical data sets, but the parameters thus derived are model dependent and any extrapolations outside the clinical conditions from which they have been derived may therefore be dangerous. The issue of the relevance of parameters derived from clinical data and the importance of the distributions of values for the theoretical predictions of tissue response has been addressed elsewhere Citation[1].
Also important is the use of a realistic tissue model that takes into consideration the microenvironmental conditions known to influence greatly the radiation response. The tumour microenvironment is considered to be one of the major factors leading to treatment failure. The mechanisms of failure are different for various treatment modalities, but they all relate to the characteristics of the tumour blood supply. It is a known fact that tumour vasculature is poor compared to that in normal tissues Citation[2], Citation[3]. This determines a unique tumour environment characterised by an impaired supply of nutrients, the most important of them being oxygen. Thus, impaired oxygen supply to the cells (hypoxia) is known to result in increased radioresistance that is considered to be the cause of failure for many treatments Citation[4–6]. Furthermore, two types of hypoxia can be identified in a tumour tissue. Diffusion limited hypoxia is caused by the limited diffusion of oxygen into the tissue from the blood vessels Citation[7]. Perfusion limited hypoxia may also appear superimposed on the diffusion-limited hypoxia Citation[8] as the result of the temporarily decreased or even stopped blood flow in some tumour vessels due to collapse or obstruction. This process however is temporary and closed blood vessels may open within a relatively short time ranging from minutes to hours. It has further been shown, as for example with mismatch techniques Citation[9–11], that while some previously collapsed blood vessels will reopen, some other blood vessels will close thus changing the geometrical pattern of hypoxia in the tumour. It has to be noted that due to the diffusion and consumption processes, a whole range of oxygen tensions and hence of radiosensitivities will exist in tumours. For most of the practical applications however, the effects of hypoxia are usually estimated by assuming a ‘black-and-white’ simplification of the full distribution with a fully hypoxic compartment and a fully oxic one. This simplification might have very important implications and surprisingly little has been done to study its effects on the predictions of treatment outcome Citation[12].
This paper intends to investigate the influence of the choice of oxygen tension distribution (a full distribution of values or a ‘black-and-white’ simplification) on the predictions of tumour response. It also aims to study the influence of the spatial and temporal variations of perfusion limited hypoxia.
Materials and methods
Biologically relevant distributions of oxygen tensions (or pO2 values) were obtained by simulating the diffusion and consumption of oxygen at the cells. In principle any distribution of oxygen tensions could have been used, but theoretical simulations were preferred in order to minimise the artefacts introduced by the use of arbitrary distributions. Simulations of tissue oxygenations have been successfully performed for a very long time Citation[7], Citation[13–17] Citation[18] both for describing and for characterising tumour oxygenation. Indeed, theoretical simulations of oxygen diffusion into tissue have been essential for the demonstration by Thomlinson and Gray Citation[7] of the presence of diffusion-limited hypoxia in tumours.
Tumour tissues with different vascular structures were modelled according to the method described in Daşu et al. Citation[18]. Thus, a Monte Carlo technique was used to generate tissues with biologically relevant distributions of intervessel distances centred on 50, 100 and 150 µm, in agreement to the experimental study of Konerding et al. Citation[19]. The modelled tissues had a 2D geometry that may be regarded as a simplification of the real 3D structure of tissues. However, the results of the simulations may be considered representative for the oxygenation in real tissues as has been shown in Daşu et al. Citation[18]. Low values (40 mmHg) were assumed for oxygen tensions in the blood vessels as in tumours they often originate from the venous side of the vasculature Citation[3]. The diffusion parameters were those used for successful previous simulations: oxygen diffusion coefficient in tissue 2×10⁻⁵ cm2s−1 and maximum oxygen consumption rate 15 mmHg/s Citation[7], Citation[15], Citation[18]. The oxygen distribution given by the oxygen diffusion and consumption in the tissue was then calculated through a numerical method. The resulting oxygenation maps thus reflected only the diffusion-limited hypoxia.
Perfusion-limited hypoxia was simulated by randomly shutting down a fraction of the blood vessels in the tissue as it was described in Daşu et al. Citation[18]. This mimics the experimental observations of this type of hypoxia through mismatch techniques Citation[9–11]. The oxygenation map obtained under these conditions reflected the effects of the temporary closure of some blood vessels superimposed over the diffusion-limited hypoxia. The method also allows the simulation of the change in tumour oxygenation patterns that may appear at different points in time, e.g. at different irradiation moments during a fractionated treatment.
The linear quadratic (LQ) model Citation[20–24], that has been successfully employed for the evaluation of old treatments and for the estimation of possible gains of new ones, was used to simulate theoretically the cell survival of a fully oxic population of cells after a radiation dose D (Equation 1).The α and β parameters in Equation 1 have been chosen to give a cell survival fraction of 0.5 at 2 Gy (SF2) while assuming α/β = 10 Gy. This choice of parameters is universal enough to illustrate the concepts presented in this paper and indeed to describe the clinical response of tissues.
In order to describe the response of tissues characterised by a certain oxygen distribution we have used dose-modifying factors for the LQ parameters in order to describe the variation of the response to radiation with the oxygenation level. The tissue oxygenation at a certain moment in time was described as a histogram distribution of individual oxygenations without much concern for the spatial distribution of the values, as for this paper only homogeneous dose distributions for the tumours were assumed. This assumption thus allowed the study of the effects of hypoxia only, without the perturbing effects of other factors.
Under the assumptions above, the cell survival for a population of cells with different oxygenations is the weighted sum of the individual survivals for each oxygenation interval (Equation 2):where wi is the corresponding weight from the oxygen distribution function and
and
are the corresponding dose modifying factors for the α and β parameters respectively, given by the formula proposed by Alper and Howard-Flanders Citation[25] for the average oxygenation level in each oxygenation interval (Equation 3).
where DMFmax is the maximum dose modifying factor for extreme hypoxia, pO2 is the oxygen tension and k is a constant, similar to the Michaelis-Menten constant for enzymatic reactions.
We support the use of the DMF (Dose Modifying Factor) concept for the individual parameters instead of the OER (Oxygen Enhancement Ratio), as the latter is a concept that quantifies the modification of a cell survival curve as a whole. Thus, it may be said that the particular OER at a certain survival level is the result of a particular set of individual DMF values of the parameters.
Usually it is considered that the two LQ parameters are described by the same DMF, the maximum value of which (reflecting a fully hypoxic population) is somewhere around 2.5–3 Citation[26]. However, the use of different maximum DMF values for the two LQ parameters in Equation 2 (in our particular case and
) allows a simple description of the variation of the oxygen enhancement ratio (OER) with survival level that has indeed been seen in some experimental studies Citation[27–30], though it is not clear whether this effect is due to the LET of radiation, cell cycle effects or repair. As will be seen further however, the use of identical or different DMF for the two LQ parameters does not change very much the results of our simulation.
Comparisons were made between the predicted response of tissues described either by the full oxygen distribution or by a ‘black-and-white’ simplification where the fraction of cells with pO2 below the hypoxic threshold of 2.5 mmHg was assumed to be fully hypoxic (i.e., with maximum DMF values applied) and the remaining population fully oxic. The ‘black-and-white’ simplification has indeed been used very much for estimations of the effects of hypoxia and we believe that our approach would most likely show its influence on the predictions of treatment outcome.
Besides the importance of the distributions of radiosensitivities in tumours, the spatial modification of the pattern of hypoxia during the treatment course was also investigated, as it may also be important for the theoretical modelling of tumour response to radiation. In order to estimate the effects of this variation, we have simulated 30 random different hypoxia patterns (corresponding to 30 fractions) that may arise due to blood vessel collapse during a fractionated course in a tissue with no diffusion-limited hypoxia (defined as pO2<2.5 mmHg). It was assumed that the same fraction of blood vessels was closed at every fraction. For each of the 30 random different oxygen distributions resulting from the simulation we have calculated the corresponding cell survival and in the end the overall survival as may result from the change in oxygenation during a full treatment course (the full distribution of pO2 values in the tissue was taken into consideration).
For the theoretical description of the tumour control probability (TCP) it was considered that a Poisson function describes the response of the whole tissue to radiation. Indeed, the experimental determination of TCP is subject to such large uncertainties that the choice of the theoretical model is not a critical issue Citation[1]. Thus, assuming that there were N clonogenic cells in the tumour, the TCP after cell survival SFtot is given by the equation:Proliferation was not taken into consideration, as it would add unnecessary complications to Equation 4. Neither heterogeneity of the parameters Citation[1], nor the effects of inducible repair on hypoxia Citation[31–33] were included as they may also add some complications which may superimpose on the effects of hypoxia and may thus complicate the interpretation of the results. It has to be remembered though that these effects will not conceal the effects of hypoxia.
Results
and , illustrate for three tissue types the effects of distributions of oxygen tensions in tumours on the theoretical predictions of the tumour response to radiation. It should be remembered that cell survival is converted exponentially into TCP (Equation 4) and hence a change in cell survival that appears small could mean a considerable change in TCP. Specific values of ΔTCP for the cases considered in –3 are given in .
Figure 1. Theoretical predictions of the tumour response to radiation for a tumour tissue well supplied with oxygen. a) oxygenation of the tissue as histograms (inset–full tissue oxygenation map). b) predicted response to single doses of radiation. c) response from fractionated treatments. Solid lines–predictions for a continuous distribution of oxygen tensions in tumours. Dashed lines–predictions for a ‘black-and-white’ (binary) distribution of oxygen tensions in tumours.
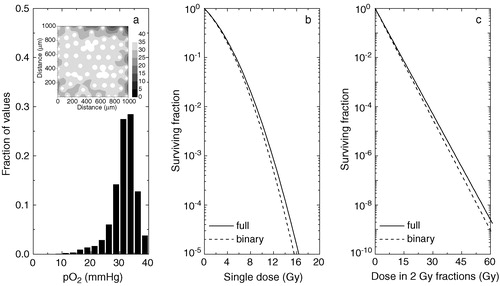
Figure 2. Theoretical predictions of the tumour response to radiation for a tumour tissue with impaired oxygen supply. a) oxygenation of the tissue as histograms (inset–full tissue oxygenation map). b) predicted response to single doses of radiation. c) response from fractionated treatments. Solid lines–predictions for a continuous distribution of oxygen tensions in tumours. Dashed lines–predictions for a ‘black-and-white’ (binary) distribution of oxygen tensions in tumours.
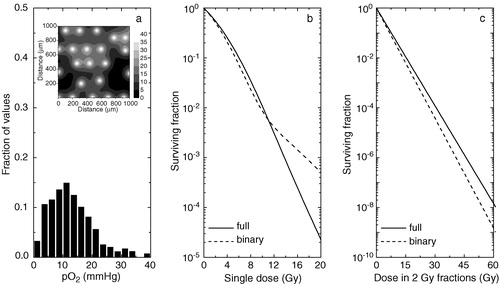
Figure 3. Theoretical predictions of the tumour response to radiation for a tumour tissue with poor oxygenation. a) oxygenation of the tissue as histograms (inset–full tissue oxygenation map). b) predicted response to single doses of radiation. c) response from fractionated treatments. Solid lines–predictions for a continuous distribution of oxygen tensions in tumours. Dashed lines–predictions for a ‘black-and-white’ (binary) distribution of oxygen tensions in tumours.
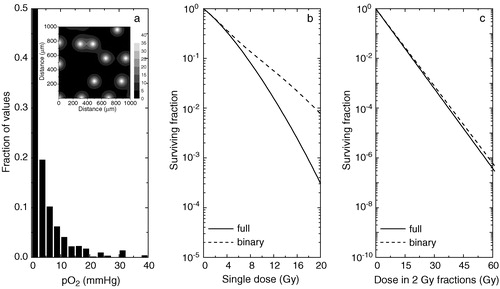
Table I. Estimated tumour control probabilities (TCP) after 30 fractions for tissues with various degrees of oxygenation
As it can be seen, simplifying the full oxygenation by a ‘black-and-white’ (or binary) distribution may be a dangerous assumption in all the situations. As tumours derive their vasculature from the venous side of the circulation Citation[3], even tissues with relatively high vascular density () cannot be assumed as being fully oxic. Indeed, as b shows, the difference between the predicted cell survival curves for a full distribution compared to a ‘black-and-white’ one increases with increasing the radiation dose. The differences in predicted survival may indeed be small for single doses in the clinical range, but for fractionated treatments (c) the difference is enhanced geometrically with the fraction number. Thus, as can be seen in , approximating a well supplied tumour by a fully oxic population may result in an overestimation of the TCP after 30 radiation fractions between 2 and 31% (ΔTCP in the final column in ), depending on the initial number of clonogens N in the tumour. This is because the difference in cell survival after 30 fractions is substantial, as can be very clearly seen on the log scale in c.
shows that the overestimation increases if the oxygenation of the tumour decreases. Thus, for a tissue with little hypoxia, both the predictions for single doses (b) and for fractionated treatments (c) are different if a ‘black-and-white’ model is chosen instead of the full distribution of oxygen tensions. The explanation resides in the fact that even though the tissue has little or no hypoxia, most of the cells are at low pO2 values that will confer significant, even though not maximal, protection against radiation. In this case the use of a ‘black-and-white’ model would overestimate the predicted TCP at 30 fractions by up to 63% in absolute value compared to the case when the full distribution is taken into consideration.
However, it seems that if the tumour oxygenation is very poor (), the predictions of the ‘black-and-white’ model for the cell kill and hence of the TCP seem to improve (it should be noted however that in the particular case shown the black-and-white approach leads to an underestimation of the response), but they are still not identical to those from the full distribution approach. The reason for the improvement may be the fact that for such very hypoxic tumours the cells in the lowest pO2 compartment would dominate the response to doses in the clinical dose range. It should be questioned however if cases with such poor oxygenation are often encountered in the clinic and if so should they undergo standard radiation treatment without any attempt to improve the tissue oxygenation.
Our results therefore suggest that the ‘black-and-white’ simplification of the oxygenation cannot predict the changes in response in a consistent way, even though it has been used for conceptual or qualitative predictions of the tissue response. Adding the inability of the ‘black-and-white’ simplification to predict the change in response at varying the dose per fraction (as seen best in b), it seems that the ‘black-and-white’ approach might not be suitable for predictive simulations as may be required for clinical applications. It could appear that the issue of drastically changing the dose per fraction might not have clinical relevance. However, there is an increasing number of radiation treatment regimes that make use of large doses per fraction as is for example the stereotactic radiotherapy, the use of large boost doses for some treatments (given either as high dose rate brachytherapy or external beams) or the now large body of hypofractionated trials for the treatment of the prostate carcinomas.
presents the results of the simulations regarding the spatial modification of the pattern of hypoxia during the treatment course. They show that the closure of 25% of the blood vessels in the tissue could lead to the appearance of a hypoxic fraction varying between 3 and 20% with a mean value of (10±4)%. We have indeed shown elsewhere Citation[18] that generally there is no correlation between the fraction of closed vessels at a certain time and the hypoxic fraction in the tissue. It has to be borne in mind that the small differences in fractional cell survival amplify in a geometrical manner in a full treatment leading to considerable differences for the predictions of the final cell survival or TCP.
Table II. Effects of the temporal variation of the distribution of acute hypoxia in tumours
From this simulation it was found that the predicted TCP for a population of 108 clonogens and for a treatment with 30 fractions of 2 Gy is 15.0% if the perfusion limited time-varying hypoxia is taken into consideration for the full oxygen distribution. However, the prediction of the final TCP with perfusion limited hypoxia was quite different if the black-and-white simplification was used, being 69.5% for a population of 108 clonogens. Thus, it was proven again that the black-and-white approach yields considerably different results from those of the full distribution of pO2 values and may lead to serious overestimations of the TCP of the treatment.
Discussion
Using a previously developed technique for simulating theoretically the tissue oxygenation resulting from oxygen diffusion, consumption and perfusion limitations in tumours Citation[18], we have investigated the effects of different aspects of hypoxia on the predictions of treatment outcome.
We have found that in order to obtain accurate results, the full distribution of the pO2 values in the tissue is needed. A ‘black-and-white’ simplification of the microenvironment with a fully hypoxic compartment and a fully oxic one could lead to serious overestimations of the tumour control probability for a given dose, the difference being up to tens of percents in some cases. It could be argued that this high loss in TCP may be the result of assuming the Poisson model that predicts quite steep tumour response vs dose. However, the shallower clinical curves that are seen in practice are the result of inter-patient heterogeneity Citation[1], while the simulations described above give the maximum loss that may appear for one patient.
Furthermore, the ‘black-and-white’ simplification was shown to be unable to predict correctly the variation of the effect with the dose per fraction for tissues with various oxygenations. Thus, even though an equivalent hypoxic fraction for a ‘black-and-white’ simplification could be defined mathematically for a particular distribution, it is extremely important to stress that it is valid only for the dose per fraction for which it has been calculated. Any change, both in distribution of oxygenation or in dose per fraction would render useless the equivalent hypoxic fraction. Therefore the use of the ‘black-and-white’ simplification should be limited to conceptual or qualitative estimations of the tissue response to a single dose only. A more complete distribution of values is needed for predictive simulations with clinical endpoints. Similar results were also obtained by Wouters and Brown Citation[12] by using a simplified tissue model based on the oxygen distribution around one blood vessel only. Our simulations however give the more generally applicable results for tissues with biologically relevant distributions of intervascular distances. The fact that tissue oxygenations were obtained from 2D structures has minimal impact on the significance of the results, as any distribution of oxygen tensions could have been used in principle. The purpose of the simulation was to minimise possible artefacts introduced by the use of arbitrary distributions. Furthermore, it has previously been shown that in a first approximation the results of simulations in a 2D geometry may be considered representative for the oxygenation in real tumours Citation[18].
These findings were not an artefact of the particular dose modifying factors used in Equation 2. If we used a DMF of 3 for all the parameters in Equation 2, the results of the simulations varied only by a few percent, while the order of magnitude and certainly the trends remained the same. Therefore, if modelling is used for an analysis with a more general aim, the choice of the DMF is not critical. If however, modelling is used for precise predictive purposes, e.g. as criteria for treatment planning (as a part of a penalty function), the relevant parameters should be used in each case. This is unfortunately not very easy as the magnitude of the OER effect seems to depend on the investigated cell lines and it is quite strongly LET dependent Citation[26]. Therefore the transfer of parameters from one cell line to another or from one radiation quality to another might not be relevant for predictive simulations.
We have also investigated the effects of the change of the hypoxia pattern due to the temporary closure of some blood vessels during the treatment. It has to be remembered that the oxygen distribution for each fraction can be regarded as a snapshot at a moment in time and therefore the presence of some hypoxic cells at every radiation fraction worsens the cell killing, no matter how the hypoxic regions are distributed geometrically throughout the tumour. We have found that even in this situation the ‘black-and-white’ simplification leads to completely different results from those obtained when the full distribution of oxygen is taken into account.
It thus appears that full information on oxygenation is needed for inclusion into the treatment planning algorithms. Such information might be available now from various modern imaging modalities. Thus, magnetic resonance imaging (MRI) can be used to obtain information on blood oxygenation and on tumour energy status or metabolism Citation[34]. Complementary information can be obtained from positron emission tomography (PET) with dedicated tracers that are preferentially metabolised in the hypoxic cells, such as fluorinated misonidasoles or Cu-ATSM, which have been successfully used for the imaging of tumour hypoxia Citation[34], Citation[35]. There are however several factors which must be taken into consideration when using this type of information for simulation purposes. Thus, even though technological advances have increased the spatial resolution of the imaging methods to sub-millimetre sizes, the scale of variation for tissue oxygenation is at least one order of magnitude smaller. This means that the measurements might be the result of averaging in rather large regions of tissues, a process which might influence the predictions for treatment outcome as illustrated by Toma-Daşu et al. Citation[36]. This however does not minimise the importance of information supplied by the imaging methods mentioned, as they have indeed the great advantage of identifying the tumour regions suspected to have reduced oxygenation and which might benefit from a boosting of the radiation dose.
It could be argued that the prediction of treatment outcome depends on many other factors besides the assumption regarding the shape of the distribution describing the tissue oxygenation. This is of course true, but it has to be recognised that the full tissue response will be result of adding the effects of all these factors. It is therefore quite important to find the magnitude of each effect without the perturbing effects of the other factors. From this perspective, our study has shown that the assumptions regarding the tumour hypoxia have non-negligible implications for the predictions of treatment outcome and therefore they have to be very carefully incorporated into the theoretical modelling.
Conclusions
This paper analysed the effects of different aspects of hypoxia on the predictions of treatment outcome. Both the continuous distribution of values and the temporal variation of hypoxia were taken into consideration. It was found that the description of the full distribution of oxygen in tissue by a ‘black-and-white’ simplification with fully oxic and fully hypoxic cells could lead to erroneous predictions of treatment outcome. It was also found that the presence of some perfusion-limited hypoxia for every treatment fraction leads to a decrease in the predicted local control, irrespective of how the hypoxia pattern changes throughout the duration of the whole treatment. Therefore, it may be concluded that the treatment outcome will be influenced mainly by the amount of hypoxia existing at each treatment fraction, while the temporal change of the geometrical distribution of hypoxic regions between fractions will have less importance.
This investigation was supported by grants from the Cancer Research Foundation in Northern Sweden and the Medical Faculty at Umeå University. We would also want to thank Professor Jack Fowler for stimulating discussions.
References
- Daşu A, Toma-Daşu I, Fowler JF. Should single or distributed parameters be used to explain the steepness of tumour control probability curves?. Phys Med Biol 2003; 48: 387–97
- Jain RK. Determinants of tumor blood flow: a review. Cancer Res 1988; 48: 2641–58
- Vaupel P, Kallinowski F, Okunieff P. Blood flow, oxygen and nutrient supply, and metabolic microenvironment of human tumors: a review. Cancer Res 1989; 49: 6449–65
- Höckel M, Knoop C, Schlenger K, Vorndran B, Baussmann E, Mitze M, et al. Intratumoral pO2 predicts survival in advanced cancer of the uterine cervix. Radiother Oncol 1993; 26: 45–50
- Nordsmark M, Overgaard M, Overgaard J. Pretreatment oxygenation predicts radiation response in advanced squamous cell carcinoma of the head and neck. Radiother Oncol 1996; 41: 31–9
- Brizel DM, Sibley GS, Prosnitz LR, Scher RL, Dewhirst MW. Tumor hypoxia adversely affects the prognosis of carcinoma of the head and neck. Int J Radiat Oncol Biol Phys 1997; 38: 285–9
- Thomlinson RH, Gray LH. The histological structure of some human lung cancers and the possible implications for radiotherapy. Br J Cancer 1955; 9: 539–49
- Brown JM. Evidence for acutely hypoxic cells in mouse tumours, and a possible mechanism of reoxygenation. Br J Radiol 1979; 52: 650–6
- Chaplin DJ, Olive PL, Durand RE. Intermittent blood flow in a murine tumor: radiobiological effects. Cancer Res 1987; 47: 597–601
- Bussink J, Kaanders JHAM, Rijken PFJW, Peters JPW, Hodgkiss RJ, Marres HAM, et al. Vascular architecture and microenvironmental parameters in human squamous cell carcinoma xenografts: effects of carbogen and nicotinamide. Radiother Oncol 1999; 50: 173–84
- Rijken PFJW, Bernsen HJJA, Peters JPW, Hodgkiss RJ, Raleigh JA, van der Kogel AJ. Spatial relationship between hypoxia and the (perfused) vascular network in a human glioma xenograft: a quantitative multi-parameter analysis. Int J Radiat Oncol Biol Phys 2000; 48: 571–82
- Wouters BG, Brown JM. Cells at intermediate oxygen levels can be more important than the “hypoxic fraction” in determining tumor response to fractionated radiotherapy. Radiat Res 1997; 147: 541–50
- Krogh A. The number and distribution of capillaries in muscles with calculations of the oxygen pressure head necessary for supplying the tissue. J Physiol 1919; 52: 409–15
- Hill AV. The diffusion of oxygen and lactic acid through tissues. Proc Roy Soc B 1928; 104: 39–96
- Tannock IF. Oxygen diffusion and the distribution of cellular radiosensitivity in tumours. Br J Radiol 1972; 45: 515–24
- Secomb TW, Hsu R, Dewhirst MW, Klitzman B, Gross JF. Analysis of oxygen transport to tumor tissue by microvascular networks. Int J Radiat Oncol Biol Phys 1993; 25: 481–9
- Nilsson J, Lind BK, Brahme A. Radiation response of hypoxic and generally heterogeneous tissues. Int J Radiat Biol 2002; 78: 389–405
- Daşu A, Toma-Daşu I, Karlsson M. Theoretical simulation of tumour oxygenation and results from acute and chronic hypoxia. Phys Med Biol 2003; 48: 2829–42
- Konerding MA, Malkusch W, Klapthor B, van Ackern C, Fait E, Hill SA, et al. Evidence for characteristic vascular patterns in solid tumours: quantitative studies using corrosion casts. Br J Cancer 1999; 80: 724–32
- Chadwick KH, Leenhouts HP. A molecular theory of cell survival. Phys Med Biol 1973; 18: 78–87
- Douglas BG, Fowler JF. Fractionation schedules and a quadratic dose-effect relationship. Br J Radiol 1975; 48: 502–4
- Douglas BG, Fowler JF. The effect of multiple small doses of X rays on skin reactions in the mouse and a basic interpretation. Radiat Res 1976; 66: 401–26
- Barendsen GW. Dose fractionation, dose rate and iso-effect relationships for normal tissue responses. Int J Radiat Oncol Biol Phys 1982; 8: 1981–97
- Fowler JF. The linear-quadratic formula and progress in fractionated radiotherapy. Br J Radiol 1989; 62: 679–94
- Alper T, Howard-Flanders P. Role of oxygen in modifying the radiosensitivity of E. Coli B. Nature 1956; 178: 978–9
- Hall EJ. Radiobiology for the radiologist5th ed. Lippincott Williams & Wilkins, Philadelphia 2000
- Palcic B, Brosing JW, Skarsgard LD. Survival measurements at low doses: oxygen enhancement ratio. Br J Cancer 1982; 46: 980–4
- Watts ME, Hodgkiss RJ, Jones NR, Fowler JF. Radiosensitization of Chinese hamster cells by oxygen and misonidazole at low X-ray doses. Int J Radiat Biol 1986; 50: 1009–21
- Freyer JP, Jarrett K, Carpenter S, Raju MR. Oxygen enhancement ratio as a function of dose and cell cycle phase for radiation-resistant and sensitive CHO cells. Radiat Res 1991; 127: 297–307
- Skarsgard LD, Harrison I. Dose dependence of the oxygen enhancement ratio (OER) in radiation inactivation of Chinese hamster V79-171 cells. Radiat Res 1991; 127: 243–7
- Daşu A, Denekamp J. New insights into factors influencing the clinically relevant oxygen enhancement ratio. Radiother Oncol 1998; 46: 269–77
- Daşu A, Denekamp J. Superfractionation as a potential hypoxic cell radiosensitizer: prediction of an optimum dose per fraction. Int J Radiat Oncol Biol Phys 1999; 43: 1083–94
- Denekamp J, Daşu A. Inducible repair and the two forms of tumour hypoxia--time for a paradigm shift. Acta Oncol 1999; 38: 903–18
- Ling CC, Humm J, Larson S, Amols H, Fuks Z, Leibel S, et al. Towards multidimensional radiotherapy (MD-CRT): biological imaging and biological conformality. Int J Radiat Oncol Biol Phys 2000; 47: 551–60
- Chao KSC, Bosch WR, Mutic S, Lewis JS, Dehdashti F, Mintun MA, et al. A novel approach to overcome hypoxic tumor resistance: Cu-ATSM-guided intensity-modulated radiation therapy. Int J Radiat Oncol Biol Phys 2001; 49: 1171–82
- Toma-Daşu I, Daşu A, Karlsson M. The relationship between temporal variation of hypoxia, polarographic measurements and predictions of tumour response to radiation. Phys Med Biol 2004; 49: 4463–75