Abstract
There is an increased interest in estimating the induction of cancers following radiotherapy as the patients have nowadays a much longer life expectancy following the treatment. Clinical investigations have shown that the dose response relationship for cancer induction following radiotherapy has either of two main characteristics: an increase of the risk with dose to a maximum effect followed by a decrease or an increase followed by a levelling-off of the risk. While these behaviours have been described qualitatively, there is no mathematical model that can explain both of them on mechanistic terms. This paper investigates the relationship between the shape of the dose-effect curve and the cell survival parameters of a single risk model. Dose response relationships were described with a competition model which takes into account the probability to induce DNA mutations and the probability of cell survival after irradiation. The shape of the curves was analysed in relation to the parameters that have been used to obtain them. It was found that the two main appearances of clinical data for the induction of secondary cancer following radiotherapy could be the manifestations of the particular sets of parameters that describe the induction of mutations and cell kill for fractionated irradiations. Thus, the levelling off appearance of the dose response curve could be either a sign of moderate to high inducible repair effect in cell survival (but weak for DNA mutations) or the effect of heterogeneity, or both. The bell-shaped appearance encompasses all the other cases. The results also stress the importance of taking into account the details of the clinical delivery of dose in radiotherapy, mainly the fractionated character, as the findings of our study did not appear for single dose models. The results thus indicate that the shapes of clinically observed dose response curves for the induction of secondary cancers can be described by using one single competition model. It was also found that data for cancer induction may be linked to in vivo cell survival parameters that may be used for other modelling applications.
The increased success of radiotherapy (alone or in combination with other forms of treatment) has led to an increase in the life expectancy for many patients and especially for children who may live for decades after treatment. This success is achieved through advanced treatment techniques such as intensity modulated radiation therapy (IMRT) and conformal radiotherapy techniques (CRT) which result in quite different patterns of irradiation of the healthy tissues. Thus, IMRT causes relatively large volumes of healthy tissues to be irradiated with low doses of radiation, while the conformation of the dose to the target in CRT means that only small volumes of tissue surrounding the clinical target volume are irradiated but not always with very low doses. As the risks for stochastic effects associated with these techniques may not be the same Citation[1], Citation[2] it may therefore be necessary to evaluate the various treatment plans not only from the point of view of the local control and deterministic complications in the normal tissues (as it is largely done today), but also with respect to the stochastic effects which may appear. Indeed there have been several proposals that the risk of cancer induction should be used as further criteria for the ranking of treatment plans along with the estimation of the deterministic effects Citation[3–8]. This however requires the use of reliable models and accurate parameters which may not always be extracted from the experimental studies.
Most models put forward for this purpose are based on the competition between cell survival and induction of DNA mutations which has been suggested a long time ago Citation[9–11]. The traditional expectation of the competition is a bell-shaped curve reflecting an increase of the risk with dose to a maximum effect followed by a decrease as for higher doses the obviously rising incidence with dose is counteracted by the falling number of surviving cells which eventually appears as a falling incidence of the effect.
Studies of cancer induction after radiotherapy have however shown that the process can generally be described as having either of two main characteristics. Thus, it has been observed that the dose effect curve may have a bell shape with a maximum in a narrow dose window Citation[4], Citation[12], or alternatively, the dose effect curve might increase at low doses and then level-off at least for a relatively broad range of doses Citation[13]. Both these behaviours have been described mainly qualitatively, but to the best of our knowledge no mathematical model has been put forward to explain both appearances on mechanistic grounds.
Generally it has been suggested that the plateau behaviour is the result of increased cell survival, but in the light of the competition between cell kill and induction of DNA mutations, a higher cell survival would only mean that the incidence will continue to rise with dose and that the peak in effect will be reached at higher doses. Therefore, other reasons could be put forward for the shape of the risk curve. Among them one could count the hyperradiosensitivity observed at low doses and thought to illustrate the inducibility of the cellular repair mechanisms Citation[14] as well as the heterogeneity specific to large biological datasets. With respect to the latter aspect, it has indeed been shown that taking heterogeneity into account for other radiotherapy applications influences very much the evaluation of clinical data Citation[15].
This paper aims to investigate the above-mentioned aspects of cell survival and induction of DNA mutations as well as particular features of radiation treatment such as fractionation in relation to their influence on the theoretical predictions for the risk of cancer induction. It will also deal with the relationship between the parameters of the cell survival or DNA mutations model and the clinical observations for the appearance of secondary cancers after radiotherapy.
Materials and methods
The theoretical predictions for the risk of cancer following radiotherapy were analysed with a modified version of the UNSCEAR LQ-based model for cancer induction Citation[16] which has previously been successfully used to predict the risk of secondary cancers for several sites Citation[8]. Thus, for fractionated treatments the risk is thought to be given by Equation 1:1 where D is the total dose given in n fractions. It has to be mentioned that the fractionated delivery of radiation is an aspect usually ignored for the estimation of the cancer risk from radiotherapy.
As with the UNSCEAR model Citation[16], the first term of the product in Equation 1 describes the induction of DNA mutations and the second term describes the cell survival. Furthermore, for very low doses the dose-effect relationship can be approximated as being linear with the slope α1, as the exponential term in Equation 1 is almost unity and the quadratic term in the DNA mutation factor can be neglected. Thus, the model is compatible with the linear risk model valid for low doses and the α1B parameter may be assumed to be equal to the risk coefficients found in epidemiological studies with low doses or recommended by international committees such as ICRP Citation[17].
Equation 1 can be modified to take into account the inducible repair effect which manifests itself as a region of high radiosensitivity to low doses in the survival response of mammalian cells. Thus, instead of the LQ model Citation[18–20] which has been proven to fail to describe the response of tissues at very low doses, one could use the alternative linear quadratic model with inducible repair (LQ/IR) proposed by Joiner and Johns Citation[21] which takes into consideration the preparedness of the cellular repair mechanisms for dealing with the DNA damage inflicted by radiation (Equation 2).2 where d is the radiation dose, αR and β are the classical LQ parameters, DC is a parameter describing the efficiency of the activation of repair at low doses and IRR or inducible repair ratio is a measure of the total inducibility of the repair mechanism. The DC parameter was observed to vary little around 0.2 Gy and it has relatively little influence on the general shape of the cell survival curve. IRR on the other hand is very important for the shape of the cell survival curve at low doses and it was found to have almost any value between 1 and 20 or even more Citation[14].
The LQ/IR model and the LQ model diverge only in the predictions for effects at low doses (below 1 Gy or even 0.5 Gy). However, bearing in mind that the doses received by the healthy tissues are considerably lower than the therapeutic doses and that these doses are the result of repeated delivery of fractional doses which quite often are below 1 Gy, it seems that inducible repair may indeed play an important role for the induction of cancer.
In order to investigate the influence of parameter heterogeneity, we have assumed that the individual values are log-normally distributed around a central value. For ease of calculation we have further assumed that the distribution was discrete, each individual value in the distribution having an associated weight wiB, given by the normalised probability distribution function. The resolution of the discrete distribution was fine enough to minimise the differences from using a continuous distribution. The final dose effect curve was then calculated as the weighted average of the dose effect curves corresponding to the individual values in the distribution.3 where Effecti is the corresponding dose effect curve for the parameter having the weight wi.
Results and discussion
The influence of inducible repair
We have first considered the case when cell survival is described by the inducible repair model (Equation 2), while the induction of DNA mutations is described by the classical LQ equation. shows the risk predictions for fairly resistant tissues (SF2=70%) with different α/β values. The chosen α/β values cover the interval of values that have been observed experimentally in functional assays Citation[22] for most of the tissues at risk in the ICRP Publication 60 Citation[17]. It appears that the risk predictions for most tissue types seem to level off for a large range of total doses if the inducible repair ratio IRR for cell survival is moderate to high (between 3 and 8). The variations from a purely flat response are very small and therefore not likely to be observed in a reasonably sized epidemiological study. It has to be stressed here that the flattening feature appears only for fractionated treatments, the curve for single doses being bell-shaped. This difference is indeed expected as for fractionated treatments the effect is the result of adding many fractional doses with a magnitude in the dose range where the inducible repair process manifests itself.
Figure 1. Risk predictions according to the competition model for various assumptions regarding the magnitude of the inducible repair for cellular survival. Upper panel α/β = 10 Gy; middle panel α/β = 5 Gy; lower panel α/β = 3 Gy. (α1=0.05 Gy−1, SF2=70%, IRR1=1)
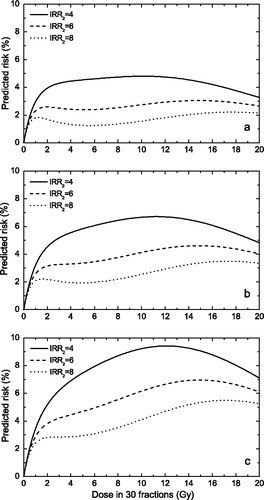
The results in therefore suggest that the levelling off of the risk for cancer induction might be a manifestation of the inducible repair effect. This feature seems to appear only for tissues with moderate to high α/β values with intrinsic radiosensitivities within a narrow widow around SF2=70%. For the more resistant tissues, the dose effect curve increases continuously as more cells with DNA mutations survive the radiation dose, while for the less resistant tissues, the cell killing quickly overcomes the DNA mutation term and the dose response curve has a maximum effect appearance. It has to be mentioned that it has previously been suggested that the levelling off feature might be a manifestation of particularly high cellular radioresistance Citation[1], Citation[2]. Our results however suggest that extremely high cellular radioresistance might not lead to a flattening of the dose response curve. Furthermore, radioresistance by itself might not be enough to explain the shape of the dose response curve and that radioresistance also has to be associated with inducible repair as illustrated in .
While the appearance of the inducible repair for cellular survival has been seen in vitro in a wide range of cell lines using single dose experiments Citation[14], Citation[23–30] as well as for fractionated experiments in vivo, both in animal and in human tissues Citation[21], Citation[31–34], comparatively little is known about its appearance for DNA mutations. In fact, quite little data exists for chromosome aberrations at very low doses to give a definitive answer to this question. However, a study by Gershkevitsh et al. Citation[35] has recently shown data for chromosome aberrations following prostate radiotherapy with fractionated treatments that has an appearance characteristic to the inducible repair effect. This does not appear for all the data sets shown in their study, but given the large variability of biological data it does suggest that inducible repair might appear for chromosome aberrations as well. In fact, as inducible repair is a manifestation of the cellular repair mechanisms for DNA damage Citation[14], Citation[36], Citation[37], there is no reason why it should appear for cell survival but not for DNA mutations.
In this light we have also considered the case when both the cell survival term and the DNA mutations term are described by the inducible repair model. shows that the levelling off feature disappears rapidly if the inducible repair ratio for DNA mutations is larger than 2 or 3 and that the dose effect curve gains a bell-shaped appearance. We have also studied the case when the inducible repair model describes the DNA mutations term, while cellular survival is described by the classical LQ model. However, the dose effect curve in this case only had a bell-shaped appearance (data not shown).
Figure 2. Risk predictions according to the competition model for various assumptions regarding the magnitude of the inducible repair for induction of DNA mutations. Upper panel α/β = 10 Gy; middle panel α/β = 5 Gy; lower panel α/β = 3 Gy. (α1=0.05 GyP−1P, SF2=70%, IRRB2=6)
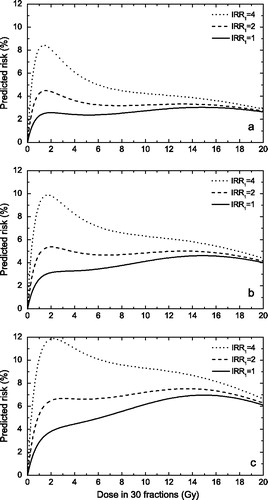
Our results therefore seem to suggest that the levelling off feature may be a manifestation of the inducible repair effect in cell survival. If considerable inducible repair exists for both DNA mutation and cell survival or at least for DNA mutations, the dose effect curve for the risk of cancer induction has a bell-shaped appearance. The same is true if inducible repair is very weak in both terms (classical LQ case). If however cell survival is characterised by moderate inducible repair (IRR between 4 and 6) and DNA mutations by very weak inducible repair, then the dose effect curve has the levelling off appearance.
These findings also suggest that treating radiation induced DNA mutations and radiation induced cell killing as equally radiosensitive may not be correct, even though both are related to DNA damage. It depends on the accident that “radiation induced” is a univocal linguistic coincidence, whereas the two processes might not be simply or directly linked. This is not surprising taking into consideration the fact that cell survival is a manifestation of non-viable repair of DNA damage, while cancer inducing mutations are the result of misrepair of DNA lesions. Thus, it may seem reasonable not to try and relate parameters characterising these two processes.
The influence of parameter heterogeneity
Clinical data on cancer induction from radiotherapy are the result of several thousands (up to hundreds of thousands sometimes) of patients and therefore heterogeneity in the individual radiosensitivity has to be taken into consideration as a possible parameter that may influence the appearance of the dose response curve. The influence of the heterogeneity of intrinsic radiosensitivity is illustrated in . Thus it seems that for fairly resistant tissues (distributions centred on SF2=70%), a wide distribution of the parameters (coefficient of variation above 40 – 50%) could result in a flattening of the dose effect curve over a relatively broad dose range. Such widths of the distribution are within the experimental observations, as for example a study of intrinsic radiosensitivities of patient biopsies has yielded coefficients of variation as large as 43% Citation[38]. This study included inter-laboratory variations that lead to a broadening of the distribution of parameters, but they simulate very well the variability of data that might be expected from multi-centre data such as analyses of induction of second cancers. The flattening of the dose response curve also appeared for a combination of inducible repair and heterogeneity in radiosensitivity, but for reduced magnitudes of these two features compared to the case when they were considered individually.
Figure 3. Risk predictions according to the LQ-based competition model for various assumptions regarding the heterogeneity of cellular radiosensitivity. Upper panel α/β = 10 Gy; middle panel α/β = 5 Gy; lower panel α/β = 3 Gy. (αB1B=0.05 Gy−1P, SF2=70%).
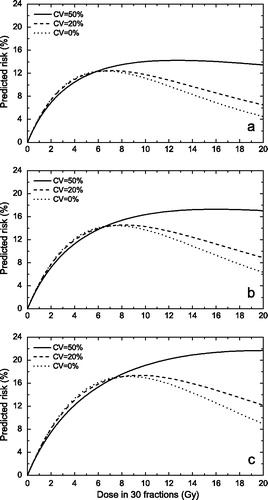
It has to be stressed again that the flattening feature in appears only if the equation for fractionated treatments is used, the curve for single doses having a bell-shaped appearance. It was further found that for distributions of values centred on SF2=50%, the dose effect curve failed to show a levelling-off for reasonable heterogeneity (data not shown), suggesting that the levelling off feature is particular to fairly radioresistant tissues.
The choice of parameters
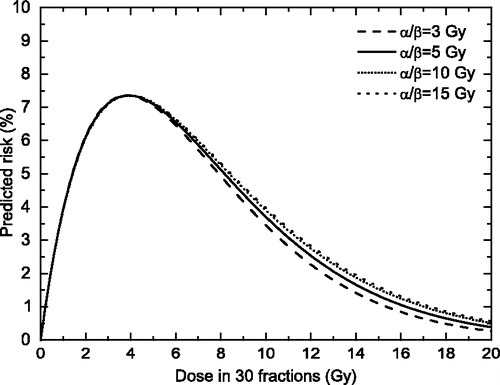
We have also investigated the relationship between the shape of the dose-response relationship and some other parameters in Equation 1. A first choice was the α/β ratio, as this parameter describes the curvature of the LQ cell survival curve. We have therefore tested the appearance of the dose effect curve given by Equation 1 for a wide range of α/β values while assuming a cell survival compatible with a maximum dose around 4 – 5 Gy, as seen in epidemiological studies Citation[12]. We have however found that the α/β parameter seems to have little influence on the risk curve (), this suggesting that the levelling off appearance of some clinical data may not be related to the curvature of the cell survival curve.
Figure 4. Risk predictions according to the LQ-based competition model for various assumptions regarding the α/β values. (αB1B=0.05 Gy−1, αB2B=0.25 Gy−1)
It should also be interesting to investigate the relationship between the parameters in Equation 1 and the position of the maximum of the risk curve. The “optimal dose” for which the maximum of the dose effect curve is seen can be found mathematically as the solution of the equation:4 where D is the total dose.
For the case when the effect is given by Equation 1, one obtains, after some mathematical manipulation of Equation 4, including the rewriting of the beta parameters of the LQ model as a function of the alpha and (α/β) parameters:5 where Dopt is the total “optimal dose” given in n fractions. It is important to mention here that according to Equation 5 the position of the maximum of the dose effect curve does not depend on the low dose slope of the process of inducing DNA mutations (α1). Thus, it may seem that the position of the maximum of the dose response curve is mainly the effect of cellular survival.
Equation 5 also suggests that one can use the dose effect curve for cancer induction for the derivation of in vivo cell survival parameters. This is quite an interesting perspective as there is a need for in vivo parameters, because most of the cell survival parameters available now have been determined in vitro and they cannot always be used for modelling of the in vivo effects.
One important question arises with respect to the choice of parameters in Equation 5. While the (α/β)2B parameter describing cell survival is usually known from functional assays for acute or late effects following irradiation Citation[22], little can be said about the (α/β)1 parameter describing the induction of DNA mutations. If the α/β value is a measure of the efficiency of the repair of sublethal DNA damage, as both DNA mutations and cell survival are related to DNA damage, one could in principle use the same value for (α/β)1 and (α/β)2. The matter needs further investigation, but if it proves to be true one can therefore use clinical data for cancer induction for easy determination of in vivo cell survival parameters.
Conclusions
We were able to describe the two main appearances of clinical data for cancer induction of secondary cancer following radiotherapy by using one single model based on the linear quadratic model with inducible repair (Equation 2). The appearances were found to be the manifestations of the parameters of the model. Thus, the levelling off appearance of the dose response curve could be either a sign of moderate inducible repair effect in cell survival (but weak for DNA mutations), or the effect of heterogeneity, or both. The maximum effect appearance encompasses all the other cases. As the levelling off appeared for relatively high radioresistances in both the described cases, we also concluded that its appearance in clinical data might be an indication of fairly resistant tissues. More research is however needed in order to clarify the details of the relationship between cell survival and DNA mutations. However, our modelling has suggested quite an interesting hypothesis which may be opened for investigation.
Furthermore, the results stress the importance of taking into account the details of the clinical delivery of dose in radiotherapy, mainly the fractionated character, as the findings of our study did not appear for single dose models.
We were also able to link clinical data for cancer induction to in vivo cell survival parameters that may be used for other applications such as the simulation of the tissue response to radiation for the biological evaluation of treatment plans.
We are grateful to Professor Jack Fowler for stimulating discussions.
References
- Hall EJ, Wuu CS. Radiation-induced second cancers: the impact of 3D-CRT and IMRT. Int J Radiat Oncol Biol Phys 2003; 56: 83–8
- Hall EJ., Henry S. Kaplan Distinguished Scientist Award 2003. The crooked shall be made straight; dose-response relationships for carcinogenesis. Int J Radiat Biol 2004; 80: 327–37
- Bhatia S, Robison LL, Oberlin O, Greenberg M, Bunin G, Fossati-Bellani F, et al. Breast cancer and other second neoplasms after childhood Hodgkin's disease. N Engl J Med 1996; 334: 745–51
- Epstein R, Hanham I, Dale R. Radiotherapy-induced second cancers: are we doing enough to protect young patients?. Eur J Cancer 1997; 33: 526–30
- Schneider U, Lomax A, Lombriser N. Comparative risk assessment of secondary cancer incidence after treatment of Hodgkin's disease with photon and proton radiation. Radiat Res 2000; 154: 382–8
- Lindsay KA, Wheldon EG, Deehan C, Wheldon TE. Radiation carcinogenesis modelling for risk of treatment-related second tumours following radiotherapy. Br J Radiol 2001; 74: 529–36
- Miralbell R, Lomax A, Cella L, Schneider U. Potential reduction of the incidence of radiation-induced second cancers by using proton beams in the treatment of pediatric tumors. Int J Radiat Oncol Biol Phys 2002; 54: 824–9
- Daşu A, Toma-Daşu I, Olofsson J, Karlsson M. The use of risk estimation models for the induction of secondary cancers following radiotherapy. Acta Oncol 2005; 44: 339–47
- Gray LH. Radiation biology and cancer In: Cellular radiation biology: A symposium considering radiation effects in the cell and possible implications for cancer therapy. Baltimore: The Williams and Wilkins Company; 1965. p 7–25.
- Upton AC. Radiobiological effects of low doses. Implications for radiological protection. Radiat Res 1977; 71: 51–74
- Mole RH. Dose-response relationships. Radiation carcinogenesis: epidemiology and biological significance, JD Boice, JF Fraumeni, Jr. Raven Press, New York 1984; 403–20
- Dörr W, Herrmann T. Cancer induction by radiotherapy: dose dependence and spatial relationship to irradiated volume. J Radiol Prot 2002; 22: A117–A121
- Tucker MA, Jones PH, Boice JD, Jr, Robison LL, Stone BJ, Stovall M, et al. Therapeutic radiation at a young age is linked to secondary thyroid cancer. The Late Effects Study Group. Cancer Res 1991; 51: 2885–8
- Joiner MC, Marples B, Lambin P, Short SC, Turesson I. Low-dose hypersensitivity: current status and possible mechanisms. Int J Radiat Oncol Biol Phys 2001; 49: 379–89
- Daşu A, Toma-Daşu I, Fowler JF. Should single or distributed parameters be used to explain the steepness of tumour control probability curves?. Phys Med Biol 2003; 48: 387–97
- UNSCEAR Sources and Effects of Ionising Radiation 1993 Report to the General Assembly, with annexes New York: United Nations;1993.
- ICRP. ICRP Publication 60:1990 Recommendations of the International Commission on Radiological Protection. Annals of the ICRP 1991; 21: 1–202
- Kellerer AM, Rossi HH. The theory of dual radiation action. Curr Top Radiat Res Q 1972; 8: 85–158
- Chadwick KH, Leenhouts HP. A molecular theory of cell survival. Phys Med Biol 1973; 18: 78–87
- Douglas BG, Fowler JF. Fractionation schedules and a quadratic dose-effect relationship. Br J Radiol 1975; 48: 502–4
- Joiner MC, Johns H. Renal damage in the mouse: the response to very small doses per fraction. Radiat Res 1988; 114: 385–98
- Thames HD, Hendry JH. Fractionation in radiotherapy. Taylor & Francis, London, New York, Philadelphia 1987
- Marples B, Joiner MC. The response of Chinese hamster V79 cells to low radiation doses: evidence of enhanced sensitivity of the whole cell population. Radiat Res 1993; 133: 41–51
- Lambin P, Marples B, Fertil B, Malaise EP, Joiner MC. Hypersensitivity of a human tumour cell line to very low radiation doses. Int J Radiat Biol 1993; 63: 639–50
- Wouters BG, Skarsgard LD. The response of a human tumor cell line to low radiation doses: evidence of enhanced sensitivity. Radiat Res 1994; 138: S76–S80
- Singh B, Arrand JE, Joiner MC. Hypersensitive response of normal human lung epithelial cells at low radiation doses. Int J Radiat Biol 1994; 65: 457–64
- Wouters BG, Sy AM, Skarsgard LD. Low-dose hypersensitivity and increased radioresistance in a panel of human tumor cell lines with different radiosensitivity. Radiat Res 1996; 146: 399–413
- Marples B, Adomat H, Koch CJ, Skov KA. Response of V79 cells to low doses of X-rays and negative π-mesons: clonogenic survival and DNA strand breaks. Int J Radiat Biol 1996; 70: 429–36
- Wouters BG, Skarsgard LD. Low-dose radiation sensitivity and induced radioresistance to cell killing in HT-29 cells is distinct from the “adaptive response” and cannot be explained by a subpopulation of sensitive cells. Radiat Res 1997; 148: 435–42
- Short S, Mayes C, Woodcock M, Johns H, Joiner MC. Low dose hypersensitivity in the T98G human glioblastoma cell line. Int J Radiat Biol 1999; 75: 847–55
- Joiner MC, Denekamp J, Maughan RL. The use of ‘top-up’ experiments to investigate the effect of very small doses per fraction in mouse skin. Int J Radiat Biol 1986; 49: 565–80
- Beck-Bornholdt H-P, Maurer T, Becker S, Omniczynski M, Vogler H, Würschmidt F. Radiotherapy of the rhabdomyosarcoma R1H of the rat: hyperfractionation-126 fractions applied within 6 weeks. Int J Radiat Oncol Biol Phys 1989; 16: 701–5
- Hamilton CS, Denham JW, O'Brien M, Ostwald P, Kron T, Wright S, et al. Underprediction of human skin erythema at low doses per fraction by the linear quadratic model. Radiother Oncol 1996; 40: 23–30
- Turesson I, Johansson K-A, Nyman J, Flogegard M, Wahlgren T. A clinical study on the effect of low dose per fraction. Radiother Oncol 1998; 48((Suppl 1))S4
- Gershkevitsh E, Hildebrandt G, Wolf U, Kamprad F, Realo E, Trott KR. Chromosomal aberration in peripheral lymphocytes and doses to the active bone marrow in radiotherapy of prostate cancer. Strahlenther Onkol 2002; 178: 36–42
- Joiner MC, Lambin P, Malaise EP, Robson T, Arrand JE, Skov KA, et al. Hypersensitivity to very-low single radiation doses: Its relationship to the adaptive response and induced radioresistance. Mutat Res 1996; 358: 171–83
- Robson T, Joiner MC, Wilson GD, McCullough W, Price ME, Logan I, et al. A novel human stress response-related gene with a potential role in induced radioresistance. Radiat Res 1999; 152: 451–61
- West CM, Davidson SE, Roberts SA, Hunter RD. The independence of intrinsic radiosensitivity as a prognostic factor for patient response to radiotherapy of carcinoma of the cervix. Br J Cancer 1997; 76: 1184–90