Abstract
That three dimensional (3D) planning for radiation therapy (RT) of carcinoma of the prostate (CaP) improves radiation dosimetry to the tumour and reduces dose to the rectum and bladder compared with 2D planning, has not been properly evaluated. We addressed this by downloading the CT data files of twenty-two patients who had completed 2D planned RT for CaP onto a 3D planning system and re-planning RT using the same four field technique and dose prescription as the 2D technique. The radiation dose at 100%, 90%, 50% and 0% volumes (D100, D90, D50 and D0) of the Dose Volume Histograms (DVH's) of the GTV, PTV, rectum and bladder, the area under the curves of each DVH and the field sizes were evaluated and compared between the two sets of plans. Repeated measured t-tests were used to compare the means of the different measurements. The D100, D90 and D50 of the GTV, PTV and rectum were increased for the 3D versus the 2D plans (p < 0.05 for each parameter). The area under the rectal DVH was also greater for the 3D plans (p < 0.05). These changes are attributable to the larger field sizes, particularly the length in the 3D compared with the 2D plans.
External beam radiotherapy for localised prostate carcinoma is well recognised to be associated with late treatment related morbidity, most commonly bowel and sexual dysfunction, rectal bleeding and to a lesser extent urinary difficulties Citation[1]. These treatment related sequelae have been well documented for radiation therapy (RT) planned and delivered using a two dimensional (2D) technique Citation[2,3]. The planning and delivery of RT using three dimensional (3D) methodology such as 3D conformal RT (3D CRT) have been reported not only to reduce radiation doses to surrounding critical structures, Citation[4–6] but also to improve tumour dosimetry compared with 2D RT based on mathematical modelling (ADAC Pinnacle 2001). Whilst patients with localised prostate cancer treated with 3D CRT have been reported to experience less late diarrhoea and rectal bleeding compared with those treated with 2D RT Citation[7,8], it has recently been reported that other bowel sequelae, such as urgency of defecation and faecal incontinence may not be improved Citation[9]. The premise that 3D CRT results in better radiation dosimetry to the tumour volume, whilst reducing radiation dosage to the surrounding critical structures, such as the rectum and bladder to a greater extent than 2D RT, has not been adequately evaluated. There is a paucity of studies specifically designed to address the hypothesis. In addition, the only previous study to directly compare the 2D and 3D plans of the same patients with localised prostate cancer Citation[6] suffer from the limitation of small subject numbers and different radiation field arrangements for the two planning techniques. Therefore, this study was performed on a larger number of patients who have already completed RT using a 2D technique with the aim of comparing radiation dosimetry and dose volume histograms of the tumour volume, rectum and bladder when the treatment was re-planned using 3D methodology with the same radiation field arrangement as the 2D treated patients. However, radiation field sizes for the 3D plans were based on the observed PTV after expansion of the GTV and MLC's based shielding to reduce the radiation dose to the surrounding critical structures.
The hypotheses tested for this study were that 3D planned RT would result in:
improved radiation dosimetry to the prostate tumour tissue represented by the GTV and the PTV,
less radiation exposure to surrounding critical structures, specifically the rectum and bladder, compared with 2D planned RT.
Material and methods
The design of the study was based on same subject repeated measures. Selected subjects who had completed 2D RT had their treatment re-planned using a 3D technique (using the ADAC Pinnacle Planning System, Philips) with the same CT data files, thus minimizing the effect of potential confounding variables, such as, varying CT slice thickness and differing contrast used to define the bladder between the 2D and 3D planning techniques.
Subjects
Subjects for the study were selected from those who participated in a Phase III randomised radiation dose fractionation trial for the RT of localised prostate cancer using a 2D technique Citation[3]. The eligibility criteria for entry into the study included patients with localised (TNM stage T1/2N0M0) prostate cancer, a serum PSA of ≤ 80µ/L and with no previous exposure to androgen suppression therapy. A three or four field technique was used to deliver a prescribed dose to the isocentre of either 64 Gray (Gy) in 32 fractions (#) over six and a half weeks or 55 Gy in 20# over four weeks. The choice of a three or four field plan depended on anatomical considerations, such as the shape of the prostate and technical factors such as the need to avoid irradiation through the hip joints e.g. in patients with hip prostheses Citation[3]. As the latter factor particularly would have confounded the dosimetric evaluation, only patients treated with a four-field plan were selected for this study.
CT data files of 53 patients were still available of which 34 patients had RT planned with a four-field technique. Of these, eight subjects had corrupted data, which could not be downloaded onto the 3D planning system. Two dimensional treatment information was not available on another four subjects at the time of the data collection. Therefore, 22 subjects of the 34 eligible for the study were able to be included in this study.
The mean age of these subjects was 70 (s.d.±6.5) years and the mean weight was 81.7 (s.d.±15.3) kilograms (kg). The tumour stage for six of the subjects was T1 and for the other sixteen it was T2. Fourteen subjects received a prescription of 64 Gray (Gy) in 32 fractions over 6.5 weeks, while eight subjects received a prescription of 55 Gray in 20 fractions over 4 weeks.
Methodology
The CT data files of the patients, which were based on 16×1 cm CT slices centered at the symphysis pubis and extended at least 3 cm above and below the diagnostic CT scan limits of the prostate gland (each patient recruited into the Phase III randomised radiation dose fractionation trial had a diagnostic CT scan of the abdomen and pelvis as part of the TNM staging work-up), were downloaded onto our 3D planning system (ADAC Pinnacle, Philips). The GTV (defined as the entire prostate gland, but not the seminal vesicles), as well as the bladder and rectal volumes were then contoured independently by two of the authors (CS and EY) for the first 10 patients and by one of the authors (CS) only for the remaining patients after a validity study had shown excellent correlation of the contoured volumes between the two authors (CS and EY). The experimental protocol of not including the seminal vesicles in the GTV was subsequently justified by the interim analysis of our Phase III radiation dose fractionation trial which reported that the great majority of patients had low or intermediate risk disease and were thus not expected to have involvement of the seminal vesicles Citation[3]. The rectum and bladder were outlined as hollow organs, two centimetres superior and two centimetres inferior to the GTV. The contouring of these critical normal structures was not extended beyond 2 cm superiorly and inferiorly because reconstruction of the 2D plans in the patients was based on the radiation beam parameters for each of the four fields used in treatment, a 1.5 cm margin having been applied around the anterior, posterior and lateral edges of the prostate gland on each 1 cm CT slice. A composite PTV in the transverse and coronal planes was thus derived but in the sagittal plane, the length of each of the radiation beams was determined by ensuring that the 50% isodose extended 2 cm above and below the superior and inferior limits of the prostate gland respectively. The PTV in the 2D reconstructed plans was defined as the 95% isodose contour around the prostate (GTV). The PTV of the 3D plans was produced using the expanding function on the Pinnacle planning system to enable a margin to be added to an already existing volume. In this case, the PTV was produced by adding a 1.5 cm margin to the GTV. Two dimensional and 3D plans of the patients with respect to the GTV, the PTV and the rectum and bladder were used to evaluate and compare the Dose Volume Histograms (DVH's).
Specific comparisons between the 2D and 3D plans was made for the dosage received by the 100%, 90%, 50% and 0% volumes of interest (D100, D90, D50 and D0) for GTV, PTV, bladder and rectum () by calculating the means of the radiation doses of each volume of interest for the 2D and 3D plans in the patients. The area under the curves of the DVH's measured as the dosage in Grays (Gy) times centimetre cubed between the 2D and 3D plans () was also evaluated. The areas were calculated using standard mathematical procedures based on the summation of 200 small sectors enveloped by the DVH curves. The radiation field areas of the 2D and 3D plans for each of the four radiation beam directions, anterior posterior (AP), posterior anterior (PA) right lateral (RLat) and left lateral (LLat) without shielding were calculated by multiplying the width by the length of each beam. The radiation field volumes of the 2D plans were then determined by first multiplying the width by the length of each lateral beam minus any anterior shielding to exclude small and large intestinal loops (8 patients only had anterior shielding, none had posterior field shielding) and then multiplying the product by the width of the anterior beam Citation[3]. The 3D radiation field volumes were derived by creating a region of interest at the edge of the MLC's on each CT slice on the ADAC Pinnacle planning system and instructing the programme to compute the total volume of the region of interest.
Figure 1. DVH's of the bladder, the rectum and the GTV of 2D treated patient replanned using 3D methodology. The y-axis represents the normalised volume. The x-axis represents the dose measured in Gray (Gy).Where the thick black horizontal line (a) intersects the GTV (d), the bladder (c) and the rectum (b) curves is 100% of these volumes, so where the thick black vertical lines cut the x-axis is the dose received at 100% of the volumes of interest. Where the thick blue horizontal line (e) intersects the GTV (h), the bladder (g) and the rectum (f) curves is 90% of these volumes, so where the thick blue vertical lines cut the x-axis is the dose received at 90% of the volumes of interest. Where the thick red horizontal line (i) intersects the GTV (l), the bladder (k) and the rectum (j) curves is 50% of these volumes, so where the thick red vertical lines cut the x-axis is the dose received at 50% of the volumes of interest. Zero per cent of the volumes of interest are where the DVH curves cut the x-axis, this is circled in green. The PTV curve was very similar to the GTV curve and was removed from this illustration for the purposes of clarity.
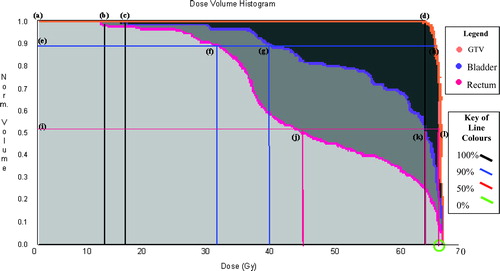
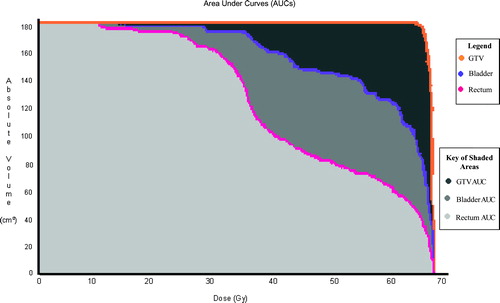
Figure 2. Area under the DVH Curves of 2D treated patient replanned using 3D methodology. The y-axis represents the absolute volume measured in cm3. The x-axis represents the dose measured in Gray (Gy). The area under the pink DVH curve (in light grey) represents the dose gained for the rectal volume. The area under the purple DVH curve (in medium and light grey) represents the dose gained for the bladder volume. The area under the orange DVH curve (in dark, medium and light grey) represents the dose gained for the GTV volume. The PTV curve was very similar to the GTV curve and was removed from this illustration for the purpose of clarity.
Statisical analysis
Repeated measures t tests were used to compare the means of the different measurements of the 2D and 3D plans. A p value of < 0.05 was considered to be significant in the various comparisons.
Results
Contoured volumes
The median GTV defined as the prostate gland only on the CT data files for both the 2D and 3D plans was 64.2 (Range 36.6–106.8) ml.
The median 2D and 3D rectal volumes were 66.2 (Range 32.9–181.7) ml and 89.2 (Range 41.5–218.2) ml respectively.
The median 2D and 3D bladder volumes were 126.7 (Range 71.4–244.3) ml and 133.7 (Range 71.4–268.6) m respectively.
DVH's
Except for 1 patient, wedges were not required to improve the radiation dosimetry of the 2D and 3 plans. There was a significant difference between the D100, D90 and D50 of the GTV's of the 2D and 3D plans, the radiation doses received at these volumes being greater with the 3D technique than the 2D technique (p < 0.05, ). However, no significant difference between D0 doses of the GTV's of the 2D and 3D plans could be shown. There was also a significant difference between the D100, D90 and D50 of the PTV's of the 2D and 3D plans, the radiation doses received at these volumes being again greater with the 3D technique than with the 2D technique (p < 0.05, ). There was also no significant difference between the radiation doses at 0% of the PTV's of the 2D and 3D plans ().
Table I. Dosages received by varying proportions of the GTV when planned using a 2D or 3D technique. No significant difference was detected for the GTV at 0% (D0). However, there were significant differences at 100% (D100), 90% (D90) and 50% (D50) of the GTV.
Table II. Dosages received by varying proportions of the PTV when planned using a 2D or 3D technique. No significant difference was detected for the PTV at 0% (D0). However, there were significant differences at 100% (D100), 90% (D90) and 50% (D50) of the PTV.
Except for the D100 of the bladder DVH which tended to be higher for the 3D plans (p = 0.05), there were no differences in the radiation dose parameters corresponding to the other bladder volumes of the 2D and 3D plans (). In contrast, D100, D90 and D50 of the rectal DVH's were higher for the 3D plans than the 2D plans (). There was, however, no difference between the D0 of the rectal DVH of the two planning techniques ().
Table III. Dosages received by varying proportions of the bladder volume when planned using a 2D or 3D technique.No significant differences were detected for any of the bladder volumes, although the dose received by the100% volume (D100) approached significance (p = 0.05).
Table IV. Dosages received by varying proportions of the rectal volume when planned using a 2D or 3D technique.No significant difference was detected for the rectal volumes at 0% (D0). However, there were significant differences at 100% (D100), 90% (D90) and 50% (D50) of the rectal volumes.
Area under the curve
The area under the contoured rectal volume DVH was significantly greater for the plans using the 3D technique compared with the 2D plans (p < 0.05, ). However, some increase was expected because the increase in D100 for 3D plans will result in larger areas under the curves. There were no other differences in the areas under the curves of the bladder, GTV and PTV contours between the two planning techniques ().
Table V. Areas under curves of the various DVH's when planned using a 2D or 3D technique.No significant differences were detected for the bladder volume, the GTV and the PTV. However, there was a significant difference for the rectum volume.
Field sizes
The radiation field areas in each of the four radiation beam directions, AP, PA, R Lat and L Lat without shielding were significantly larger for the 3D plans compared with the 2D plans (). However, when shielding was taken into account the radiation field volumes were significantly smaller for the 3D versus the 2D plans (). The increased shielding in the 3D plans was insufficient to compensate for the increased field lengths for 3D versus 2D plans [Median 11.6 (Range 9.6–14.6) cm versus 9.25 (Range 8.0–10.5) cm]. Consequently the computed bladder and rectal volumes were greater for the 3D versus the 2D plans even though the radiation treatment volumes were smaller for the 3D versus the 2D plans ().
Table VIa. Field areas for the radiation beam directions (AP, PA, RLat and LLat) when planned using a 2D or 3D technique.Significant differences were detected for all of the four field directions. AP (Anterior-Posterior), PA (Posterior-Anterior), RLat (Right Lateral) and LLat (Left Lateral)
Table VIb. Radiation treatment, rectal and bladder volumes when planned using a 2D or 3D technique.Significant differences were detected for all three volumes.
Discussion
The results of this study essentially indicate that the 3D planning technique improves the radiation dosimetry to the tumour volume by increasing the radiation dose received at the 100%, 90% and 50% (D100, D90 and D50) of both GTV and PTV, but at the expense of increased radiation doses to the rectum at the corresponding rectal volumes and possibly also to the 100% bladder volume. This has important implications in the way the planning and delivery of 3D CRT is approached if the improvement in therapeutic ratio of 3D over 2D radiation treatment of prostate carcinoma is to be realized in clinical practice. Hitherto, there has been no direct comparison of DVH parameters of 2D and 3D planning techniques of localised prostate carcinoma using the same field arrangements and margins around the GTV for the two techniques. A previous study compared 2D, 3D and Intensity Modulated Radiation Therapy (IMRT) planning techniques on the same three patients with localised (T2) prostate carcinoma Citation[6]. With respect to the 2D and 3D planning techniques, the margins around the GTV were less with the 3D technique and the field arrangements were also different with the 3D technique involving a conformal six field beam arrangement compared with the four field “box” technique of the 2D technique in the previous study Citation[6]. These differences account for why the findings of the current study are at variance with those from the previous study Citation[6]. For example, in contrast to the previous study Citation[6], it was found in the current study that the 3D planning technique provided the more uniform dose homogeneity to the PTV. D100, D90 and D50, but not D0 of the PTV were significantly greater for the 3D technique suggesting that dose homogeneity to the PTV is better with this technique compared with the 2D technique since the D0 parameter in our study just represents the maximum dose received by the PTV. The better dose homogeneity with the 3D technique in our study is probably attributable to the same margins allowed for the GTV in the derivation of the PTV as the 2D technique which in turn resulted in the larger field sizes observed for the 3D plans, particularly in relation to the field length. The application of multi-leaf collimators in the 3D technique in this study, whilst reducing the overall radiation treatment volumes, did not appear to adequately compensate for the larger rectal volumes included within the treatment volumes as evidenced by the higher rectal D100, D90 and D50 and greater area under the curve for the rectal DVH's in the 3D compared with the 2D planning technique. It is possible that this may explain why we have recently reported no differences in anorectal toxicity between a similar group of patients planned and treated with the two techniques using identical radiation doses Citation[9]. The larger field sizes resulting from the 3D planning technique suggest that the PTV were not being adequately encompassed by the 2D technique. Hence, the 3D planning technique alone (without radiation dose escalation) could improve local control rates for carcinoma of the prostate, although there is no evidence of this from limited follow-up data of the only randomised study which have reported on local control of 3D versus 2D RT using the same radiation dose schedule Citation[7]. Thus the higher D100, D90 and D50 for the GTV, PTV and rectum and possibly D100 to the bladder in this study is the consignee of the larger field sizes with the 3D planning technique.
The implications of the findings from this study relate to the approach to the planning and treatment delivery of 3D radiation therapy for prostate carcinoma. If the relative simplicity of the 4 field box technique of 2D radiation therapy is to be retained, the margins around the GTV need to be reduced if radiation doses to the rectum are not to increase particularly with the current trend towards radiation dose escalation Citation[10–12]. However, reduction in the PTV margin may result in geographical misses in view of the well-documented movement of the prostate between treatment fractions Citation[13,14] unless the prostate gland is immobilised or the placement of the radiation beams modified at the time of treatment delivery Citation[6,15]. Measures such as distension of the rectum during RT to reduce prostate gland motion are invasive and involve some degree of patient discomfort. An alternative approach to achieving radiation dose homogeneity to the PTV without undue compromise to radiation dose coverage of the PTV would be to use more complex treatment techniques such as the 3D conformal six field technique with angulation of the oblique fields or IMRT techniques Citation[6]. These complex treatment techniques, particularly IMRT, are difficult to verify. Image Guided Radiation Therapy (IGRT) is currently being developed to overcome the problems associated with a moving tumour target such as the prostate, but this has not yet been validated clinically.
In summary, this study has demonstrated that 3D planning for the radiation therapy of prostate cancer using a 4 field technique and 1.5 cm margins around the GTV results in better radiation dosimetry to the PTV as measured by the D100, D90 and D50 relative to 2D planned radiation therapy using the same field arrangement, but at the expense of higher rectal D100, D90 and D50, as well as the area under the rectal DVH and possibly higher bladder D100.
This work was supported by a grant from the Cancer Council of South Australia and would not have been possible without the assistance of Mr Roger Nixon, Planning Coordinator of the Department of Radiation Oncology, Royal Adelaide Hospital who repeatedly retrieved and archived the CT data files of the patients. Ms Sandy Fitton's assistance in the preparation of the manuscript is also acknowledged.
References
- Duchesne G. Prostate Cancer: Treating early-stage disease. Australian Oncology 2002; 5: 12–13
- Yeoh E, Botten R, Russo A, McGowan R, Fraser AC, Roos D, et al. Chronic effects of therapeutic irradiation for prostate carcinoma on anorectal function. Int J Radiat Oncol, Biol, Phys 2000; 47: 915–24
- Yeoh E, Fraser R, McGowan R, Botten R, DiMatteo AC, Roos D, et al. Evidence for efficacy without increased toxicity of hypofractionated radiation therapy for prostatic carcinoma; early results of a Phase III randomised trial. Int J of Radiat Oncol, Biol, Phys 2003; 55: 943–55
- Wu PM, Chua DT, Sham JS, Leung L, Kwong DL, Lo M, et al. Tumour control probability of nasopharyngeal carcinoma: a comparison of different mathematical models. Int J of Rad Oncol, Biol, Phys 1997; 37: 913–20
- Ragazzi G, Cattaneo GM, Fiorino C, Ceresoli G, Verusio C, Villa E, et al. Use of dose-volume histograms and biophysical models to compare 2D and 3D irradiation techniques for non-small cell lung cancer. Br Inst Radiol 1999; 72: 279–88
- Oh CE, Antes K, Darby M, Song S, Starkschall G. Comparison of 2D Conventional, 3D Conformal, Intensity Modulated Treatment Planning Techniques for patients with Prostate Cancer with regards to Target-Dose Homogeneity and Dose to Critical, Uninvolved Structures. Medical Dosimetry 1999; 24: 255–63
- Dearnaley DP, Khoo VS, Norman AR, Meyer L, Nahum A, Tait D, et al. Comparison of radiation side effects of conformal and conventional radiotherapy in prostate cancer: a randomized trial. Lancet 1999; 353: 267–72
- Bey P. 3D-Conformal Radiation Therapy (3D-CRT) of prostate carcinoma. Cancer Radiotherapie 2000; 4(Supp1)113s–8s
- Di Matteo A, Botten R, Holloway R, Fraser R, Yeoh E. Persistent anorectal dysfunction is common despite 3D conformal radiation therapy for prostate carcinoma. J Gastroenterol Hepatol 2003; 18((Supp))B37
- Zelefsky MJ, Liebel SA, Gaudin PB, Kutcher GJ, Fleshner NE, Venkatramen ES, et al. Dose Escalation with Three-Dimensional Conformal Radiation Therapy affects the Outcome in Prostate Cancer. Int J Radiat Oncol, Biol, Phys 1998; 41: 491–500
- Hanks GE, Hanlon AL, Schulteiss TE, Pinover WH, Movsas B, Epstein BE, et al. Dose Escalation with 3D Conformal Treatment: Five Year Outcomes, Treatment Optimisation, and Future Directions. Int J Radiat Oncol, Biol, Phys 1998; 41: 501–10
- Pollack A, Zagars GK, Starkschall G, Antolak JA, Lee JJ, Huang E, et al. Prostate Cancer Dose Response: Results of the M.D. Anderson Phase III Randomised Trial. Int J Radiat Oncol, Biol, Phys 2002; 53: 1097–05
- Ten Kaken R, Foreman J, Heimburger D, Gerharsson A, McShan D, Perz-Tamayo C, et al. Treatment planning issues related to prostate movement in response to differential filling of rectal and bladder. Int J Radiat Oncol, Biol, Phys 1991; 20: 1317–24
- Vigneault E, Pouliot J, Laverdiere J, et al. Electronic portal imaging device detection of radioopaque markers for the evaluation of prostate position during megavoltage irradiation: a clinical study. Int J Radiat Oncol, Biol, Phys 1997; 37: 205–12
- Wu J, Haycocks T, Alasti H, Ottewell G, Middlemiss N, Abdolell M, et al. Positioning errors and prostate motion during conformal prostate radiotherapy using on-line isocentre set-up verification and implanted prostate markers. Radiother Oncol 2001; 61: 127–33