Abstract
Theoretical predictions of cancer risk from radiotherapy may be used as a complementary criterion for the selection of successful treatment plans together with the classical approach of estimating the possible deterministic effects. However, any such attempts must take into consideration the specific features of radiation treatment. This paper explores several possible methods for estimating the risk of cancer following radiotherapy in order to investigate the influences of the fractionation and the non-uniformity of the dose to the irradiated organ. The results indicate that dose inhomogeneity plays an important role in predicting the risk for secondary cancer and therefore for predictive purposes it must be taken into account through the use of the dose volume histograms. They also suggest that the competition between cell killing and the induction of carcinogenic mutations has to be taken into consideration for more realistic risk estimations. Furthermore, more realistic parameters could be obtained if this competition is also included in analyses of epidemiological data from radiotherapy applications.
As more and more data become available regarding the induction of secondary cancers following therapeutic irradiation taking place a relatively long time ago, the interest in predicting the risk for secondary cancers from radiotherapy increases. These predictions may be included in treatment planning as further criteria for the selection of successful plans in addition to the estimation of the possible deterministic effects Citation[1–3]. While the main consideration for the treatment of cancer is the eradication of the tumour, advances in technology have made it possible to deliver curative doses via several plan options that include various beam arrangements as well as different radiation qualities or modalities which result in various levels of irradiation for the healthy organs surrounding the tumour site. Thus new questions have to be taken into consideration about the consequences for secondary cancers of the treatment plans being considered for delivery. Thus, in the light of the competition between induction of carcinogenic mutations and the cellular survival that has been suggested a long time ago Citation[4–6], it may happen that in some situations reducing the dose to avoid the deterministic side effects may lead to an increase in the probability of inducing secondary tumours. This is especially important for intensity modulated radiation treatments (IMRT) where relatively large volumes of healthy tissues are irradiated with low doses of radiation Citation[7], Citation[8]. Alternatively, the young patients treated with radiation may live a long time after the treatment and therefore the incidence of secondary cancers should be included among the long term sequelae Citation[9,10].
There are many epidemiological studies that have investigated the induction of secondary cancers following radiotherapy Citation[9–17], but unfortunately few of them relate the incidence of secondary cancers to the actual dose received by the irradiated organ or address the question of the shape of the dose response curve. Furthermore, even less attention has been paid to the effects of the dose heterogeneity throughout the irradiated organ.
As the ethics of clinical practice suggests, established models should be used for patient related applications. However, the published studies do not cover all the possible cases that may be encountered in clinical practice. Bearing in mind that theoretical modelling requires a general form of equation for the dose response curve instead of the individual relationships available from various studies, one has to make some educated guesses in order to adapt and/or to modify the existing models and risk coefficients. Indeed, most of the available models are valid for low doses and/or low dose rates and they cannot be easily extended to radiotherapy. The difficulties of transfer may originate in the specific features of radiation treatment: high doses and dose rates, fractionated treatments, high non-uniformity of the dose across the irradiated organ, the use of different radiation modalities etc.
In the light of the heterogeneous dose distribution across the organ, several methods for evaluating the risk can be identified. Thus, the full dose volume histogram may be converted into an average organ dose which can then be used together with a linear risk coefficient corrected for dose and dose rate level Citation[1,3]. This simple method may thus make use of the various studies which give a risk coefficient also derived assuming a linear relationship Citation[1,14,18]. On the other hand, one may use a nonlinear “competition model” for the dose response relationship which takes into consideration the competition between induction of carcinogenic mutations and the cellular survival Citation[4–6].
Depending on how the irradiation of the organ is taken into consideration, several methods may thus arise. One of them is to simplify the dose volume histogram to a mean organ dose. Even though it does not take correctly into consideration the non-uniformity of the dose distribution across the irradiated organ Citation[19], this approach was indeed used by Lindsay and co-workers in their theoretical study Citation[2]. A third method of calculation in which one can apply the full dose distribution together with a competition model for a better characterisation of the risk for induction of secondary cancers will be investigated in this paper. By taking several factors into account, this approach is expected to give results that are closer to the real situation than the results from the other methods.
This paper thus aims to compare these three possible methods of calculating the risk in order to investigate the influences of the fractionation and the non-uniformity of the dose to the irradiated organ. The comparison will also refer to clinical data where such data are available. This paper therefore attempts to identify the possible traps and errors the above-mentioned factors might introduce into the calculations.
Materials and methods
Clinical examples of dose volume histograms for three normal tissues (lung, bladder and rectum) resulting from treatment plans from our institution have been selected in order to study the influence of the non-uniformity of the dose to the irradiated organ on the predictions of different methods to calculate the associated risk for secondary cancers. The selected examples do not describe only three different tissues, but they also illustrate actual dose distributions to normal tissues which might be encountered in practice. Thus, the lung corresponds to the case of an organ receiving a very low dose to a rather large volume, the bladder corresponds to the case with an almost equal distribution of volumes in the whole dose range and the rectum corresponds to the case with the organ receiving mainly rather large doses.
Three different methods were used to calculate the risk from the above-mentioned dose volume histograms. The first one involves the reduction of the full dose distribution to an average dose which will then be used with a linear model which assumes a proportional increase of the risk for cancer with the radiation dose (see the section on Risk Models).
Another possible way to calculate the risk is to use the mean organ dose derived from the dose volume histogram in combination with a nonlinear equation which takes into account the competition between induction of mutations and cell survival. This method is thought to lead to erroneous results in some cases as it does not take into consideration the heterogeneity of the dose distribution in the irradiated organ. However, it will be used as an example in order to illustrate the magnitude of the differences between the predictions of this method and the other two methods taken into consideration.
The third method to estimate the risk is to do the calculation with the competition model in every dose interval of the dose volume histogram and then to integrate the result according to the dose distribution (Equation 1).1
where vi is the volume of tissue receiving dose Di given in n individual fractions and Effect (Di) is the nonlinear dose response relationship of the competition model. A modified version of the general equation proposed by UNSCEAR Citation[20] has been used as equation for the competition model (see the section on Risk Models).
Calculations were performed with risk coefficients derived according to the recommendations of the ICRP Publication 60 Citation[21]. Cell survival parameters, especially the α/β values were derived from theoretical analyses of clinical and experimental data Citation[22–24]. Thus, it was assumed that α/β value is 4.5 Gy for lung Citation[22], 7.5 Gy for bladder Citation[22] and 5.4 Gy for rectum Citation[23]. Other cell survival parameters were chosen in agreement with the recent analysis by Zaider et al. Citation[24]. They are thought to give a reasonable cell survival for the dose-range considered.
The results of the calculations were compared to the clinical results published by Inskip et al. Citation[13] for the irradiation of the lung during the treatment for breast cancer and by Boice et al. Citation[11] for the irradiation of the bladder and rectum during pelvic treatments.
Risk models
The first model to be considered for the estimation of the risk for secondary cancers from irradiation was based on a linear (proportional) relationship between effect and dose. Indeed, most of the risk models and coefficients recommended by the national and international organisations are given for very low doses and they assume such a linear relationship. While the validity of the linear model can be debated, no sufficient data exist to prove that it is not applicable for risk estimates Citation[25]. High doses and/or dose rates are usually accounted for by the use of a dose and dose rate factor (DDREF), while still assuming a linear response. Other radiation types are accounted for by the use of a radiation weighting factor (wR) together with the risk factor valid for the linear dependence Citation[21].
While several mathematical models have been suggested to describe the appearance of the radiation-induced cancers when taking into account the competition between the probability of inducing DNA mutations and the probability of survival for the irradiated cells, UNSCEAR Citation[20] has proposed a general equation based on the linear quadratic (LQ) model that takes into consideration both these effects. Thus, total radiation effect in terms of risk is found as the product between these two probabilities (Equation 2):2
where the first term of the product describes the induction of DNA mutations and the second term describes the cell survival. Thus, the equation above gives the risk of mutations in the viable cells after a single dose of radiation D. For very low doses, the quadratic terms in Equation 2 are negligible and the dose-effect relationship can therefore be approximated as being linear, the slope of the curve being α1. Thus, this term may be assumed to be equal to the risk coefficients found from epidemiological studies of irradiated populations with low doses.
If this model is to be used for the prediction of the risk for cancer following radiotherapy, it has to be modified to take into account the fractionated character of the dose delivery. This can be done by assuming the same concept as that behind equation (2), i.e. the total effect is the product of the probability of survival and the probability of inducing DNA mutations. The role of fractionation in influencing the cellular survival has been extensively demonstrated along the years Citation[26]. More recently, it has been shown that similar fractionation or protraction effects also appear for the induction of DNA mutations Citation[5], Citation[27–29]. This is indeed expected as both the DNA mutation and the cell killing are related to DNA damage. Thus, if one assumes that both these processes should be similarly affected by fractionation, the risk for fractionated irradiations might be given by Equation 3:3
where D is the total dose given in n fractions. For very low doses, this equation can also be approximated as being linear, the slope of the curve being α1.
The difference between the risk predictions of the linear (α1 is the linear risk coefficient listed by the ICRP) and the LQ-based competition model (Equations 2 and 3) can be seen in . It was assumed that both processes in Equations 2 and 3 have the same α/β value. While to our knowledge there is no experimental study that has investigated precisely this aspect, we have based our assumption on the similarities between cell kill and induction of mutations, both being manifestations of DNA damage. Keeping in mind that the α/β value is generally correlated to the efficiency of cellular repair mechanisms that deal with the DNA damage inflicted by radiation it may be speculated that the same value characterises both processes under discussion. It should be noted that the theoretical study of Lindsay et al. Citation[2] also employed general parameters and the ratios of the parameters in the two terms of Equation 2 were also equal, though no justification was suggested for their assumption. On the other hand, the influence of the β1 term in Equation 2 is almost negligible and therefore the assumption regarding the α/β value for mutation is not essential for the results with fractionated dose delivery.
Figure 1. The difference between risk prediction of the linear model (dashed line) and the LQ-based competition model for single doses (grey solid line) and fractionated irradiations (black solid line). The linear model appears to be valid only for organ doses below 1 Gy. (α1=0.05 Gy−1, α2=0.25 Gy−1, α/β = 5 Gy)
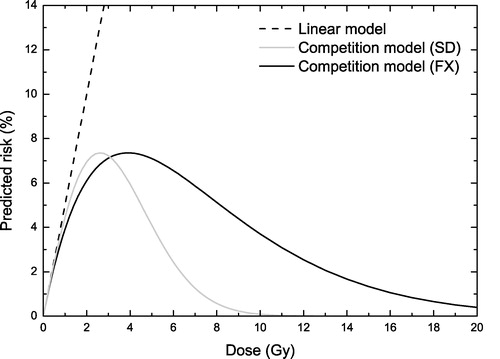
One of the striking features of the curves in is that the predictions of the competition model for fractionated treatments are quite different from the predictions for single doses. This is not unexpected as the fractionated curve includes the effects of dose protraction. Thus, in the low dose range the repair of DNA damage results in less mutations and hence in a reduced risk for cancers. On the other hand, for the high dose range where the dose-response curve is dominated by the cellular survival, the repair of DNA damage causes an increase in cellular survival and therefore an increase of the risk for secondary cancers compared to the single dose case.
The maximum of the curves describing the competition model in is somewhere around 4–5 Gy, being consistent with the behaviour observed in epidemiological studies Citation[16]. The maximum level of risk is about 7% for the general risk coefficient α1=0.05 Gy−1 assumed for the calculations in this figure. This level will however change with the particular assumptions of α1. In these conditions, it may be seen that the use of the linear relationship is appropriate only if the dose to the organ does not exceed about 1 Gy. For higher doses the cell kill becomes important and thus starts to limit the effects of mutations. Neglecting this effect could lead to erroneous results if the total radiation dose were above the interval where the linear approximation is valid.
Results
shows the irradiation of the lung resulting from a breast treatment expressed as dose volume histograms (lower panel) and a comparison with the dose response relationship given by Equation 3 for fractionated irradiations (upper panel). Assuming that the result of the calculation using Equation 3 and the full dose volume histogram is the closest to the real situation, we were able to compare predictions of the other two methods for calculating the risk (). As it was suggested in , the use of the linear approach together with the mean organ dose leads to an overestimation of the predicted risk that is about 4 – 5 times larger than the prediction of the competition model (3.0% vs. 0.7%). While for radiation protection purposes the overestimation of the risk might seem advantageous, for the ranking of treatment plans the precise value plays a very important role as it is supposed to be used for comparisons. Furthermore, the use of the nonlinear Equation 3 together with the mean organ dose leads to higher risk predictions (2%) than the use of the LQ-based competition model (0.7%). The explanation resides in the details of the dose volume histogram (lower panel in ) in comparison to the risk curve (upper panel in ). In this case, both the average dose and the most probable dose received by the organ are smaller than the dose for maximum effect and hence in the region of the predominance of the process of inducing mutations. This leads to relatively small differences (less than one order of magnitude) which could be mistakenly interpreted as small differences between the two models in all cases. This is however not true as it will be shown for other dose distributions ( and ).
Figure 2. Competitive risk model and the irradiation of the lung at a breast treatment with 50 Gy in 25 fractions. Upper panel-the dose response curve of the competitive model for the risk of secondary cancers induction (Equation 3) in the lung. Lower panel-the dose volume histograms for the irradiation of the lung. (α1=0.017 Gy−1, α2=0.25 Gy−1, α/β = 4.5 Gy)
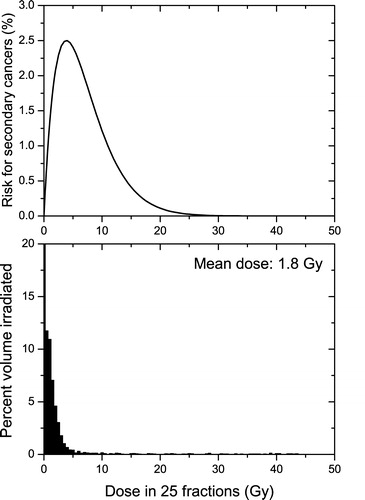
Figure 3. Competitive risk model and the irradiation of the bladder at a prostate treatment with 78 Gy in 39 fractions. Upper panel-the dose response curve of the competitive model for the risk of secondary cancers induction (Equation 3) in the bladder. Lower panel-the dose volume histograms for the irradiation of the bladder. (α1=0.006 Gy−1, α2=0.25 Gy−1, α/β = 5.4 Gy)
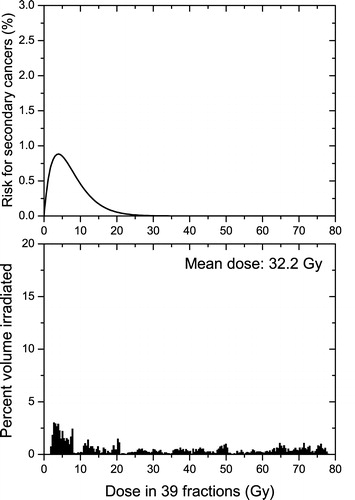
Figure 4. Competitive risk model and the irradiation of the rectum at a prostate treatment with 78 Gy in 39 fractions. Upper panel-the dose response curve of the competitive model for the risk of secondary cancers induction (Equation 3) in the rectum. Lower panel-the dose volume histograms for the irradiation of the rectum. (α1=0.017 Gy−1, α2=0.25 Gy−1, α/β = 4 Gy)
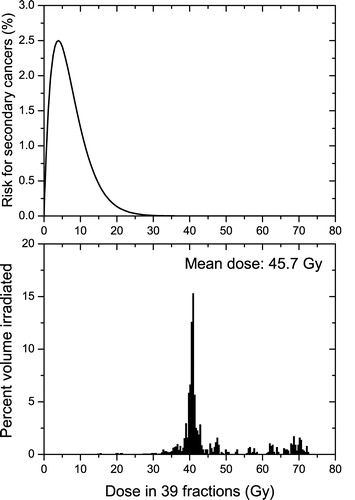
Table I. Risk predictions from different risk models and different methods to deal with dose heterogeneity throughout the irradiated organ and comparisons with clinically observed results.
It would be interesting to compare these theoretical predictions with experimentally derived risk levels. For the particular case of the irradiation of the lung during the treatment for breast cancer, Inskip et al. Citation[13] have concluded that for an average dose of 10 Gy the risk for radiation-induced secondary cancer is around 0.9%. Even if a direct comparison with our results is not straightforward as the treatment plan we have used results in less irradiation of the lung (average dose of less than 1.8 Gy), it has to be pointed out that our predictions and those of Inskip et al. Citation[13] are within the same order of magnitude. On the other hand, the linear model predicts a risk level of 17% for an average dose of 10 Gy. This is at least one order of magnitude higher than the risk level observed in practice by Inskip et al. Citation[13]. These results therefore suggest that taking into account the competition between induction of mutations and cell kill is expected to predict the risk more accurately than the linear model.
and show the irradiation of the bladder and that of the rectum respectively which result from a pelvic treatment of the prostate. The dose distributions to the healthy organs in the lower panels of and are quite different from those presented in , as well as different from each other. Thus, for the bladder there is an almost flat dose distribution, while the rectum is almost uniformly irradiated with high doses. However, in both these cases some parts of the healthy organs surrounding the target are considerably irradiated, due to the specific anatomic features of this treatment, and the competition between cell killing and induction of DNA mutations becomes quite important. In this case, the linear model predicts treatment-associated risks for secondary cancers of 19% for the bladder and 78% for the rectum (). These values are completely unrealistic as such levels of incidence have not been encountered in practice and they demonstrate again the errors that may be introduced by the use of the linear model for radiotherapy applications. Thus, from the data published by Boice et al. Citation[11] on pelvic treatments it can be inferred that the risk for radiation-induced secondary cancer in the bladder is about 0.15 – 0.32% for an average organ dose above 30 Gy and that for the rectum is around 0.05 – 0.20%. The average dose to the rectum is not specified, but it can be assumed that it is about the same order of magnitude as the dose to the bladder as it usually happens for pelvic treatments.
The comparison between the predictions of the nonlinear model from the average organ doses or from the full dose volume histograms yielded this time some considerable differences. In contrast to the case presented in , the use of the mean dose would now lead to an underestimation of the risk for cancer. The explanation resides again in the shape of the dose volume histograms in comparison to the dose response curves for the induction of cancer. The irradiation of the prostate results in average doses of the order of tens of Gy that are well above the “window of opportunity” where the risk for the induction of cancer is non-negligible. Indeed at these dose levels the cell killing is the dominant radiobiological response and therefore the probability that cells with DNA mutations will survive is small. In the particular case of the bladder this average dose is the result of an almost flat dose distribution (lower panel in ) and therefore a certain volume of the organ will be in the “dose window of opportunity” for the induction of secondary cancers (upper panel in ) and this would lead to a non-negligible risk for cancer in that organ. Thus, the use of the full dose distribution predicts a risk of 0.3% (similar to the clinical results mentioned above), while the mean dose approach with the nonlinear Equation 2 predicts an unreasonable low risk of only 0.003% (a difference of two orders of magnitude). Similar results are also seen for the rectum, but the absolute values are however very small. This could again be explained by the details of the dose distribution. Thus, the particular plan selected results in an almost uniform irradiation of the rectum (upper panel in ) to a dose that is considerably higher than the “window of opportunity” where the risk for the induction of cancer is not small. Hence, the use of the competition model results in less risk than in the case of the flat dose distribution in . It has however to be mentioned that a direct comparison with the clinical results for the rectum could not be performed as it is not known how the dose volume histograms for the patients analysed by Boice et al. Citation[11] compare with the dose distributions used in this article. But it is interesting to note that the results of Boice et al. Citation[11] also seem to show an overall reduced risk for rectum than for bladder.
Discussion
The results presented in this paper suggest that the competition between induction of DNA mutations and cellular survival should be included for risk estimations of secondary cancers, as a linear relationship is not expected to describe accurately the range of doses that may result from radiotherapy because of the nonlinearity of the biological response to radiation. Indeed, it has been suggested many years ago Citation[4–6] that the appearance of cancers following irradiation is the result of two competing effects: induction of DNA mutations that lead to malignant transformations and cell kill. Thus, while for low doses the total risk increases with increasing dose, for high doses the cell survival decreases and implicitly the total risk of mutations might decrease. Such a shape of the dose-response curve has indeed been seen in several animal systems, including human ones Citation[10,16], even though there are instances when the curve seems to have a plateau rather than a maximum Citation[12]. As the observed plateau can be regarded as a rather broad maximum, for the sake of a general form relationship it can be assumed that even in this case the appearance of secondary cancers is the result of the competition between the induction of DNA mutations and cell killing, but for a quite low cell kill Citation[7,8].
The competition between induction of DNA mutations and cellular survival has several other implications for radiotherapy applications, beside the absolute value of the predicted risk. Thus, for doses above those that characterise the maximum, the dose response curve has a negative slope meaning that a decrease of the dose is actually equivalent to an increase in the associated risk and vice versa. This is quite different from the positive slope of the dose response curves of the deterministic effects which represent the main criteria for the evaluation of treatment plans and on which the clinical radiotherapeutic practice is now based. This suggests that for the same level of deterministic late effects it might be desirable to select that treatment plan which results in a higher irradiation of a small volume of tissue than a plan which results in a lower irradiation of a larger volume of tissue, as the latter is thought to increase several fold the risk for secondary cancers Citation[7,8].
Our results also suggest that it is important to include all the details of the irradiation pattern in the organ. Thus, neglecting the details of the dose distribution (as it is done for example when using the average organ dose) when calculating the estimated risk associated with a certain treatment could result in considerable differences which might lead to serious errors if this method was used for predictive purposes. Thus, the use of a nonlinear model and the full dose distribution within the organ are expected to give the best cancer risk estimations. These conclusions are independent from the particular competition model used or from the particulars of the dose distribution within the irradiated organ, as they were reached for quite different dose volume histograms covering quite a large range of possibilities which may be encountered in clinical practice (uniform irradiation with a low dose, gradual change in the irradiation level throughout the organ and almost uniform irradiation with a high dose).
It could be argued that the predictions obtained with the competition model used in this paper are not precisely within the intervals indicated by the clinical results. This may be the result of the particular selection of parameters assumed to describe the cellular survival in each case and not that of the general principle of competition between induction of mutation and cell kill. It has to be remembered that our assumptions regarding cellular survival in the irradiated organs were best educated guesses in the absence of experimental data for these processes and that it was not the aim of this study to validate a particular set of parameters. In fact, the choice of different cell survival parameters resulted only in slightly modified predictions for the competition model (less than one order of magnitude), but still considerably different than the predictions of the linear model. This was indeed expected as the level of irradiation in radiotherapy results in considerable cell killing which cannot be neglected. Another possible explanation for the differences could be that the clinical results were based on irradiations of the organs quite different from those selected by us. This could be expected as the studies mentioned were based on clinical irradiations taking place 20, 30 or even more years ago, when the irradiation techniques did not routinely provide the same dose conformation that could be achieved today.
The observed differences between our modelling study and the clinical results only suggest that the use of a competing risk model at this stage for predictive purposes may be impeded by the lack of parameters to describe the cellular survival for each tissue and probably also to a certain extent the DNA mutations. Thus, more research is needed in this direction before a definitive answer can be given with respect to the precise parameters of the models and the details of the dose response curve that may be used for predicting the risk of inducing secondary cancers following radiotherapy.
It has to be kept in mind that the estimation of this risk is not trivial at all and in spite of all these sources of uncertainty it may even be recommended as new successful treatment methods result in larger parts of the normal tissue being exposed to relatively low radiation doses and because more young patients undergoing radiation therapy can live a long time after the treatment.
Our results do not minimise the findings of the epidemiological studies that have used a linear model for the prediction of the risk. Indeed, given the difficulties of such a study, the use of a linear model might be a useful simplification for the low dose range. This is for example the case of the atomic bomb survivors who have received rather small doses of radiation homogeneously distributed throughout the organs or the therapeutic applications resulting in very low levels of irradiation as it happens for example for very low dose rate implants. In these cases, the irradiation to the organ is within the region where the linear model and the competition model give almost the same results, and therefore it may be justified to use the linear model. However, most radiotherapy cases are quite different from the cases above as they involve fractionated deliveries of highly inhomogeneous dose distributions. Furthermore, in many cases the doses received by the organs during radiotherapy are so high that the cell killing by radiation cannot be neglected and a nonlinear estimation would be recommended. This is however applicable mainly for future studies as many of the epidemiological studies already published are based on clinical data where the actual dose-volume distribution may be difficult to determine in order to reconstruct the dose volume histograms needed for such an approach.
Conclusions
We have analysed possible methods of calculating the risk of cancer following radiotherapy in an attempt to determine the important factors that may affect this calculation. We have found that the nonlinearity of the biological response to the range of doses characteristic to radiotherapy makes the linear risk model inappropriate to be used for this purpose. Instead, the competition between induction of DNA mutations and cell killing has to be taken into account. For radiotherapy applications one also has to take into consideration the fractionated character of the treatments. The non-uniformity of the dose distribution across the irradiated organ is another important factor that influences the estimation of the risk. However, the important question that arises is whether the approximations that work for classical treatment would also be relevant for the irradiation patterns resulting from newer methods like IMRT.
Thus, all our results suggest that care should be taken when extrapolating the models and the risk coefficients listed in the literature to radiotherapy applications as many factors influence the biological response to radiation. The competition risk model and the full dose distribution are expected to provide the most complete approach to the ranking of plans, as is the case for example if one compares plans with the same mean organ dose given in a plan with a high dose close to the edge of the organ, or in an IMRT plan with the dose almost uniformly smeared over the whole organ. Furthermore, the use of a competition risk model together with the whole dose distribution should be used for the retrospective analyses of induction of secondary cancers as this would provide more reliable parameters for risk modelling.
This investigation was supported by grants from the Swedish Cancer Society, the Cancer Research Foundation in Northern Sweden and the Medical Faculty at Umeå University.
References
- Schneider U, Lomax A, Lombriser N. Comparative risk assessment of secondary cancer incidence after treatment of Hodgkin's disease with photon and proton radiation. Radiat Res 2000; 154: 382–8
- Lindsay KA, Wheldon EG, Deehan C, Wheldon TE. Radiation carcinogenesis modelling for risk of treatment-related second tumours following radiotherapy. Br J Radiol 2001; 74: 529–36
- Miralbell R, Lomax A, Cella L, Schneider U. Potential reduction of the incidence of radiation-induced second cancers by using proton beams in the treatment of pediatric tumors. Int J Radiat Oncol Biol Phys 2002; 54: 824–9
- Gray LH. Radiation biology and cancer. Cellular radiation biology: A symposium considering radiation effects in the cell and possible implications for cancer therapy. The Williams and Wilkins Company, Baltimore 1965; 7–25
- Upton AC. Radiobiological effects of low doses. Implications for radiological protection. Radiat Res 1977; 71: 51–74
- Mole, RH.Dose-response relationships. In:. JD Boice, Fraumeni, JF, Jr., eds., Radiation carcinogenesis: epidemiology and biological significance. New York: Raven Press; 1984. p, 403–20.
- Hall EJ, Wuu CS. Radiation-induced second cancers: the impact of 3D-CRT and IMRT. Int J Radiat Oncol Biol Phys 2003; 56: 83–8
- Hall, EJ. Henry, S. Kaplan Distinguished Scientist Award 2003, The crooked shall be made straight; dose-response relationships for carcinogenesis. Int J Radiat Oncol Biol, 80. 2004; 327–37
- Bhatia S, Robison LL, Oberlin O, Greenburg M, Bunin G, Fossati-Bellani F, et al. Breast cancer and other second neoplasms after childhood Hodgkin's disease. N Engl J Med 1996; 334: 745–51
- Epstein R, Hanham I, Dale R. Radiotherapy-induced second cancers: are we doing enough to protect young patients?. Eur J Cancer 1997; 33: 526–30
- Boice JD, Jr, Day NE, Andersen A, et al. Second cancers following radiation treatment for cervical cancer. An international collaboration among cancer registries. J Natl Cancer Inst 1985; 74: 955–75
- Tucker MA, Jones PH, Boice Jd, Jr, Robinson LL, Stone BJ, Stovall M, et al. The accumulation of chromosome aberrations and Dlb-1 mutations in mice with highly fractionated exposure to gamma radiation. Mutat Res 1998; 400: 321–35
- Inskip PD, Stovall M, Flannery JT. Lung cancer risk and radiation dose among women treated for breast cancer. J Natl Cancer Inst 1994; 86: 983–8
- Verellen D, Vanhavere F. Risk assessment of radiation-induced malignancies based on whole-body equivalent dose estimates for IMRT treatment in the head and neck region. Radiother Oncol 1999; 53: 199–203
- Brenner DJ, Curtis RE, Hall EJ, Ron E. Second malignancies in prostate carcinoma patients after radiotherapy compared with surgery. Cancer 2000; 88: 398–406
- Dörr W, Herrmann T. Cancer induction by radiotherapy: dose dependence and spatial relationship to irradiated volume. J Radiol Prot 2002; 22: A117–A121
- Loeffler JS, Niemierko A, Chapman PH. Second tumors after radiosurgery: tip of the iceberg or a bump in the road?. Neurosurgery 2003; 52: 1436–40
- Mazonakis M, Damilakis J, Varveris H, Fasoulaki M, Gourtsoyiannis N. Risk estimation of radiation-induced thyroid cancer from treatment of brain tumors in adults and children. Int J Oncol 2003; 22: 221–5
- Schneider, U. Dose-response relationship for radiation-induced cancer–decrease or plateau at high dose: in regard to Davis, (Int J Radiat Oncol Biol Phys 2004;59:916). Int J Radiat Oncol Biol Phys 2005;61:312––3.
- UNSCEAR. Sources and Effects of Ionising Radiation. 1993 Report to the General Assembly, with annexes. New York: United Nations; 1993.
- ICRP. ICRP Publication 60: 1990 Recommendations of the International Commission on Radiological Protection. Annals of the ICRP 1991;21:1––202.
- Thames HD, Hendry JH. Fractionation in radiotherapy. Taylor & Francis, London-New York-Philadelphia 1987
- Brenner DJ. Fractionation and late rectal toxicity. Int J Radiat Oncol Biol Phys 2004; 60: 1013–5
- Zaider M, Zelefsky MJ, Cohen GN, Chui CS, Yorke ED, Ben Porat L, et al. Methodology for biologically-based treatment planning for combined low-dose-rate (permanent implant) and high-dose-rate (fractionated) treatment of prostate cancer. Int J Radiat Oncol Biol Phys 2005; 61: 702–13
- Kellerer AM. Risk estimates for radiation-induced cancer–the epidemiological evidence. Radiat Environ Biophys 2000; 39: 17–24
- Hall EJ. Radiobiology for the radiologist, 15 th ed. Lippincott Williams and Wilkins Company, Philadelphia 2000
- Tucker, JD, Sorensen, KJ, Chu, CS, Nelson, DO, Ramsey, MJ, Urlando, C, et al. The accumulation of chromosome aberrations and Dlb-1 mutations in mice with highly fractionated exposure to gamma radiation. Mutat Res 1998;400:321–35.
- Rao BS, Natarajan AT. Retrospective biological dosimetry of absorbed radiation. Radiat Prot Dosimetry 2001; 95: 17–23
- Shimono K, Shikazono N, Inoue M, Tanaka A, Watanabe H. Effect of fractionated exposure to carbon ions on the frequency of chromosome aberrations in tobacco root cells. Radiat Environ Biophys 2001; 40: 221–5