Abstract
We investigated the feasibility of using single-item visual-digital scales for measuring anxiety and depression for research purposes within the oncology and palliative care setting. Data were retrieved from five nationwide postal questionnaires comprising 3030 individuals (response rate 76%): cancer patients, widows/parents who had lost their husband/child to cancer and population controls. All questionnaires contained the Center for Epidemiological Studies Depression scale (CES-D) and Spielberger's State-Trait Anxiety Inventory (STAI-T) as well as seven-point Visual-Digital Scales (VDS) assessing anxiety and depression. Each stepwise increased score on the VDS-depression provided a statistically significant increase in the mean score on CES-D (Spearman's r=0.582). The VDS-anxiety correlated with mean scores on STAI-T (Spearman's r=0.493), however, not all stepwise increased scores on the VDS-anxiety gave a statistically significant increase on the STAI-T. Positive- and negative predictive values were 51% and 91% for VDS-depression and 64% and 80% for VDS-anxiety. Missing data for STAI-T were 7% and 9% for CES-D; the corresponding figures were 2% for the VDS-depression and 3% for VDS-anxiety. With low attrition and agreement with psychometric scales, the Visual-Digital Scales are a feasible alternative for research in the oncology setting. However, the high negative predictive value and the low positive predictive value suggest that the visual- digital scales mainly detect the absence of the symptoms.
Anxiety and depression are common serious conditions in the cancer patient population Citation[1] and frequently remain undetected by the attending physicians Citation[2]. The negative implications are substantial for the patients’ quality of life Citation[3] as well as for the burden of family members’ during the illness Citation[4] and, in the case of incurable disease, in bereavement Citation[3]. Population-based studies identifying risk factors related to care and treatment of psychological morbidity within the oncology setting are essential for improved care; these studies rely on valid measurements of psychological morbidity.
Many of the current measures of psychological morbidity, psychometric scales (e.g. CES-D), are lengthy and are therefore less suitable for the cancer population; they take considerable time from often very ill patients who may have prognosis of limited survival time. Thus, when used, they impose the risk of attrition and inaccurate responses owing to fatigued respondents. One-item visual-analog scales (e.g., the Edmonton Symptom Assessment System) are being used in the cancer population for measurements of pain, anxiety, and depression and their psychometric properties have been reported Citation[5]. In a similar fashion, we have constructed clear-cut visual-digital scales for measuring anxiety and depression. We have used these scales in national population-based studies and now have data from over 3 000 subjects, including cancer patients with matched controls and bereaved relatives of patients dying of cancer. Comparing the properties of these simple one-item measures with traditional psychometric scales, our aim is to investigate the feasibility of using visual-digital scales for measuring anxiety and depression in the context of cancer research.
Subjects and methods
The data in this study have been retrieved from men with prostate cancer randomized to radical prostatectomy or watchful waiting in 1989 to 1999 Citation[6] (data collection 1); all survivors of cervical early-stage cancer diagnosed 1991 to 1992 and population controls Citation[7] (data collection 2); all cystectomized urinary bladder cancer cases in Stockholm alive in 1996 and population controls Citation[8] (data collection 3); widows of men who died of urinary bladder cancer in 1995 or 1996, or prostate cancer in 1996, and population controls Citation[3] (data collection 4); and parents who lost a child to cancer between 1992 and 1997 and population controls Citation[9], Citation[10] (data collection 5). The information was collected during the period 1996 – 2001 by means of anonymous postal questionnaires developed through in-depth interviews and tested for face validity. The questionnaires were answered 2 to 9 years after the loss by the bereaved population and 1 to 30 years (median 5, I.Q.R. 3.2 – 6.5) after the operation/radiation of the cancer survivors. Controls were matched for age, residence region and, when possible, gender. The procedure in the data collections has been thoroughly described in previous work Citation[3], Citation[6–9]. All data collections were approved by the Regional Ethics Committee of Karolinska Institutet. Data collection 1 (prostate cancer) was also approved in five other regional ethics committees throughout Sweden.
Measurements
All questionnaires contained the Center for Epidemiological Studies Depression scale measure for Depression (CES-D) Citation[11] and Spielberger's State -Trait Anxiety Inventory (STAI-T) Citation[12]. Both scales have been widely used in medical research and contain 20 items measured in four response categories (1–4) (to have uniform data we disregarded the founders of CES-D suggestion of calculating score with item values from zero to three).
The CES-D is a 20-item scale developed by Radloff in 1977 which asks about symptoms of depression during the previous week. A mean score ≥1.8 (corresponds to a score of 16 when item coded zero to three) has been described by Radloff as ‘caseness’ of depression and was used here as a cut-off point in the sensitivity and specificity analysis Citation[11]. Developed by Spielberger and coworkers Citation[12], STAI-T is also a 20-item scale which asks about “trait anxiety”, i.e., the items are without a time-frame and refer to how the respondent usually feels. Spielberger does not recommend any given cut-off point for “caseness”; we have used the mean score of ≥2 (summary score of ≥20) as a cut-off point in the sensitivity and specificity analysis.
We also included the questions ‘Have you been depressed during the previous six months?’ (VDS-depression) and ‘Have you experienced anxiety during the previous six months?’ (VDS-anxiety), which were answered on a seven-point visual digital scale (VDS) ranging from “never” (1) to “all the time” (7). The individual data collections had different primary aims and therefore different time frames on the visual digital scales: “the previous six months” in data collection 1 (prostate cancer), 2 (cervical cancer) and 3 (bladder cancer), “the previous month” in data collection 5 (bereaved parents) and “the previous week” in data collection 4 (widows) (). Responses comprising 1–2 were interpreted as indications of little or no depression or anxiety, while those of 3–7 were interpreted to indicate moderate or much depression or anxiety.
Statistical Analysis
SPSS was used for all statistical analyses Citation[13]. To calculate the mean scores on the CES-D and the STAI-T we summed all 20 items and divided the sum by the number of questions answered. When more than two (of 20) answers were missing, the mean scores were considered as missing. We report the mean scores of CES-D and STAI-T at each point of the corresponding VDS question with 95% confidence interval (a and 2a). Mann-Whitney non-parametric rank test was performed to test if the groups differ where the confidence intervals overlapped. The values for CES-D and STAI-T are presented as groups in each response category of the VDS questions (b and 2b). For inspection of internal reliability of CES-D and STAI-T, Cronbach alpha was calculated. The non-parametric correlation (Spearman's) was calculated for the scales and the two VDS questions. Specificity, sensitivity, and positive and negative predictive values were calculated for the VDS questions with STAI-T and CES-D for comparison.
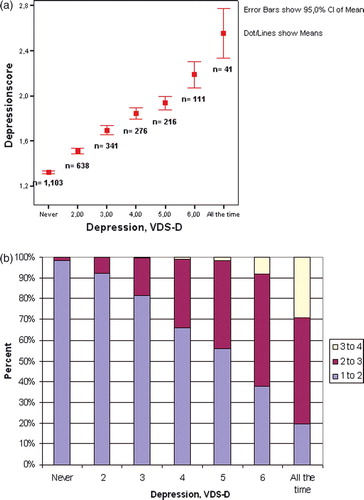
Figure 1. (a) Mean score of CES-D at each response category of the Visual Digital Scale for depression (b) Groups of CES-D scores at each category of the VDS-D.
Results
Sixty-six percent of the respondents were from urban areas (>500 000 inhabitants) and 63% were women. The mean age was 61.6 years for men and 55.7 years for women. Further demographic characteristics are presented in . The response rate was 76% (3057/4009) ().
Table I. Characteristics of 3 030 respondents in the five studies.
Table II. Spearman's correlations between visual digital scales and CES-D or STAI-T in the five data collections.
Spearman's correlation between VDS-depression and CES-D was 0.582, 0.592 for men and 0.589 for women and varied between 0.472 and 0.691 for the different data collections (). Each higher category in the VDS-depression gave a statistically significant increase in CES-D (confidence intervals not overlapping). Although the confidence intervals at steps 4 and 5 overlapped, the Mann-Whitney test separated the two, p = 0.026 (two-sided) (a). The CES-D mean scores in b have been divided into three groups (1–2, 2–3 and 3–4); the lowest category on the VDS-depression identified 98% of the non-depressed subjects according to CES-D and the highest category on the VDS-depression identified 80% of those with a mean score of 2 or more on the CES-D. The categories in between follow a nearly linear increase in percentage identified as depressed (b).
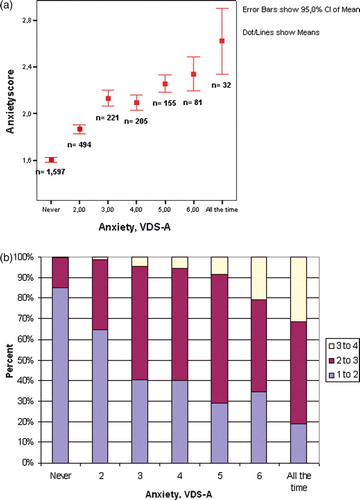
For anxiety the Spearman's correlation between VDS-anxiety and STAI-T was 0.493; these numbers are 0.467 for men and 0.494 for women. Between data collections, the Spearman's correlation ranged from 0.441 up to 0.592 (). The relationship was not completely linear; the third category on the VDS-anxiety yielded a slightly higher score on the STAI-T than the fourth one and there was not a statistically significant difference between categories 5 and 6 in terms of an increase in the STAI-T mean score (p = 0.709 and p = 0.094, two-sided) (a). The STAI-T scores were divided into three groups (1–2, 2–3 and 3–4) in the analyses presented in b. Eighty-five percent of subjects responding with the lowest category on the VDS-anxiety were non-anxious and 81% of those in the highest category were classified as having anxiety according to the STAI-T (b).
Figure 2. (a) Mean score of STAI-T at each response category of the Visual Digital Scale for anxiety (b) Groups of STAI-T score at each category of the VDS-A.
A shorter time frame of the VDS-depression correlated better with CES-D scores: the response “during the previous week” had the highest Spearman's coefficient of 0.632, compared to 0.596 for “during the previous month” and 0.521 for “during the previous six months.” Comparing the correlations for previous week with previous month gave a p-value of 0.15, and comparing previous month with six months gave p = 0.006. In contrast, all time frames on the VDS-anxiety gave similar non-parametric correlation with the STAI-T: 0.534 for “during the previous week”, 0.541 for “during the previous month”, and 0.493 for “during the six previous months”. Comparing correlations for previous week with previous month yielded p = 0.43, while comparing previous month with six months gave p = 0.06.
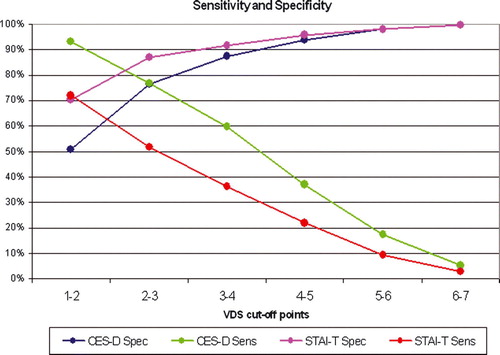
We found that a cut-off point between 2 and 3 on the VDS questions gave a reasonable balance of prediction; the sensitivity and specificity of VDS-depression (detecting mean scores ≥1.8 on CES-D) were 77% and 77% with positive and negative predictive values of 51% and 91%. For the VDS-anxiety (≥2.0 on STAI-T), the sensitivity and specificity were 52% and 87%. The positive and negative predictive values for anxiety were 64% and 80% respectively ().
Figure 3. Sensitivity and specificity of VDS compared to CES-D and STAI-T.
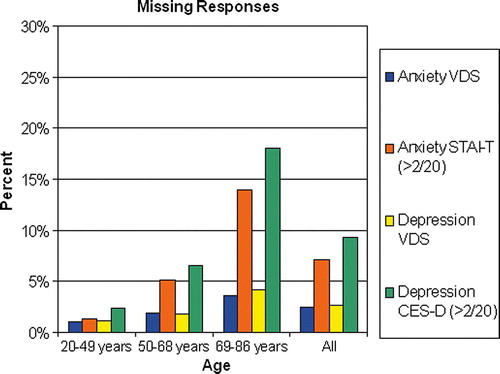
When applying a minimum criterion of responses of at least 18 of 20 items we obtained missing rates of 9% on the CES-D and 7% on the STAI-T compared to 2% and 3% on the VDS-anxiety and VDS-depression, respectively (). Each item had an internal missing rate of between 6% and 9% for the CES-D and between 4% and 9% for the STAI-T. At the younger ages (20 – 49 years), the internal response rate did not differ between the traditional scales and the single questions. However, among the oldest individuals (69 – 86 years), 18% failed to respond to the CES-D and 14% to the STAI-T compared to 4% each for the VDS-depression and the VDS-anxiety (). Subjects in the older age group were mostly from data collection one (prostate cancer; 17.6%), two (cervical cancer; 42.6%) and four (widows; 30.4%). The Cronbach alpha was 0.89 for CES-D and 0.91 for STAI-T. The founders of the CES-D reported 0.85 for the general population and 0.90 for a patient group and founders of the STAI-T reported alpha between 0.89 and 0.91 for different subgroups.
Figure 4. Percentage of missing responders on the traditional scales and Visual Digital Scales divided in to different age groups.
Discussion
A single question measuring depression and anxiety on a visual-digital scale correlates with the previous established measures, CES-D for depression and STAI-T for anxiety. The visual digital scale questions clearly screen out subjects who do not have problems related to depression or anxiety. The high response rate for the visual digital scales further illustrates validity advantages which may benefit future research on cancer patients and their relatives as well as population controls.
Efforts have previously been made to construct short measures of anxiety and depression. Chochinov and co-workers Citation[14] report promising results of 100% sensitivity and specificity for a single question “Are you depressed?” in palliative care patients when using yes/no response categories and a clinical interview schedule as the golden standard. However, a replication of the study in the UK found this single question to have considerably lower validity Citation[15]. Visual-analog scales (e.g. The Edmonton Symptom Assessment System) are used in the cancer population for measurements of pain, anxiety, and depression and their psychometric properties are being reported to be quite similar to our findings for the visual-digital scales Citation[16]. When using the Edmonton Symptom Assessment System, a detailed measurement of millimeters is required to rate each response which is time-consuming, especially in research involving thousands of subjects. In line with this notion, Ohnhaus and Adler Citation[17] have previously recommended the use of a seven-point visual-digital scale rather than a VAS scale because of its ease of administration and interpretation.
The optimal number of categories on the visual-digital scale can be debated: seven categories have been suggested to be an optimal number Citation[18] and we have chosen that proposal. With the CES-D and STAI-T as the golden standards, a cut-off point between 2 and 3 on the VDS questions provides the best balance between sensitivity and specificity (). Arbitrary categories of low versus moderate and high risk for anxiety and depression have been set at 1–2 (low), 3–7 (moderate and high), and our current analyses imply that this may be a reasonable categorization. Values above this cut-off point can be considered to indicate moderate or high risk of having the symptoms (clinical and sub clinical) of anxiety or depression. The high negative predictive value of both VDS-anxiety and VDS-depression indicates that the instruments are quite capable of screening for subjects without problems related to anxiety or depression. However, the low positive predictive value, especially of VDS-anxiety, indicates that a more detailed inquiry is needed for a thorough diagnosis of depression and anxiety disorders. Therefore, in research (and possibly also in the clinical setting), the visual-digital scales may have a role as screening instruments for potential anxiety and depression candidates.
The linear relationship in between the VDS-depression and the CES-D indicates that people are likely to be able to assess whether or not they have problems related to depression. On the other hand, the non-linear curve between VDS-anxiety and STAI-T indicates that symptoms of anxiety are harder to identify and self-evaluate (). The weaker correlation between STAI-T and VDS-anxiety may also be due to the fact that STAI-T measures the personality trait of anxiety proneness while VDS-anxiety measures experienced anxiety during given time periods. However, while expecting a longer time frame more to simulate “trait” reports, we do not observe any major differences in the correlation between VDS-anxiety and STAI-T in the different time frames used. On the other hand, correlation between the VDS-depression and CES-D varies considerably according to time frames used for the VDS-depression; a short time frame of “the last week” gives higher correlation between VDS-depression and CES-D than “last six months” or “the last month.”
The five data collections represent a very heterogeneous group of people: cancer patients of both genders in varying stages of their disease, healthy people as well as relatives of deceased cancer patients with varying duration of bereavement. Thus, it is indeed plausible that some subpopulation relate better or worse to the short visual digital scales. In order to address this, we investigated if the correlation between the visual digital scales with the established measures varied between data collections (). The variation in the non-parametric correlation between the measures between studies is moderate and no clear pattern emerges.
The high internal missing rate in the CES-D and the STAI-T questions, especially in the older population, may indicate that respondents get tired answering all the items, that some items are hard to understand (as positive or negative) or that certain items may be perceived as odd or offensive. Authors of the STAI-T Manual Citation[11] report that some individuals fail to respond because they do not understand the content of some items. The differences in response rates between the CES-D and the STAI-T cannot be explained by the order in which the two scales appear in the questionnaire: in two data collections, the CES-D was placed first (1 and 2) while in the other three it was the other way around; both orders show higher missing rate in the CES-D scale (data not shown). In a more detailed analysis, the statement “I wish that I could be as happy as everybody else seems to be” has a response attrition of 9%, which was 3% higher than any other question in the STAI-T scale. The increase in response failure in the psychometric scales among the elderly, as compared to younger subjects, can be a problem, especially when age is associated with the outcome of the study. A fruitful approach to overcome this drawback may be to use the VDS questions or modify the traditional scales. The internal reliability, measured with Cronbach alpha, is similar to what the founders of CES-D and STAI-T report.
Theoretically, in epidemiological terms, demands on an instrument will vary depending on if an entity is studied as an outcome or considered as a possible confounder Citation[19]. For a possible confounder, a sensitivity lower then 1.0 compromises the completeness of a restriction. For an outcome variable, a sensitivity lower then 1.0 does not influence a prevalence ratio. For the choice between VDS-A and STAI-T, for example, considering whether anxiety is under study as a potential confounder or an outcome may influence the decision.
The strength of our study is the use of population-based registers, giving us a total coverage of subjects in the targeted population and observed period (study base) thus avoiding selection-induced problems with validity. However, we can not tell how the non-response affects the findings. Most of the data were collected by means of an anonymous questionnaire answered by the respondents themselves – a situation resembling blinding. A limitation of our study is the fact that the psychiatric diagnoses of the respondents are not available to us and cannot be collected post hoc, since data are given anonymously. Another limitation is the variety of time frames as well as subject characteristics; however this can also be seen as a strength, that the findings are generalisable to different settings of potential targeted populations.
To sum up, the validity of the visual-digital scales are confirmed by their correlation with previously established scales as well as by their superior response rate. Although more efforts are needed for clinical diagnoses, the visual-digital scales constitute a straightforward, simple and clear-cut method for screening for anxiety and depression among cancer patients and members of their family as well as healthy controls in population-based studies.
Acknowledgements
Data collection 1 was supported by the Swedish Cancer Society and King Gustav V's Jubilee Fund. Data collection 2 was supported by grants from the Swedish Cancer Society and the Cancer Society of Radiumhemmet, Stockholm. Data collection 3 was supported by the Mauritzen La Fontaine Foundation. Data collection 4 was supported by grants from the Swedish Cancer Society and the Stockholm Cancer Foundation. Data collection 5 was supported by grants from The Swedish Children's Cancer Foundation and The Swedish Association for Cancer and Traffic Victims.
We declare no conflicts of interest.
References
- Hotopf M, Chidgey J, Addington-Hall J, Ly KL. Depression in advanced disease: A systematic review Part 1. Prevalence and case finding. Palliat. Med 2002; 16: 81–97
- Fallowfield L, Ratcliffe D, Jenkins V, Saul J. Psychiatric morbidity and its recognition by doctors in patients with cancer. Br J Cancer 2001; 84: 1011–5
- Valdimarsdottir U, Helgason AR, Furst CJ, Adolfsson J, Steineck G. The unrecognised cost of cancer patients' unrelieved symptoms: A nationwide follow-up of their surviving partners. Br J Cancer 2002; 86: 1540–5
- Hodgson C, Higginson I, McDonnell M, Butters E. Family anxiety in advanced cancer: A multicentre prospective study in Ireland. Br J Cancer 1997; 76: 1211–4
- Philip J, Smith WB, Craft P, Lickiss N. Concurrent validity of the modified Edmonton Symptom Assessment System with the Rotterdam Symptom Checklist and the Brief Pain Inventory. Support Care Cancer 1998; 6: 539–41
- Steineck G, Helgesen F, Adolfsson J, Dickman PW, Johansson JE, Norlen BJ, et al. Quality of life after radical prostatectomy or watchful waiting. N Engl J Med 2002; 347: 790–6
- Bergmark K, Avall-Lundqvist E, Dickman PW, Henningsohn L, Steineck G. Vaginal changes and sexuality in women with a history of cervical cancer. N Engl J Med 1999; 340: 1383–9
- Henningsohn L, Wijkstrom H, Dickman PW, Bergmark K, Steineck G. Distressful symptoms after radical cystectomy with urinary diversion for urinary bladder cancer: A Swedish population-based study. Eur Urol 2001; 40: 151–62
- Kreicbergs U, Valdimarsdottir U, Onelov E, Henter JI, Steineck G. Anxiety and depression in parents 4–9 years after the loss of a child owing to a malignancy: A population-based follow-up. Psychol Med 2004; 34: 1431–41
- Kreicbergs U, Valdimarsdóttir U, Onelöv E, Henter J-I, Steineck G. Talking about death with children who have severe malignant disease. N Engl J Med 2004; 351: 1175–86
- Radloff L. The CES-D scale: A self-report depression scale for research in the general population. App Psychol Measure 1977; 1: 385–401
- Spielberger CD, Gorsuch RL, Lushene PR, Vagg PR, Jacobs GA. Manual for the state-trait anxiety inventory [form Y]. Consulting Psychologists Press, Palo Alto, CA 1983
- Statistical Package for the Social Sciences, version 11.5.1. SPSS inc.11.5.1. Chicago Illinois; 11–16–2002.
- Chochinov HM, Wilson KG, Enns M, Lander S. Are you depressed?" Screening for depression in the terminally ill. Am J Psychiatry 1997; 154: 674–6
- Lloyd-Williams M, Dennis M, Taylor F, Baker I. Is asking patients in palliative care, “Are you depressed?” appropriate?. Prospective study. B M J 2003; 327: 372–3
- Borjeson S, Hursti TJ, Peterson C, Fredikson M, Furst CJ, Avall-Lundqvist E, et al. Similarities and differences in assessing nausea on a verbal category scale and a visual analogue scale. Cancer Nurs 1997; 20: 260–6
- Ohnhaus EE, Adler R. Methodological problems in the measurement of pain: A comparison between the verbal rating scale and the visual analogue scale. Pain 1975; 1: 379–84
- Cox EP. The optimal number of response alternatives for a scale: A review. J Market Res 1980;407–22.
- Steineck G, Hunt H, Adolfsson J. A hierarchical step-model for causation of bias-evaluating cancer treatment with epidemiological methods. Acta Oncol 2006; 45: 421–9