Abstract
The optimum selection of beams and arcs in conformal techniques is of the outmost importance in modern radiotherapy. In this work we give a description of an analytic method to aid optimum selection, which is based on minimizing the intersection between beams and organs at risk (OAR) and on minimizing the intersection between the beam and the planning target volume (PTV). An arc-selection function that permits selection of irradiation arcs based on individual beam feasibility is introduced. The method simulates the treatment process by defining a computed beam feasibility, for every possible set of gantry-table angles, by taking into account accurately computed intersection volumes between the OAR and beams. The beams are shaped to conform the target using realistic parameters for the treatment process. The results are displayed on a virtual sphere centred at the isocenter with color-coded regions indicating beam feasibility. Arcs selections are performed by searching the map for successive gantry positions at a certain table angle, with feasibility values greater than a user-specified threshold. The accuracy of the method was confirmed by using geometrical regular shapes, as well as real clinical cases.
Conformal radiotherapy can be significantly improved by the customization of beam and arc orientation, which is a difficult aim to achieve since the number of possible combinations can be huge. In order to reduce the search space, a-priory knowledge regarding the beam priority directions based on geometrical or dosimetric considerations should be applied. In this approach, each candidate beam direction would receive a score prior to the optimization, and the optimal directions would either be selected manually, based on best scoring directions, or used to favour the appropriate selection during optimization Citation[1]. The beam scoring approach has been a practical compromise between the easy manual selection of beam directions using the beam eye view (BEV), and the complexity of a full-scale beam angle optimization. Its accuracy has been proven in a previous work, where it was established that geometry-based considerations are able to predict the dose distribution, since a linear correlation between dose-based and geometrical-based optimization objectives was found Citation[2].
Although beam scores have been used in conformal beam optimization Citation[1–3], they were not applied towards the arcs selection problem in conformal radiosurgery. Manual selection based on the BEV is still commonly used to visualize the position of the target volume and organs at risk (OAR) and to design the parameters of the arc irradiation. Since in stereotactic radiotherapy non-coplanar arcs can be used, this gives rise to many more possible arrangements, making the selection of the optimum treatment technique a complex process.
The concept of target eye view (TEV) was introduced as an extension of BEV Citation[4], Citation[5] to aid the manual arc placement and is currently implemented in commercial treatment planning systems such as Brainscan. The TEV is a map of beam feasibilities constructed for all possible gantry and couch combinations. The aim of a TEV map is to aid localization and visualization of the most optimum field positions for the irradiation of the tumour, in terms of geometry. The best field positions will ideally exclude any OAR that is directly intersected by the beam.
Previous investigators used an approximation of the volume intersection between beams and OARs as a measure of beam feasibility. McShan et al. Citation[6] refined this concept by considering the average dose inside the OAR. This is the dose that is computed on a set of sampling points within the organ, using a simple dose computation model. Cho et al. Citation[7] improved the intersection approximation method by projecting the structures on a plane perpendicular to the beam direction and then inspecting the overlap between outlines of OARs and PTV. Moreover Pugachev et al. Citation[3] used dosimetrical considerations of the maximum dose achievable to the target without exceeding OAR limits, while Rowbottom et al. Citation[8] used the relative position of the target and critical structures.
The optimization of beam directions implies adjustment of the field size for every stationary field, including shielding determination or beam shaping by a multileaf collimator. Moreover, certain beam irradiation positions might not be feasible in practice, due to gantry-table collision or beams passing through regions where there is a lack of anatomical information from the CT. Therefore, in the effort of selecting a suitable set of arcs, the TEV map should take into account these practical considerations, which have not been addressed analytically by other groups. All previous score functions are designed for single beams directions, which cannot be applied to dynamic conformal arc therapy or IMAT. We believe that simple geometry-based considerations may be able to improve arc selections for arc therapy or IMAT, in the same way that geometrical scores have improved beam orientation selection,
Hence we propose modifications to the beam scores that will allow accurate calculation of optimal treatment parameters, based on geometrical calculations that would meet the strict accuracy limits imposed by stereotactic radiosurgery. Arc selection is further improved by adding arc search utilities to the target eye view (TEV) concept, enhanced with beam score information for each candidate beam direction. This enhanced TEV, called Arcs-Target–Eye-View map (ATEV) would perform the arcs selection in two steps. In the first step, a feasibility threshold value can be applied to the ATEV map, in order to eliminate all beam positions that would produce a high dose in OARs. The second step would be a search in the ATEV map for high feasibility irradiation locations, which correspond to successive gantry positions at a common table angle.
Finally, in order to meet the accuracy limits of stereotactic radiosurgery, the approximations of intersection volumes will be replaced by a direct calculation which can incorporate beam divergence and concave shapes. Hence functionality should be improved by defining treatment options including coplanar or non-coplanar plans, the possibility of using individual beam shaping, the definition of anisotropy margins for target or critical organs, and the selection of non-applicable angles.
Materials and methods
Definition of beam directions
The rotation of the gantry and couch are quantified by defining the directions (points) from which the beam may irradiate the patient on an imaginary sphere. This sphere is centred at the isocenter and is composed of equispaced points representing the source position for each possible table and gantry angles. Thus the sphere represents a quantization of the possible table/gantry rotations in the patient coordinate system. It is possible to convert each point from the patient coordinate system to a pair of gantry and table angles by transforming from Cartesian coordinates to spherical coordinates.
Positions which are not feasible
In clinical practice, not all beam directions are feasible, due to gantry-table collision limitations, lack of computerized tomography (CT) data, or the need to specify a set of “forbidden angles” for the movement of couch and/or gantry.
To eliminate unfeasible positions, a collision test is performed using two polygonal models of the gantry and table surfaces. The polygonal models are composed of a set of points connected by less than 100 vertices. The collision algorithm determines whether any of the vertices of the couch model intersect the surfaces of the gantry model. The time needed to perform this test, for all possible beam positions, is only 2 s because the number of vertices in the models is rather small.
Beam entrance directions that pass through regions with no structure definition due to lack of CT data, are considered non-feasible and hence are discarded. Entrance points that are above or below the CT slices are marked as not feasible and are also eliminated from further calculations. This is performed by comparing the points set coordinates with the limits of the scanned CT data. Furthermore, limits for the rotation of the gantry or couch can be specified. Consequently all cases in which the sphere points lie outside the forbidden angles are eliminated from further calculations.
Beam shape construction
Provided that individual shielding to protect the OARs is not used, the collimator settings are determined by calculating the collimator rotation and orientation that would best cover the PTV shape as observed from the source. The computation is performed by using an oriented bounding box (OBB) algorithm Citation[9]. The OBB determines the minimum box that would encompass a PTV projection and hence identify OBB dimensions and orientation at the optimal collimator size and rotation.
On the other hand if shielding is used, the beam will be shaped accordingly to cover the PTV. The beam cross section at the isocenter is identified by the PTV margins. A contouring algorithm is then applied on the BEV image to obtain the polygon points describing the beam at isocenter, and this polygon is swapped along the beam central axis to reconstruct the beam's path through the patient (the beam divergence is also taken into account).
Margin around the shapes
A method that is based on spline transformations allows the construction of a non-isotropic margin around a selected surface. The attribute of this method is that, given a set of source points or landmarks, with a set of points identified as the target, the transform that best translates the source points into the target points can be computed. If applied on a mesh, this transformation will deform it in such a way that the source points will be as close as possible to the target points.
The advantage of this method over other methods is that it allows the construction of a non-isotropic margin, which can be applied on both convex and concave surfaces. A set of eight points is initially chosen as sources. These points are the corners of the initial structure bounding box. The target points are arranged on a second box, shifted from the original box by user-defined margin distances for each axis. When the transformation is applied, the structure is “inflated” resulting in a non-isotropic margin around the initial surface.
Intersection
The practicability of each beam direction is assessed by computing its intersection with the OAR's and the PTV. Due to the complexity of the reconstruction models, it is both time consuming and complicated to directly compute the intersection between two 3D polygons, especially when the polygons are concave, as in the case of shielding use. It is therefore recommended to reduce the 3D slice intersection problem to a set of 2D intersection tests; hence the beam is reduced to a set of parallel slices. For each slice, the area of intersection between the beam and the contour is assumed to be proportional to the volume intersection of that slice with the beam. The sum of the intersection area in all slices, divided by the total area of the slices is proportional to the part of the structure volume that is intersected by the beam.
Beam feasibility calculation
In order to be able to obtain a measure for the feasibility of a specific beam we define the geometrical fitness factor GFF.1
This factor takes into account the intersection volume between the beam and the OARs ().
Figure 1. The optimization geometry. The beam edges are shown as dashed thick lines. The aim is to maximize the shaded area of: (1) the portion of PTV irradiated , and (2) the portion of OARs spared
.
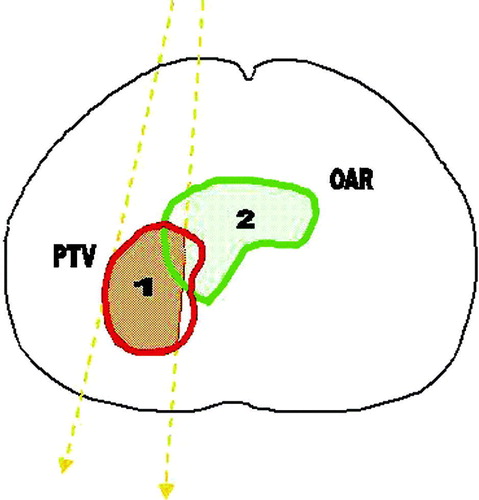
The term, describes the intersection volume between the PTV and the beam B, while the term
is the intersection volume between the beam and the i-th OAR, thus the first term describes the fraction of the PTV that is irradiated by the beam, while the second term describes the fraction of th3e OAR that is not intersected by the beam. The values of wi represent the normalized importance factors for each OAR. They can be different for each OAR and may be varied based on the objective of the user:
.
N is the total number of OARs. Ideally, both terms in parentheses in the aformentioned equation should be 1. Practically these terms have values in the range (0, 1). As a result of choosing wi as the normalized importance factors, similarly GFF gives values in the range (0, 1).
Visualization of results
The results are color-coded on an imaginary sphere around the patient. The color is assigned according to the GFF values, ranging from blue for high GFF values (desired directions) to red for low GFF values. The positions that are not accessible due to lack of anatomical data are colored in yellow.
Two graphic utilities are implemented to facilitate the visualization. The first utility discards regions that are not of interest when their GFF value is low (below a user-specified cut-off value). The second tool, transforms the color-coding into “deformation-coding”, the sphere being deformed towards the isocenter with a deformation factor proportional to the GFF value. The first tool aims to help the visualization of the results by eliminating unnecessary information, and the second one helps the user to judge very similar GFF values, when similar color-coding are hard to distinguish.
Manual selection of beam directions
The results are also displayed in a separate window as a set of graphs, each graph showing how the GFF values vary with gantry angles for a given table angle. The selected beam directions are represented as vertical bars. Using the mouse, the user can drag the beam bars to choose the required beam directions. This way the window can be used as a manual selection tool.
Optimum arcs
Arcs are modelled as successive beams positions sharing a common table angle. Hence based on this observation, a method of an automated detection of optimum arcs using the ATEV map is proposed. This method takes into account a minimum GFF value along the arc and a minimum arc length. The first criterion is satisfied by omitting the regions of the ATEV map that has a threshold value below the user specified one. The second criterion is fulfilled by searching the remaining regions for points that correspond to successive gantry positions. The length of the arc formed by those points should be larger than a user-defined value. The search for the set of optimum arcs is completed by scoring each arc according to the sum of the GFF values along the arc, and then choosing those with the highest score.
Computational implementation
The optimization module was programmed in C + + language for the interface and the graphic library “The Visualization Toolkit” (VTK) Citation[10] for the graphic representation. VTK consists of a large set of visualization classes, as well as associated algorithms that can be used to solve geometrical problems. The contouring, clipping, optimal oriented bounding box (OBB), and spline algorithms described in the methods section were used as implemented in the VTK.
Results and Discussion
To illustrate the concept, the software was applied to a phantom case and three clinical cases from the Klinikum Offenbach treatment database. The PTV and the OARs were first delineated on the PLATO TPS system and then were exported to our software Citation[8]. For each patient an ATEV map was constructed using different parameters for the penumbra margin size, treatment technique, critical structure shielding, mapping resolution and “forbidden” angles.
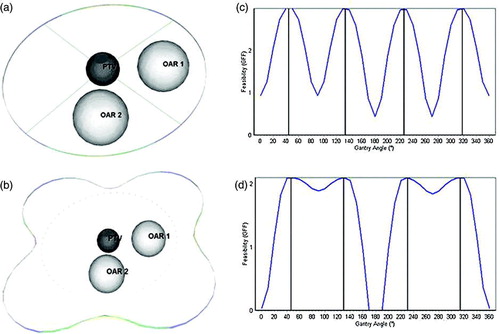
The phantom case consisted of the PTV modeled as a sphere of radius 20 mm situated in the center of the model and two OARs which are represented as spheres of 40 mm radius, situated at a distance of 70 mm from the PTV (a). For evaluation purposes an ATEV map was constructed corresponding to a plan containing the table fixed at 0°, using shielding to protect the OARs. No margins were defined for the PTV and OARs. The angular resolution was set to 1°. All OARs were assigned an equal importance factor of 1.0. As expected, the GFF demonstrated a minimum at directions passing through the OARs and a maximum at directions passing between the OARs. The results are wrapped away from the isocenter to better understand the position of the high-feasibility regions. Regions with low GFF are slightly deformed, and thus remain near their original position (represented as a circle of dots) while regions with high GFF are substantially deformed (b). The GFF analysis and the resulting graph for manual selection of beam directions is illustrated in c, and finally the GFF analysis assigning different importance factors to the critical structures, is represented in d. The GFF for beam positions passing through the second OAR have changed proportionally to the weighting factor change. The observed asymmetry was caused by the beam divergence, since beams with entrance points close to the OARs intersect less comparing to beams coming from the opposite direction.
Figure 2. The test case consisting of a spherical PTV of radius 20 mm and two spherical OAR's of radius 40 mm. (a) 3D view of the geometry-Four beams are selected at the positions with the highest GFF and are represented as lines. (b) The results are wrapped away from the isocenter to better understand the position of the high-feasibility regions. Regions with low GFF are slightly deformed, and thus remain near their original position (represented as dots) while regions with high GFF are substantially deformed. (c) GFF analysis as done by the system and the resulting graph for manual selection of beam directions is displayed (d) GFF analysis for different importance factors assigned to the critical structures. The GFF for beam positions passing through the second OAR have changed proportionally to the weighting factor change.
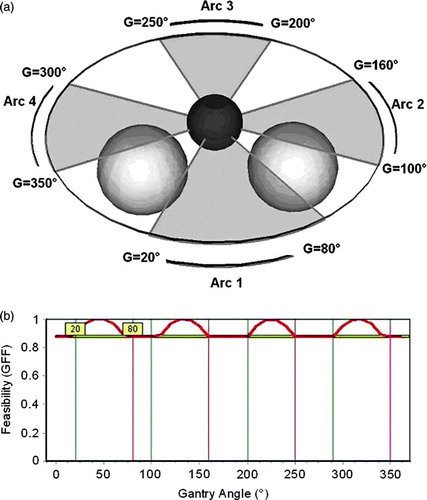
The arc selection algorithm was then tested using the phantom case. We chose to irradiate with four arcs, using OARs shielding, with no margin defined for either PTV or OAR. A minimum GFF value of 0.9, as well as a minimum arc length of 40°, was the criterion imposed for arc selection. The resulting arcs are situated in between the two OARs (a). It was observed that the arcs situated near the OARs (Arc 1 and Arc 2) are longer than the opposite arcs due to the beam divergence that favors beam entrance situated near the OARs. The selected arcs are represented as vertical bars superimposed on the GFF graph, while the minimum GFF value is represented by the horizontal bar (b).
Figure 3. Selection of arcs for the test case. (a) Irradiation with four coplanar arcs, where both OARs have the same importance factor of 1. A minimum GFF value of 0.9 and a minimum arc length of 10° have been selected as selection criteria. The arcs selected by the system are represented as semi-transparent gray fans: 20°–80°, 100°–160°, 200°–250° and 300°–350°. (b) GFF feasibility graph for the selected of arcs. The starting and finishing angles of the arcs are represented as vertical lines superimposed on the GFF graph, while the minimum GFF value is represented by the horizontal bar. The system selected results can be altered by changing the bar's location using the mouse.
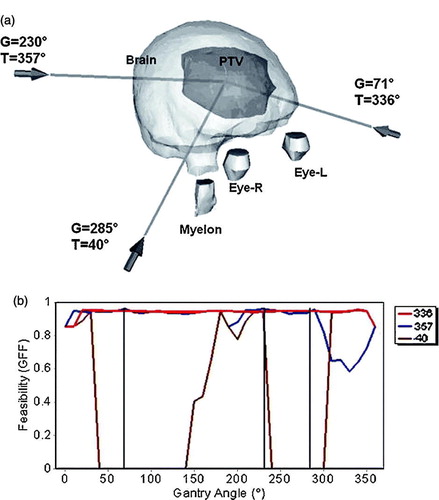
Regarding the clinical cases, the first represented a brain tumor of 2373 mm3 volume, located left laterally. The eyes and the myelon, as well as the whole brain, have been delineated as radiosensitive structures. The importance factors assigned were, 0.43 for the eyes, 0.34 for the myelon and 0.23 for the brain. The treatment plan comprised of a non-coplanar technique, with shielding defined for protecting the OARs. Two beams were selected, directed right front laterally and left posterior while a third comes from front-below, as shown in a. In all directions, beams do not pass through the eyes, and the volume of irradiated brain is minimal due to the shape of the PTV and it's location inside the brain (b).
Figure 4. The brain tumor case. (a) Irradiation with a non-coplanar technique using shielding and without margin defined for around PTV or OARs. The selected beams are represented as lines with arrows at the entrance point. For each beam, the corresponding gantry (G) and table angles (T) are marked nearby. (b) GFF feasibility graphs for the table angles of 40° (dotted line), 336° (dash-dotted line) and 357° (line), corresponding to the selected beams. The three selected beams are represented as vertical lines superimposed on the GFF graphs.
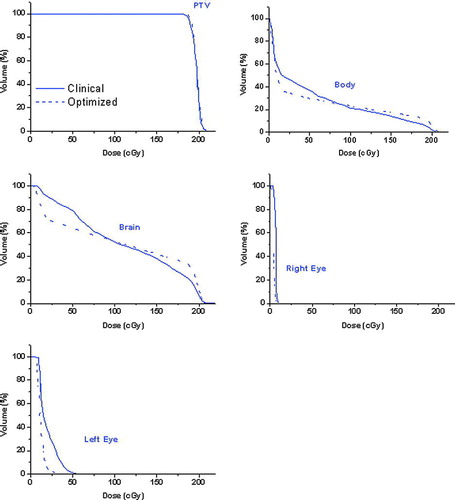
This plan was compared with a clinical plan composed of two beams oriented at table angle T = 0°, and gantry angle G = 225° and at table angle T = 0° and gantry angle G = 36° respectively. The resulting DVH analysis depicted in shows that the same PTV coverage is obtained, but at the same time there is a reduction of the dose delivered to the eyes. For the left eye, the maximum dose decreased from 0.059 Gy to 0.041 Gy, and the average dose from 0.019 Gy to 0.007 Gy. The average dose received by the brain decreased from 0.111 Gy to 0.108 Gy.
Figure 5. DVH analysis for the brain tumor case. The clinical plan represented by a full curve, an optimized plan with a dashed line.
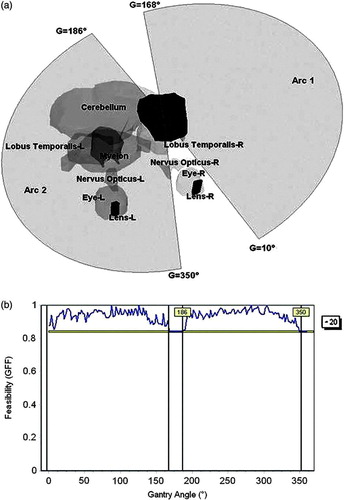
The application of the ATEV concept for selection of arc parameters was also tested on a clinical brain tumour case treated with arc therapy, as presented in . The eyes, eye lens, cerebellum, lobus temporalis and myelon have been delineated as OARs. The system searched for a set of two arcs in an ATEV map constructed at 2° angular resolution and with the table allowed to move between 90° and 270°. The resulting arcs are situated at a fixed table angle of 20°, and span from 10° to 168° and from 186° to 350° (a, b).
Figure 6. The second brain tumor case containing several OARs, was used to test the arc selection algorithm. (a) Graphical representation of the selected arcs. (b) GFF graphs for the table angle (T) of 20°.
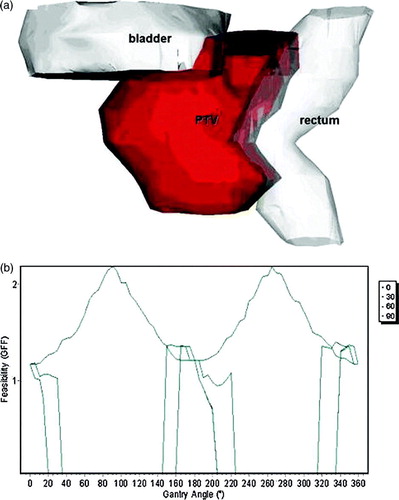
The third clinical case evaluated, was a prostate cancer case, with a PTV of 1 719 mm3 volume. The bladder and rectum have been delineated as OAR's (a) and the assigned weights were 1 for the rectum and 0.5 for the bladder. The calculation was applied using non-coplanar technique, including shielding for the beam's directions, with no margin defined around PTV or OAR's and with 5° resolution. The most feasible beams directions have been determined laterally, because due to the shape of the rectum and the prostate, at those directions, the intersection volume between the target and the rectum was minimal. The results of the GFF calculation for the 0°, 30°, 60° and 90° table angles are presented in b. For the 30°, 60° and 90° angles, there are regions with GFF = 0, because irradiation form those directions will pass through regions where there is a lack of CT data.
Figure 7. The prostate case. The rectum and the bladder have been delineated as OAR's, with assigned weights of 1 and 0.5 respectively. (a) 3D view of the contoured anatomy. (b) Feasibility graph for the gantry angles of four table angles (0°, 30°, 60° and 90°).
From the evaluation of the clinical cases it is evident that there is an improvement of the TEV tool, both regarding the calculation method, and in the way the results are graphically displayed. The possibility of including coplanar techniques from the beginning of the treatment considerably reduces the search space, thus improving the computation times. Moreover, OBB algorithms can be used to automatically detect best collimator size and orientation, and in case of shielding use, the PTV margin is utilized in order to construct the beam shape. Finally the visualization can be improved by cutting out regions of low GFF, especially in cases where the proximity of the target to the OARs or the complexity of the reconstruction complicates the graphic display. An expansion of the TEV permits the computation of the best orientation and start–stop angles for arc irradiation. This is accomplished by determining the positions of fixed table angles in the ATEV, having the sum of minimum GFF values for different gantry angles.
Hence, the main feature that distinguishes this work from previous efforts is the arcs calculation. While previous score functions are designed for single beams directions, in this attempt we focus on selecting suitable arcs orientations aiming to aid dynamic conformal arc therapy or IMAT. As geometrical scores have improved beam orientation selection, simple geometry-based considerations can improve arc selections for the aforementioned treatment methods.
Moreover there are a set of improvements in the raw score calculation designed to improve accuracy. The proposed method replaces the intersection volume calculation approximation used in the previous method, with direct volume calculation. This is important in the light of stereotactic treatments, where milimetric accuracy is sought in defining the beam shape, thus requiring accuracy for volume calculations. In the effort to accurately compute most feasible arc directions, the volume calculation takes into account different treatment settings that were not covered in previous score functions, such as:
options to use a coplanar or non-coplanar plan, and to specify the angle at which the table is fixed;
definition of shielding for one specific OAR;
definition of margins for a certain structure;
computation of the TEV on plans delivered with open collimator, since the best collimator settings are automatically computed for each beam direction;
automated check of directions with table-gantry collision and user-imposed limits on gantry and table rotation.
Finally in order to aid the results interpretations, we devised the threshold graphical tool. Since the visualisation of the full TEV sphere and structures can be quite difficult, we define a feasibility threshold cut-off value. All values below that value are eliminated from the graphics rendering to enhance the visualisation. This is offered as a complimentary visualization to the standard score-gantry-table graphs. While colour-coded outcome is useful when analysing at a glance, graphs are useful to inspect the feasibility values. The two modalities are now combined by warping the color-coded sphere with the feasibility values, resulting in a hill and valleys representation of the sphere that permits a better identification of optimal arc directions.
Conclusion
The ATEV map provides a useful tool in choosing appropriate treatment angles in conformal radiotherapy. Although the optimization of beam directions can be performed with more sophisticated techniques, the ATEV map provides a simple way to visualize and check the result of such optimizations. It can be used as a starting point in a beam-orientation process, or in order to check the computation results of such an algorithm. Nevertheless, it can be utilized in daily practice to better understand the geometrical relationship between the target and OARs, and to choose appropriate beam directions based on geometrical criteria.
For the sphere case with a resolution of 1° and coplanar irradiation, the computation time was 21 s. At a resolution of 10° and non-coplanar irradiation, the computation times were 4 min for the first case, and 10 min for the second, due to the complexity of the case. The computation times depend on the resolution, the number of points in delineated contours, and the number of CT slices in the study. The selection of different treatment options does not significantly alter the computation times.
Acknowledgements
This research was supported by a European Community Marie-Curie Fellowship (HPTM-2000-00011).
References
- Pugachev A, Xing L. Incorporating prior knowledge into beam orientation optimization in IMRT. Int J Radiat Oncol Biol Phys 2002; 54: 1565–74
- Schreibmann E, Lahanas M, Uricchio R, et al. A geometry based optimization algorithm for conformal external beam radiotherapy. Phys Med Biol 2003; 48: 1825–41
- Pugachev A, Xing L. Pseudo beam's-eye-view as applied to beam orientation selection in intensity-modulated radiation therapy. Int J Radiat Oncol Biol Phys 2001; 51: 1361–70
- Chen GT, Spelbring DR, Pelizzari CA, et al. The use of beam's eye view volumetrics in the selection of non-coplanar radiation portals. Int J Radiat Oncol Biol Phys 1992; 23: 153–63
- Myrianthopoulos LC, Chen GT, Vijayakumar S, et al. Beam's eye view volumetrics: an aid in rapid treatment plan development and evaluation. Int J Radiat Oncol Biol Phys 1992; 23: 367–75
- McShan DL, Kessler ML, Fraass BA. Advanced interactive planning techniques for conformal therapy: High level beam descriptions and volumetric mapping techniques. Int J Radiat Oncol Biol Phys 1995; 33: 1061–72
- Cho BC, Roa WH, Robinson D, et al. The development of target-eye-view maps for selection of coplanar or noncoplanar beams in conformal radiotherapy treatment planning. Med Phys 1999; 26: 2367–72
- Rowbottom CG, Webb S, Oldham M. Improvements in prostate radiotherapy from the customization of beam directions. Med Phys 1998; 25: 1171–9
- Gottschalk S, Lin M, Manocha D. A hierarchical structure for rapid interference detection. Proc ACM Siggraph 1996; 96: 171–80
- Schroeder W, Lorensen W. The visualization toolkit an object-oriented approach to 3D graphics. Prentice Hall, Upper Saddle River, NJ 1996