Abstract
Amplified epidermal growth factor receptor (EGFR) signaling is supposed to contribute to clinical radiation resistance of glioblastoma multiforme (GBM). Therefore, inhibition of EGFR signaling pathways by the selective EGFR tyrosine kinase inhibitor, gefitinib (ZD1839, Iressa), may increase the therapeutic effects of radiotherapy. The effects of different schedules for administration of gefitinib on sensitivity to irradiation of the human glioma cell lines (251MG and SF-767), a rat glioma cell line (BT4C), and an immortalized rat brain endothelial cell line (RBE4) is reported. Differences in effects of the combined treatment on cell toxicity were determined by a fluorometric cytotoxicity assay, and nuclear DNA fragmentation was used for quantification of apoptosis. Pre-administration with gefitinib for 30 min prior to irradiation followed by continuous incubation with gefitinib significantly increased the cytotoxicity of SF-767, BT4C, and RBE4 cells. However, the human glioma cell line 251MG was protected against radiation-induced damage by this treatment schedule, at lower concentrations of gefitinib. Pre-administration with gefitinib for 24 h prior to irradiation without following incubation with gefitinib increased the cytotoxicity of SF-767 and BT4C cells. Post-irradiation treatment with gefitinib significantly increased the cytotoxicity in all cell lines except for 251MG. We demonstrated heterogeneity in the cytotoxic effects of gefitinib between cell lines. Response to gefitinib might be due to other mechanisms than through the EGF receptor as some of the cell lines showed sensitivity to gefitinib despite no or low expression of EGFR. This study also demonstrates the importance of timing of gefitinib administration when this agent is combined with irradiation.
The prognosis of patients suffering from glioblastoma is poor with a median survival of 10–12 months, despite combined treatment of surgery, radiotherapy and chemotherapy. Several factors such as the EGFR signaling pathway are believed to contribute to the proliferation and intrinsic radio-resistance of glioma Citation[1]. Activation of epidermal growth factor receptor EGFR (ErbB1, HER1), a member of the ErbB receptor tyrosine kinase family, affects cell division, survival, motility, invasion, cellular repair, and angiogenesis Citation[2]. The EGFR signaling pathway represents a particularly attractive therapeutic target in glioblastoma since the receptor is dysregulated in the majority of these tumors through overexpression, amplification and mutations Citation[3], Citation[4].
Gefitinib (ZD1839, Iressa) is an orally active tyrosine kinase inhibitor of EGFR that inhibits the growth of human cell lines expressing high levels of EGFR Citation[5]. However, in investigations to identify predictive markers of response to gefitinib for patients with non-small cell lung cancer, no clear correlation was found between EGFR expression and treatment response Citation[6]. In addition, preclinical data suggest that tumors overexpressing ErbB2 (v-erb-b erythroblastic leukemia viral oncogene homolog 2) are particularly sensitive to gefitinib Citation[7]. There are few published data on malignant glioma and response to gefitinib treatment, alone or in combination with radiotherapy Citation[8–10]. Recently published data from a clinical phase II trial of gefitinib in recurrent glioblastoma demonstrated no objective tumor response Citation[11]. An in vitro study on human glioma cells suggested that inhibition of EGFR signaling by gefitinib can be combined with radiotherapy as a beneficial therapeutic strategy, and also provided new data on the importance of timing of drug administration and irradiation interactions Citation[12].
The aim of the present study was to evaluate if differences in EGFR and ErbB2 expression of the human glioma cell lines (251MG and SF-767), a rat glioma cell line (BT4C), and a rat brain endothelial cell line (RBE4), could influence the cytotoxicity of irradiation and gefitinib. The importance of timing of administration of gefitinib when combined with irradiation, to achieve increased cytotoxic effect in the cell lines was also investigated.
Materials and methods
Gefitinib (ZD1839, Iressa)
Gefitinib was kindly provided from Astra Zeneca, Alderley Park, UK. Gefitinib was dissolved in 100% DMSO (dimethyl sulfoxide) (Sigma, Stockholm, Sweden) to a 1 g/l (2.2 mM) stock solution which was diluted in cell culture media to obtain final concentrations.
Cell lines
The human glioma cell line U-251 MG, characterized as glioblastoma, was kindly provided by Dr. M. Nistér (Uppsala University, Uppsala, Sweden). The human glioma cell line SF-767, also characterized as glioblastoma, was provided by the UCSF Neurosurgery Tissue Bank (San Fransisco, CA). The nitrosourea-induced rat glioma cell line BT4C, characterized as a gliosarcoma was kindly provided by Professor R. Bjerkvig (Bergen, Norway). The immortalized rat brain endothelial cell line RBE4 was kindly provided by Dr. P. O. Couraud (Neurotech SA, Evry, France). The U-251MG, SF-767, and BT4C cell lines were cultured as monolayer in Dulbecco′s modified Eagle′s medium (DMEM) supplemented with 10% fetal calf serum and 50 µg/ml gentamycin from Life Technologies (Täby, Sweden). The RBE4 cell line was grown as monolayer on rat-tail collagen I-coated surface and maintained in Ham's F-10 supplemented with 10% fetal calf serum and 50 µg/ml gentamycin (Life Technologies), and 1 µg/l bFGF (basic fibroblast growth factor) (Sigma-Aldrich, Stockholm, Sweden). All the cell lines were grown in a 5% CO2 atmosphere at 37°C.
Antibodies and cell lysates
Antibodies used were: rabbit anti-EGFR, sc 03 (Santa Cruz Biotechnology, Inc., Santa Cruz, CA, USA); mouse anti-phosphorylated EGFR, Tyr 1173 (Calbiochem, San Diego, CA, USA); mouse anti-ErbB2, Neu F-11 (Santa Cruz Biotechnology, Inc.); mouse anti-Akt1 (v-akt murine thymoma viral oncogene homolog), 2H10 (Cell Signalling Technology, Inc., Beverly, MA, USA); rabbit anti-phosphorylated Akt, Ser 473 (Cell Signalling Technology, Inc.); rabbit anti-actin, A2066 (Sigma-Aldrich). Horseradish peroxidase-conjugated donkey anti-rabbit and sheep anti-mouse secondary antibodies (Amersham Biosciences, Buckinghamshire, UK). Cell lysates from the epidermoid carcinoma cell line A431 (Calbiochem), was used as positive control for EGFR and phosphorylated EGFR, as well as for Akt and phosphorylated Akt.
Immunoblot analysis
Protein lysates from the cell lines were incubated in NuPAGE LDS sample buffer and NuPAGE reducing agent for 10 min at 70°C followed by electrophoresis on 3–8% TRIS-acetate NuPAGE gradient gel for approximately 1 h at 150 V. Rainbow HMW standard (Amersham Biosciences) was used as molecular weight marker. The proteins were then transferred to a PVDF membrane and run for 1.5 h at 25 V by using an Xcell II Mini-Gel blot module. Gel apparatus, buffers, gels, blotting module, and membranes were from Invitrogen (Groningen, The Netherlands). Non-specific binding was blocked by incubation in 5% non-fat milk in Tris-buffered saline Tween (TBST) (0.1% Tween 20, 20 mM Tris-HCl, 150 mM NaCl) pH 7.4, for 1 h at room temperature. The membranes were incubated at 4°C overnight with primary antibody against EGFR (1:1000), ErbB2 (1:100), or actin (1:7000) diluted in 5% non-fat milk in TBST, thereafter they were washed in TBST and incubated with peroxidase-conjugated secondary antibodies diluted 1:5000 in non-fat 5% milk in TBST for 1 h at room temperature. The membranes were washed in TBST and visualized by using the enhanced chemi-luminiscense system ECL-plus and hyperfilm ECL (Amersham Biosciences).
Evaluation of EGFR and Akt phosphorylation
Cells were grown in six-well plates in medium with 10% of fetal calf serum (FCS) and gentamycin (50 µg/ ml). Sixteen hours prior to the experiment the medium was replaced by medium without FCS. Control cells were incubated with DMEM without fetal calf serum. Treated cells were stimulated with either EGF (50 ng/ml) (Sigma-Aldrich) alone or with EGF together with gefitinib 6 mg/l (13.4 µM) for 15 min. The cells were washed with ice-cold phosphate-buffered saline (PBSA) with Na3VO4 (1 mM) and thereafter lysed in ice-cold lysis buffer (50 mM Tris (pH 7.5), 1% TritonX-100, 150 mM NaCl, 1 mM Na3VO4, 1 mM NaF, and protease inhibitor cocktail, (Roche Diagnostics, Mannheim,Germany). Immunoblotting was thereafter performed with primary antibodies against phospho-EGFR (1 µg/ml), EGFR (1:1000), Akt (1:7000) at 4°C over night, and phospho-Akt (1:1000) for 1 h at room temperature followed by incubation with peroxidase-conjugated secondary antibodies diluted 1:5000 in non-fat 5% milk in TBST for 1 h at room temperature (and proceeded according to immunoblot analysis described above).
Cytotoxicity studies
To study the cytotoxic effects of gefitinib alone or combined with radiotherapy, cells were harvested and plated in a volume of 100 µl at 500 cells per well (BT4C), 1 000 cells per well (251MG, RBE4, SF-767) in microtiter plates. Cells were cultured until cell growth was exponential before gefitinib 1 mg/l (2.2 µM) and 3 mg/l (6.7 µM) for SF-767; 3 mg/l (6.7 µM) and 5 mg/l (11.2 µM) for 251MG, RBE4; 3 mg/l (6.7 µM) and 6 mg/l (13.4 µM) for BT4C was added to the medium, or single dose irradiation was performed. For cytotoxicity experiments, cells were harvested and plated as described above. Since previous studies have proposed that concentration as well as timing of gefitinib when combined with irradiation is important for the radio-sensitizing effects, three different treatment schedules were used in this study. Two pre-treatment schedules; 1) administration of gefitinib 30 min prior to single dose irradiation, followed by continuous incubation in presence of the drug for 6 days after irradiation, and 2) administration of gefitinib 24 h prior to single dose irradiation, without following incubation with gefitinib after the initial administration were used. To investigate the sensitivity to gefitinib in the post-irradiation phase a third treatment schedule was used; 3) administration of gefitinib for varying length of time (2, 4, 8, 12, and 24 h) after exposure to irradiation, followed by incubation with gefitinib for 6 days after the initial treatment.
Irradiation was given at varying times before or after the initial drug treatment and cells were exposed to single doses of 2, 4, or 6 Gy respectively. Treatment was given with 195 kV x-rays at 22°C using a 0.5 mm Cu filter (Stabiliphan, Siemens, Germany). The dose rate was 1 Gy min-1 at the level of the irradiated cells and the source-phantom distance was 500 mm. Plates were incubated at 37°C for 6 days, and the media was renewed with or without gefitinib after 3 days. Gefitinib was solubilized and delivered in DMSO and control samples were treated with DMSO only. To quantify the cytotoxic effects of gefitinib and irradiation, fluorescein diacetate (FDA) was used in a fluorometric microculture cytotoxicity assay (FMCA). Cells were initially washed, and PBS (100 µl) containing FDA (10 mg/l) was added to each well and plates were incubated in 37°C for 50 min, followed by fluorescence determination using 485 and 538 nm for excitation and emission, respectively. The cytotoxicity experiments were repeated three times.
Quantification of apoptosis
TUNEL (TdT-mediated dUTP nick end labeling) technology detecting nuclear DNA fragmentation was used for quantification of apoptosis. The free 3′-OH terminal was labeled with modified fluorescence-labeled nucleotides (dUTP) by catalysis of TdT (terminal deoxynucletidyl transferase). Cells were plated in culture flasks and treated with gefitinib alone or combined with radiotherapy as described above. Cell cultures were incubated at 37°C for 6 days, and the media was renewed with or without gefitinib after 3 days. Gefitinib was solubilized and delivered in DMSO and control samples were treated with DMSO only. As a positive control cell cultures were incubated with cisplatin (1 mg/l). To detect nuclear DNA fragmentation the cells were harvested with trypsin and diluted to 2×10⁷ cells per ml in a volume of 100 µl. Cell suspensions were washed twice in PBSA buffer, followed by fixation in 2% paraformaldehyde for 60 min on a shaker at room temperature. Thereafter, cells were washed with PBSA and then permeabilized with 100 µl 0.1% triton x-100 in 0.1% sodium citrate on ice for 2 min, followed by two washes in PBSA and incubation with 50 µl TUNEL read mix (Roche, Mannheim, Germany) in the dark for 60 min at 37°C. Cells were finally washed twice, diluted in 500 µl PBSA and TUNEL marked DNA fragmentation was determined with use of a FACS Calibur flow cytometer (Becton Dickinson Immunocytometry Systems, San Jose, CA, USA).
Statistical analyses
Values are expressed as mean and standard deviation. Treatment groups were compared using the Mann-Whitney U-test. A p-value of 0.05 was considered as significant. Statistical analysis was performed using SPSS for Windows version 11.5 (SPSS Inc., Chicago, IL). Curve estimation for calculation of IC50 values was performed using quadratic regression.
Results
Immunoblot analysis
The immunoblots showed positive reactivity at a band corresponding to EGFR (170 kDa) in the 251MG, SF-767, and BT4C cells. The RBE4 cell line showed no expression of EGFR. Positive reactivity at a band corresponding to ErbB2 (185 kDa) was noted in all cell lines, included the RBE4 cell line (A).
Figure 1. (A) Western blot analysis showing expression of EGFR, ErbB2, and actin, in human glioma 251MG, SF-767 cells, rat glioma BT4C cells, rat brain endothelial RBE4 cells, and epidermoid carcinoma A431 cells (used as positive control for EGFR). (B) Dose-response for gefitinib induced cytotoxicity to 251MG, SF-767, BT4C, and RBE4 cells after exposure to gefitinib (0–10 mg/l). (C) Western blot for phosphorylated EGFR and Akt expression of human glioma 251MG, and SF-767 cells, and of epidermoid carcinoma A431 cells (used as positive control for phophorylated EGFR), after stimulation with EGF (50 ng/ml) in the presence or the absence of gefitinib (6 mg/l).
Cytotoxicity
The ability of gefitinib to decrease cell viability was investigated by growing cells in the presence of increasing amounts of gefitinib. The response to gefitinib varied among the analyzed cell lines. IC50 values was calculated for all cell lines and was found to be 5.5 mg/l (12.3 µM) for 251MG, 2.7 mg/l (6 µM) for SF767, 7.9 mg/l (17.6 µM) for BT4C and 4.3 mg/l (9.6 µM) for the endothelial cell line RBE4. The lowest cell viability was seen in the SF-767 cell line, and thus this cell line seemed to be most sensitive to treatment with gefitinib. The 251MG, BT4C, and RBE4 cell lines showed relatively similar response to gefitinib. However, the BT4C cell line seemed to be most resistant to treatment with gefitinib, since in this cell line gefitinib failed to decrease cell viability even at high concentrations (B).
EGFR and Akt stimulation
EGF induced phosphorylation of EGFR and Akt in 251MG and SF-767, although a very weak phosphorylation of EGFR was seen in 251MG cells (C). EGFR phosphorylation was inhibited by gefitinib in 251MG and SF-767 cells, whereas gefitinib inhibited phosphorylation of Akt in SF-767 cells, but not in 251MG cells (C), that could indicate resistance to inhibition of apoptosis in the 251MG cells. In BT4C and RBE4 cells, EGF did not induce detectable EGFR or Akt phosphorylation (data not shown).
Gefitinib and irradiation
Short pre-treatment with gefitinib 30 min prior to irradiation significantly increased the cytotoxicity of the SF-767, BT4C, and RBE4 cells compared to irradiation alone (). In the 251MG cells, the treatment schedule surprisingly protected the cells from the effects of irradiation, at least with the lower concentration (3 mg/l) of gefitinib ().
Figure 2. Cytotoxicity to 251MG, SF-767, BT4C, and RBE4 cells after exposure for gefitinib for 30 min prior to irradiation with single doses at 2, 4, and 6 Gy, respectively, followed by continuous incubation with the drug for 6 days after irradiation of the cells. Data denote mean values±SD (standard deviation) for 16 separate observations and each figure is representative for three individual experiments. Significant difference (*p < 0.05) between irradiation alone and irradiation plus gefitinib are indicated.
Pre-incubation with gefitinib for 24 h prior to irradiation resulted in a significantly increased cytotoxicity in the SF-767 cells, at least at the higher concentration (3 mg/l) of gefitinib, whereas in BT4C cells only the higher concentration (6 mg/l) of gefitinib significantly increased the cytotoxicity at 2 and 4 Gy respectively (). Notably, in the 251MG, and RBE4 cells pre-incubation with gefitinib had a slightly radio-protective effect at all doses ().
Figure 3. Cytotoxicity to SF-767, BT4C, 251MG, and RBE4 cells after exposure for gefitinib for 24 h prior to irradiation with 2, 4, and 6 Gy, respectively, without following incubation with gefitinib. Data denote mean values±SD (standard deviation) for 16 separate observations and each figure is representative for three individual experiments. Significant difference (* = p < 0.05) between irradiation alone and irradiation plus gefitinib are indicated.
Independent of the duration of time when gefitinib was added to the cells after irradiation, a pronounced effect on the cytotoxicity to irradiation treatment was seen in SF-767 and BT4C cells (). However, in the rat brain endothelial cell line RBE4 post-irradiation treatment with gefitinib was more time-dependent, since a more pronounced effect on the cytotoxicity was seen when gefitinib was added up to 12 h after irradiation (). Post-irradiation treatment with gefitinib only slightly influenced the cytotoxicity of the human glioma cell line 251MG at the single dose of 2 Gy ().
Figure 4. Cytotoxicity to SF-767, BT4C, RBE4, and 251MG cells after post-irradiation exposure for gefitinib at varying length of time (2–24 h) after irradiation with 2, 4, and 6 Gy, respectively. ♦ Irradiation (RT), ▭ RT + gefitinib (administrated after 2 h), Δ RT + gefitinib (administrated after 4 h),×RT + gefitinib (administrated after 8 h), ![]()
Nuclear DNA fragmentation
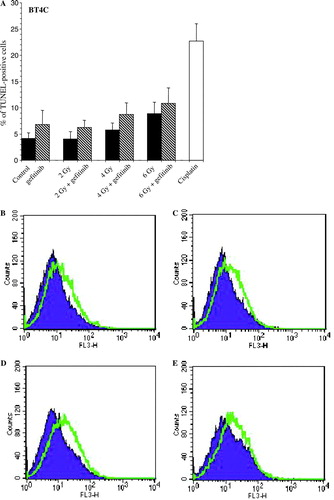
To ascertain if the decreased cell viability seen 6 days after irradiation alone or combined with gefitinib treatment was due to increased nuclear DNA fragmentation, flow cytometry with TUNEL technique was used. Although, all cell lines displayed increased nuclear DNA fragmentation after pre-incubation with gefitinib for 30 min prior to irradiation followed by continuous incubation with gefitinib compared to irradiation alone, the most pronounced effect on nuclear DNA fragmentation was seen in the rat brain endothelial cell line RBE4 (data not shown). The differences in the nuclear DNA fragmentation seen after treatment with irradiation alone or combined with gefitinib were not statistically significant. Post-irradiation treatment with gefitinib showed increased nuclear DNA fragmentation in all the analyzed cell lines, with most pronounced effect in the BT4C cell line (A–E).
Figure 5. Histogram (A) and representative images (B-E) showing increased nuclear DNA fragmentation in rat glioma BT4C cells, 6 days after irradiation treatment (RT) with 2, 4, and 6 Gy, respectively. In the combined treatment group gefitinib was administrated 24 h after irradiation. As a positive control the cells were incubated with cisplatin (1 mg/l), which is known to induce apoptosis in this cell line. Data denotes mean values±SD (standard deviation) for three individual experiments. Significant difference (*p < 0.05) between irradiation alone and irradiation plus gefitinib are indicated. (B) control (untreated) vs. gefitinib (6 mg/l), (C) RT (2 Gy) alone vs. RT (2 Gy) + gefitinib (6 mg/l), (D) RT (4 Gy) alone vs. RT (4 Gy) + gefitinib (6 mg/l), and (E) RT (6 Gy) alone vs. RT (6 Gy) + gefitinib (6 mg/l).
Discussion
The cell lines analyzed showed varying expression of EGFR and ErbB2. The response to gefitinib treatment was heterogeneous and even antagonistic effects of gefinitib on the cytotoxicity induced by irradiation were observed in some cases. This study demonstrates that duration of incubation with gefitinib, as well as the time for administration of gefitinib in relation to irradiation is important for the cytotoxicity of irradiation.
Short pre-administration prior to irradiation followed by continuous incubation with gefitinib significantly increased the cytotoxicity in three of four cell lines. In contrast, the human glioma cell line 251MG, rather seemed to be protected by this treatment schedule, at least at lower concentrations of gefitinib.
Pre-administration with gefitinib for 24 h prior to irradiation without any subsequent incubation with this agent, significantly increased cytotoxicity only in the human glioma cell line SF-767. An increased cytotoxicity was seen in the rat glioma cell line BT4C, but was obvious only at radiation doses of 2 and 4 Gy, in combination with the higher concentration of gefitinib. The differences in the ability of gefitinib to increase radio-sensitivity due to timing might be explained by growth arrest and accumulation in G0-G1 phase of the cell cycle Citation[13]. Cells in the G0-G1 phase are known to be more resistant to irradiation than cells in other phases of the cell cycle Citation[14]. In a previous study, pre-treatment with gefitinib for 24 h prior to irradiation had radio-protective effects on 251MG cells, which supports our results seen after the same treatment schedule Citation[12]. However, the same study also demonstrated that with short-pre-treatment with gefitinib prior to irradiation, radio-sensitizing effects was achieved in the same cell line. The discrepancy in the radio-sensitizing effects by gefitinib obtained by Stea et al., and our study might be explained by the different time of exposure to gefitinib until cell viability was measured, and also by the use of another method to evaluate the radio-sensitizing effects of the combined treatment. Finally, post-irradiation treatment with gefitinib increased cytotoxicity in all cell lines, except for 251MG, where toxicity to post-irradiation treatment was obvious only at 2 Gy. The mechanism behind this increased cytotoxicity seen after treatment with ZD1839 up to 24 hours post-irradiation is unclear. However, it may be that ZD1839 interferes with cell cycle progression in such a way that it leads to unrepairable double strand breaks or ZD1829 may be amplifying radiation-induced apoptosis.
The expression of EGFR and ErbB2 showed no clear correlation to treatment response in this study. In the rat brain endothelial cell line RBE4, no EGFR expression was found, and in the rat glioma cell line BT4C the EGFR expression was low. However, both cell lines expressed ErbB2 and were sensitive to gefitinib alone, or combined with irradiation treatment. Similar results from in vitro studies on human breast cancer cell lines have been reported, indicating that tumor cells with ErbB2 expression are sensitive to gefitinib Citation[7]. The human glioma cell lines 251MG and SF-767 both expressed EGFR and ErbB2, but 251MG cells seemed to be rather resistant to gefitinib alone or when combined with irradiation, compared to SF-767 cells. This observation supports the hypothesis that in malignant glioma there is no strong correlation between the levels of EGFR and the response to gefitinib, which also have been proposed for other tumors Citation[6]. Furthermore, EGFR signaling may be just one of several molecular mechanisms leading to the observed lack of synergism.
Stimulation with EGF induced phosphorylation of EGFR and Akt, only in the human glioma cell lines 251MG and SF-767. Gefitinib was able to inhibit the phosphorylation of EGFR in both cell lines, but failed to inhibit Akt phosphorylation in the 251MG cell line. This could explain that gefitinib had different cytotoxic response in 251MG cells compared to the other cell lines in our study, since other preclinical studies have suggested that activation of Erk (extracellular signal regulated kinase receptor) and Akt are down-regulated by gefitinib Citation[15] and that persistent activation of the pathways have a role in resistance to gefitinib Citation[15], Citation[16]. Furthermore, it has been shown that either radiation or chemotherapy can enhance signaling through EGFR, leading to activation of downstream pathways involving RAS, PI3K/AKT, and MAPK, which, once activated, can mediate resistance to the other therapeutic modality Citation[17]. This directs us to further examine the downstream pathways regulated by EGFR to more mechanistically understand how EGFR may lead to this observed antagonism.
Flow cytometry with TUNEL technique demonstrated that the increased cytotoxicity seen as a result of the different treatment schedules involved increased nuclear DNA fragmentation in the cells. The most pronounced effect on nuclear DNA fragmentation was observed in the rat brain endothelial cell line RBE4. Endothelial cells from several neoplasms have been shown to express EGFR Citation[18]. Binding of TGF-a to EGFR on the endothelial cells has been shown to stimulate their proliferation Citation[19]. Moreover, inhibition of EGFR leads to apoptosis of endothelial cells and reduction in neovascularity Citation[20]. It has been suggested that endothelial cells may represent principal targets for irradiation, and tumor cell death may represent a secondary event Citation[21], Citation[22]. However, the importance of treatment effects on the different cellular compartments of a tumor remains controversial. Even though the rat brain endothelial cell line RBE4 did not express EGFR, the cell line demonstrated decreased cell viability when gefitinib was combined with irradiation. Since malignant glioma is highly vascular, this result warrants further investigations using our in vivo rat glioma model regarding the ability of gefitinib and similar drugs to modify the response of endothelial cells to irradiation. In the human glioma cell line 251MG, treatment with gefitinib revealed somewhat conflicting results regarding the cell viability, compared to nuclear DNA fragmentation. In this cell line, pre-administration with gefitinib 30 min prior to irradiation protected the cells from the effects of irradiation, at least with the lower concentration of gefitinib, but an increased nuclear DNA fragmentation was obvious after the same treatment. In attempts to clarify these somewhat conflicting results, the 251MG cells also were analyzed 3 days after irradiation. At that time, increased cell viability were correlated to no increased nuclear DNA fragmentation in the cells treated with the lower concentration of gefitinib. Furthermore, cell numbers after the same treatment directly measured by a cell counter (Coulter Counter Multisizer®) verified the results of the indirect FMCA assay. Post-irradiation treatment with gefitinib also displayed increased nuclear DNA fragmentation in all the analyzed cell lines, with the most pronounced effect in the BT4C cell line.
Gefitinib has been shown to be active in pre-clinical models and was taken into clinical trials in patients with advanced cancers that were known to overexpress the EGF receptor. Gefitinib has induced substantial clinical response in about 10% of patients with chemotherapy refractory non-small cell lung cancer Citation[23], Citation[24]. However, at least for patients with non-small lung cancer, no clear correlation has been found between EGFR expression and treatment response Citation[6]. Nearly all lung cancer patients that respond to gefitinib harbor somatic mutations within the EGFR kinase domain, whereas no mutations have been found in non-responsive cases Citation[25].
In conclusion, the results demonstrated a marked heterogeneity between different cell lines regarding the effects of gefitinib when combined with irradiation. It is evident that gefitinib probably have effects not only mediated by EGFR inhibition. This study shows the importance of timing for administration of gefitinib in relation to irradiation, since more or less inaccurate timing might explain treatment failure when selective inhibitors of signal transduction are combined with conventional therapies. The results in this study can be of clinical importance for optimizing future clinical protocols where selective inhibitors such as gefitinib are used in treatment of malignant glioma.
Acknowledgements
This study was supported by grants from the Swedish Cancer Society and the Lion's Cancer Research Foundation, Umeå University, Sweden. Annika Holmberg, Lotta Nordström, and Le Thu Trinh are acknowledged for skilful laboratory help. We also thank Professor Roger Henriksson for thoughtful comments to the manuscript.
References
- Joki T, Carroll RS, Dunn IF, Zhang J, Abe T, Black PM. Assessment of alterations in gene expression in recurrent malignant glioma after radiotherapy using complementary deoxyribonucleic acid microarrays. Neurosurgery 2001;48:195–201; Discussion 201–2.
- Yarden Y, Sliwkowsky MX. Untangling the ErbB signalling network. Nat Rev Mol Cell Biol 2001; 2: 127–37
- Bigner SH, Humphrey PA, Wong AJ, Vogelstein B, Mark J, Friedman HS, et al. Characterization of the epidermal growth factor receptor in human glioma cell lines and xenografts. Cancer Res 1990; 50: 8017–22
- Andersson U, Guo D, Malmer B, Bergenheim AT, Brannstrom T, Hedman H, et al. Epidermal growth factor receptor family (EGFR, ErbB2-4) in gliomas and meningiomas. Acta Neuropathol 2004; 108: 135–42
- Ciardiello F, Caputo R, Bianco R, Damiano V, Pomatico G, De Placido S, et al. Antitumor effect and potentiation of cytotoxic drugs activity in human cancer cells by ZD-1839 (Iressa), an epidermal growth factor receptor-selective tyrosine kinase inhibitor. Clin Cancer Res 2000; 6: 2053–63
- Han SW, Hwang PG, Chung DH, Kim DW, Im SA, Kim YT, et al. Epidermal growth factor receptor (EGFR) downstream molecules as response predictive markers for Gefitinib (Iressa®, ZD1839) in chemotherapy-resistant non-small cell lung cancer. Int J Cancer 2005; 113: 109–15
- Moasser MM, Basso A, Averbuch SD, Rosen N. The tyrosine kinase inhibitor ZD1839 (“Iressa”) inhibits HER2-driven signalling and suppresses the growth of HER2-overexpressing tumor cells. Cancer Res 2001; 61: 7184–8
- Li B, Chang CM, Yuan M, McKenna WG, Shu HK. Resistance to small molecule inhibitors of epidermal growth factor receptor in malignant glioma. Cancer Res 2003; 63: 7443–50
- Sundberg AL, Almqvist Y, Orlova A, Blomquist E, Jensen HJ, Gedda L, et al. Combined effect of gefitinib ('Iressa', ZD1839) and targeted radiotherapy with 211At-EGF. Eur J Nucl Med Mol Imaging 2003; 30: 1348–56
- Learn CA, Hartzell TL, Wikstrand CJ, Archer GE, Rich JN, Friedman AH, et al. Resistance to tyrosine kinase inhibition by mutant epidermal growth factor receptor variant III contributes to the neoplastic phenotype of glioblastoma multiforme. Clin Cancer Res 2004; 10: 3216–24
- Rich JN, Reardon DA, Peery T, Dowell JM, Quinn JA, Penne KL, et al. Phase II trial of gefitinib in recurrent glioblastoma. J Clin Oncol 2004; 22: 133–42
- Stea B, Falsey R, Kislin K, Patel J, Glanzberg H, Carey S, et al. Time and dose-dependent radiosensitization of the glioblastoma multiforme U251 cells by the EGF receptor tyrosine kinase inhibitor ZD1839 ('Iressa'). Cancer Lett 2003; 202: 43–51
- Fan Z, Baselgam J, Masui H, Mendelsohn J. Antitumor effect of anti-epidermal growth factor receptor monoclonal antibodies plus cis-diamminedichloroplatinum on well established A431 cell xenografts. Cancer Res 1993; 53: 4637–42
- Hall EJ. Radio-sensitivity and cell age in the mitotic cycle. Radiobiology for the Radiobiologist. 5th ed. Lippincott Williams & Wilkins, Philadelphia 2000; 51–66
- Janmaat ML, Kruyt FA, Rodriguez JA, Giaccone G. Response to epidermal growth factor receptor inhibitors in non-small cell lung cancer cells: Limited antiproliferative effects and absence of apoptosis associated with persistent activity of extracellular signal-regulated kinase or Akt kinase pathways. Clin Cancer Res 2003; 9: 2316–26
- Magne N, Fischel JL, Dubreuil A, Formento P, Poupon MF, Laurent-Puig P, et al. Influence of epidermal growth factor receptor (EGFR), p53 and intrinsic MAP kinase pathway status of tumour cells on the antiproliferative effect of ZD1839 (“Iressa”). Br J Cancer 2002; 86: 1518–23
- Chakravarti A, Chakladar A, Delaney MA, Latham DE, Loeffler JS. The epidermal growth factor receptor pathway mediates resistance to sequential administration of radiation and chemotherapy in primary human glioblastoma cells in a RAS-dependent manner. Cancer Res 2002; 62: 4307–15
- Bohling T, Hatva E, Kujala M, Claesson-Welsh L, Alitalo K, Haltia M. Expression of growth factors and growth factor receptors in capillary hemangioblastoma. J Neuropathol Exp Neurol 1996; 55: 522–7
- Goldman CK, Kim J, Wong WL, King V, Brock T, Gillespie GY. Epidermal growth factor stimulates vascular endothelial growth factor production by human malignant glioma cells: A model of glioblastoma multiforme pathophysiology. Mol Biol Cell 1993; 4: 121–33
- Bruns CJ, Solorzano CC, Harbison MT, Ozawa S, Tsan R, Fan D, et al. Blockade of the epidermal growth factor receptor signalling by a novel tyrosine kinase inhibitor leads to apoptosis of endothelial cells and therapy of human pancreatic carcinoma. Cancer Res 2000; 60: 2926–35
- Denekamp J. Endothelial cell proliferation as a novel approach to targeting tumour therapy. Br J Cancer 1982; 45: 136–9
- Denekamp J, Hobson B. Endothelial cell proliferation in experimental tumours. Br J Cancer 1982; 46: 711–20
- Baselga J, Rischin D, Ranson M, Calvert H, Raymond E, Kieback DG, et al. Phase I safety, pharmacokinetic, and pharmacodynamic trial of ZD1839, a selective oral epidermal growth factor receptor tyrosine kinase inhibitor, in patients with five selected solid tumor types. J Clin Oncol 2002; 20: 4292–302
- Giaccone G, Herbst RS, Manegold C, Scagliotti G, Rosell R, Miller V, et al. Gefitinib in combination with gemcitabine and cisplatin in advanced non-small-cell lung cancer: A phase III trial--INTACT 1. J Clin Oncol 2004; 22: 777–84
- Lynch TJ, Bell DW, Sordella R, Gurubhagavatula S, Okimoto RA, Brannigan BW, et al. Activating mutations in the epidermal growth factor receptor underlying responsiveness of non-small-cell lung cancer to gefitinib. N Engl J Med 2004; 350: 2129–39