Abstract
One of the long-standing problems in carbon-ion therapy is the monitoring of the treatment, i.e. of the delivered dose to a given tissue volume within the patient. Over the last 8 years, in-beam positron emission tomography (PET) has been used at the experimental carbon ion treatment facility at the Gesellschaft für Schwerionenforschung (GSI) Darmstadt and has become a valuable quality assurance tool.
In order to determine and evaluate the correct delivery of the patient dose, a simulation of the positron emitter distribution has been compared to the measurement. One particular effect is the blurring as well as the reduction of the measured activity distribution via washout.
The objective of this study is the investigation of tissue dependent effective half-lives from patient data. We find no significant dependence of the effective half-life on the Hounsfield unit but on the local dose. The biological half-life within the high dose region is longer than in the low dose region. Furthermore, the influence of the overall treatment time on the kinetics of the positron emitter is reported. There are indications for a metabolic response of the tissue on the irradiation. Taking into account the biological half-life in the simulation leads to an improvement of the quality of the PET-images in some cases.
At the experimental carbon ion treatment facility at the Gesellschaft für Schwerionenforschung (GSI) Darmstadt, Germany, a double-head positron emission tomography (PET) scanner has been in operation since 1998 Citation[1], Citation[2]. Patients suffering from tumours mostly in the head and neck region are irradiated with 12C-ions Citation[3]. This treatment typically uses a fractionated irradiation scheme, with 20 daily fractions usually applied in two portals. Since small density deviations in the beam path between the treatment plan and the actual situation at the time of the treatment may result in considerable changes in the dose deposition, a monitoring of the delivered dose is highly desirable Citation[2]. At present, in-beam PET is the only technique which can fulfill these requirements Citation[1], Citation[2]. The physical basics of in-beam PET are peripheral collisions between the incoming 12C-ions and the atomic nuclei of the tissue leading to β+-activation via nuclear reactions. During the irradiation with 12C-beams, a mixture of positron emitting isotopes with different half-lives is produced, the most abundant are 11C (T1/2=1222.8 s), 15O (T1/2=121.8 s), 13N (T1/2=597.6 s) and 10C (T1/2 =19.3 s). Their relative yields depend on the stoichiometry of the irradiated tissue. The spatial activity distribution does not correlate with the delivered dose, since the dose deposition and the β+-activity production are caused by different physical processes. Therefore, the positron emitter distribution expected has to be calculated by means of a Monte Carlo simulation based upon the treatment plan Citation[4]. All processes from the arrival of the particles until the detection of the γ-rays in the PET scanner are taken into account. This result is compared to the measurement, and information concerning the accuracy of the beam portal position, anatomical changes and range deviations is obtained Citation[2]. The simulation code operates as an event-generator and provides a list mode PET datafile which is of the same structure as the measured one Citation[4]. Simulated and measured data are reconstructed in a similar way Citation[5], thus the effects of the limited angle geometry and further reconstruction artefacts Citation[6], Citation[7] are the same in both images. Nevertheless, there are differences between simulation and measurement that can be attributed to metabolic processes taking place in living organisms, which is predominantly perfusion driven washout of the positron emitters. This is indicated by the analysis of the chemistry of ions produced via nuclear reactions Citation[8]. Since comprehensive data on the washout dependence on the tissue and the type of the radionuclides are not available, these processes are not taken into account in the current version of the simulation code. In order to obtain such data, we analysed the results of a set of in-beam PET scans taken during therapeutic 12C-irradiation. From the point of view of an efficient workflow, the treatment time should not be extended due to in-beam PET. Therefore, data taking stops automatically when the patient couch starts moving towards the next treatment position, or when the patient's restraint is removed. In consequence, this procedure allows us to measure the decay of the radioactivity produced during therapeutic irradiation for an additional 40 s.
Other authors Citation[9], Citation[10] investigated the washout effect in rabbits with radioactive 11C-beams as well as with stable 12C-beams. A model to quantify three different washout components was proposed by Citation[10]. They used 11C-beams to measure the two longest washout components and a 10C-beam for the short component. An approach determining an isotope specific half-life was given by Citation[11] using a five compartment model. However, for an estimation of the model parameters the count rate achieved with the in-beam PET method was found to be too low for a fit of more than one isotope. Citation[12] present a tool for a tissue-dependent analysis of the in-beam PET data using volumes of interest (VOI), chosen on the basis of the planning computer tomograms (CT) where the washout is determined. In a second step all events coming from coincidence channels intersecting with that VOI are taken and histogrammed. This was not followed up since it is not feasible to choose VOI containing just a single type of tissue because of the inhomogeneity along a coincidence channel. Nevertheless, an effective mean life of τ(eff)=165 s was found for soft tissue and τ(eff)=1220 s for bone. The half lives determined in this work can be used to improve the prediction of the positron emitter distribution through describing the occurring processes more realistic and closer to the reality in vivo.
Materials and methods
The in-beam positron camera
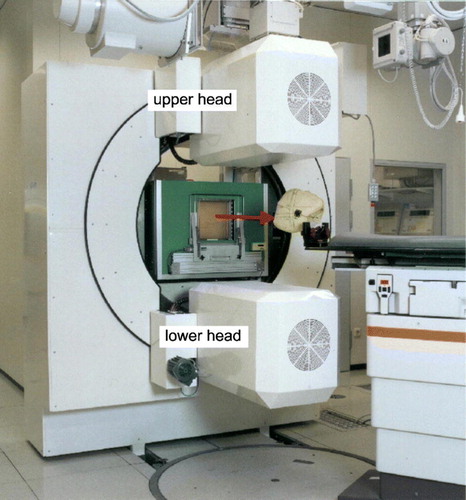
The PET scanner was integrated into the GSI treatment facility and consists of two detector heads (cf. ) of bismuth germanate block detectors from the commercial ECAT EXACT PET systems (CTI PET systems Inc. Knoxville, TN, USA) Citation[2]. Each detector head has a sensitive area of 42×21 cm2, with 2 048 crystal pixels resulting in 4 194 304 lines of response (LOR). The coincidence detection efficiency of the system was measured by means of a 22Na point source and found to be 2.3% at the centre of the field of view. The coincidence time window is 12 ns, and the time difference between the prompt and the delayed window (for random coincidence estimation) is 128 ns. All data are registered in list-mode, i.e. the coincidence data word is stored with the time information. The maximum image space is 260×130×140 voxels with an edge length of a cubic voxel of 1.6875 mm. In order to avoid interference between the therapeutic beam delivery and the PET detectors, and to allow for a flexible patient positioning, which is of highest priority in radiooncology, the technical solution of choice for an in-beam PET scanner has to be the double head geometry rather than a full ring geometry Citation[6], Citation[7]. The implementation at the GSI facility covers an azimuth of 120 degree, i.e. 60 degree by each detector head. Longitudinal tomograms are reconstructed from the data of this detector arrangement by means of a dedicated fully 3D implementation of the maximum likelihood expectation maximisation (MLEM) algorithm Citation[5], Citation[15]. These show a spatial resolution of ∼5 mm within the longitudinal planes whereas the spatial resolution amounts to ∼10 mm perpendicular to these Citation[15], due to the limited angle imaging.
Figure 1. Double head positron camera at the treatment site at GSI Darmstadt, Germany. The red arrow denotes the beam direction.
Experiments
Phantom experiments
The single physical half-life needed to calculate a biological half-life was determined by means of phantom experiments Citation[16]. In these experiments, 120 beam pulses of E = 337.5 AMeV with an intensity of 2.0°·°108 ions/ pulse were delivered to a graphite phantom with the dimensions of 9×9×15 cm3 and a density of ρ? = 1.795 gcm-3. In a second experiment, a water phantom was used. To avoid thermal convection which causes blurring of the positron emitter distribution, a small amount of gelatine was added to the water phantom, resulting in a stoichiometric composition of H2OC0.02. The phantom had a size of 9×9×30 cm3 and a density of ρ = 1.0 gcm−3. Both phantoms were placed in the centre of the field of view of the PET scanner. The time structure of the beam was comparable to that used during therapy; this means that the extraction took about 1.4 s, followed by a pause of about 3 s (cf. ). The pencil beams had a diameter of about 6 to 7 mm FWHM at the isocentre.
Figure 2. Time-event-histogram of a patient irradiation. During the particular irradiation shown the beam delivery starts with the lowest energy necessary for irradiating the tumour. The energy is increased stepwise until the particles reach the distal edge of the tumour. The beam delivery was interrupted by about 1 minute (dash-dotted lines) due to technical reasons. The rectangular graph in the inset denotes the beam extraction from the synchrotron, high value means beam extraction, low value extraction pause. The information on the status of the beam was also stored in the data stream. The annihilation events registered during beam extraction are rejected from further processing, since they are massively corrupted by random coincidences from prompt γ-rays following nuclear reactions between the projectiles and the atomic nuclei of the target Citation[2], Citation[13], Citation[14]. The dotted line indicates the end of the irradiation and the beginning of the 40 s decay measurement.
![Figure 2. Time-event-histogram of a patient irradiation. During the particular irradiation shown the beam delivery starts with the lowest energy necessary for irradiating the tumour. The energy is increased stepwise until the particles reach the distal edge of the tumour. The beam delivery was interrupted by about 1 minute (dash-dotted lines) due to technical reasons. The rectangular graph in the inset denotes the beam extraction from the synchrotron, high value means beam extraction, low value extraction pause. The information on the status of the beam was also stored in the data stream. The annihilation events registered during beam extraction are rejected from further processing, since they are massively corrupted by random coincidences from prompt γ-rays following nuclear reactions between the projectiles and the atomic nuclei of the target Citation[2], Citation[13], Citation[14]. The dotted line indicates the end of the irradiation and the beginning of the 40 s decay measurement.](/cms/asset/0aa9b287-f192-4b32-9b36-48eef51fca3c/ionc_a_276966_f0002_b.jpg)
Patient studies
The PET measurements were performed routinely during each therapeutic irradiation. Only the first field of the daily treatment was routinely evaluated, since the results for the subsequent portals are corrupted by the radioactivity deposited by the previous ones. The order of the beam portals was alternated from day to day unless a critical clinical incidence was found. Each measurement included the patient irradiation followed by a 40 s measurement of the decay after the end of the irradiation (cf. ). These decay measurements did not affect the normal treatment course, because this time is needed by the therapist to enter the treatment cave and to move the patient to the position for the next portal. In case that the irradiation procedure gets interrupted for a short time, the patient remains in the adjusted position and the PET measurement continues.
Data analysis
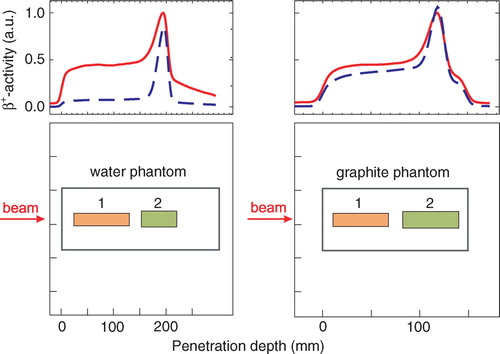
In order to estimate an effective half-life, the data taken during the decay time after the stop of the irradiation were fitted to the function A (t)=A0 e−λ t with λ as the only free parameter. The effective half-life is determined by the half-lives of the beam generated β+-active nuclei. The projectile fragments are neutron deficient isotopes of the projectiles whereas the target fragments can be generated only from nuclei of the target. While target fragments are created along the whole path of the projectile, the projectile fragments accumulate towards the end of the projectile path because of their forward momentum Citation[17], leading to differences in the effective half-lives of the deposited emitters in the different regions. So their relative abundances strongly depend on the position in the target. In a water target, the major target fragment is 15O and the dominating projectile fragment is 11C, which have half-lives that differ by one order of magnitude. The coincidences from target fragments were separated from those from projectile fragments by analysing spatial subsets of the measured data. Two different regions of interest (ROI) were defined in the phantoms (cf. ), ROI 1 for estimating an effective half-life of the target fragments and ROI 2 were mainly projectile fragments contributed to the signal. While this yields good results for phantom data, it cannot be used for patient data, because different beam energies were superimposed. For patient data, we used a different method described in section “Patient studies”.
Figure 3. β+-activity depth profiles in different targets obtained by using back projection. The red lines display the activity measured during the irradiation, the blue dashed lines give the activity measured between 10 and 20 min after the end of the irradiation. The red curve was normalised to the maximum of the measured β+-activity during the irradiation and the blue curve was scaled according to this. The peak at the distal end arises from long-lived projectile fragments such as 11C. Target fragments were produced along the whole beam path. The lower row shows the location of the ROI (1) and ROI (2) for separating the coincidences from target (1) and projectile (2) fragments, respectively.
Results
Phantom experiments
Since the composition of the β+-emitting fragments depends not only on the region inside the target (cf. section “Data analysis”) but also on the follow-up time due to the different half-lives, i.e. the relative abundances of the β+-emitters varies over time, and consequently a dependence of the free parameter λ on the follow up time was evident (cf. , ). Analysing the subsets of the measured data according to their spatial position, a substantially higher effective half-life for a 300 s follow-up time was observed in ROI 2 than in ROI 1 of the water phantom due to the accumulation of the long-lived projectile fragments, such as 11C, in ROI 2. For a measurement time of 40 s after the stop of the irradiation, a shorter effective half-life for ROI 2 with respect to ROI 1 was found. In the 40 s decay time available for in-beam PET data acquisition after finishing a patient irradiation, the influence of the long-lived isotopes on the fitted effective half-life is negligible. This was even more pronounced in the case of the graphite target where the 40 s decay measurement was dominated by the decay of the short-lived isotope, namely 10C. Projectile fragmentation has a higher probability for forming 10C than target fragmentation, since the 2-step neutron stripping (12C → 11C → 10C) gives an additional contribution to the 2-neutron stripping process (12C → 10C) taking place during target and projectile fragmentation with equal probability. If the time of the measurement was extended, the half-life increased due to the increased fraction of 11C. Considering the average mass ratio of O/C = 3.2 in human tissue, an effective half-life of the mixture of the positron emitters was calculated as weighted mean of the effective half-lives in the water and graphite phantoms fitted 40 s after the end of the irradiation according to the fraction in human tissue and found to be T1/2(eff, phys)=(128.1±3.3) s. The statistical error of the half-lives was taken two times the standard deviation of the fitted parameter.
Figure 4. Effective half-lives T1/2(eff, phys) as a function of the decay time td. All measured true coincidences were used for the fit. The effective half-life of human tissue was calculated as weighted mean of the half-lives of the graphite and water target.
Table I. Effective half-lives T1/2(eff, phys) in the phantoms analysing different spatial subsets of the data as a function of the decay time td after finishing the irradiation. The regions are defined according to . The error is two times the standard deviation of the fitted parameter. If the ROI is referred to as ‘phantom’ all data were used for that fit.
Patient studies
In this study, PET data from patients with chordomas and chondrosarcomas in the head and neck region treated with 12C ion beams at GSI between July 2003 and June 2005 have been evaluated. Only patient data with two opposite portals and an irradiation protocol comprising 15 fractions and 5 boost fractions were investigated.
Extraction of the effective half-lives
Limited angle artefacts in the reconstructed data may reduce the accuracy of the determination of effective half-lives. Therefore, these values are calculated directly from the list mode data, i.e. without any tomographic reconstruction. The basis for this is sorting the list mode data by their LOR. Thus, decay curves can be reconstructed either for each individual LOR or for appropriately combined groups of LOR to enhance the counting statistics of the decay curves. This technique was applied for distinguishing decay curves of different tissue types as discussed in the following.
Perfusion is assumed to be the major reason for the washout of the positron emitters. Thus, a correlation between the tissue type along the LOR of the positron camera (e.g. brain tissue vs. bone) and the effective half-lives may be expected. The only available information in this respect is provided by the planning CT, i.e. the Hounsfield unit (HU). However, the mean HU, HUmean, along a LOR is not sufficient for classification; the standard deviation of the HU within each LOR was additionally introduced, to take into account tissue inhomogeneity. Consequently, a HUmean and its standard deviation, σHU, were calculated from the CT data set for each LOR intersecting the irradiated volume, where D>0. These data are shown in as a two-dimensional histogram. Thereby only HU values larger than-600 were taken into account since no creation of positron emitters is expected in air. A further restriction was to consider only voxels where according to the treatment plan dose was deposited. The ROI (cf. ) were chosen to differentiate by tissue types and to allow the evaluation of only those coincidences which fulfill the specified values of a given ROI. ROI I was supposed to contain rather homogeneous brain tissue, while ROI II was expected to include soft, but inhomogeneous tissue and ROI III was for bone. Because no LOR contained only bone, a large standard deviation was assigned to ROI III. The anatomical mapping is displayed in . In a PET measurement of one fraction only 10 000 to 300 000 coincidences were registered. In order to increase the statistics, the data of 14 patients with 2 portals each, were combined to reduce the statistical uncertainty of the fit. The influence of the stoichiometric composition is considered to be small since the 40 s decay measurement has been found to be nearly independent on the composition (cf. Section “Phantom experiments”). The results are given in . No dependence of the effective half-life on the HUmean and the σHU values was observed. A weighted mean dependent on the absolute frequency of the LOR of the effective half-life on the basis of the data given in of T1/2(eff)=(75.4±2.5) s can be calculated and used as a biological half-life T1/2(biol)=(128.8±21.3) s according toregardless of the HU of the CT and applied to all positron emitters created in the patient. The effect of such a global washout can be seen in and .
Figure 5. Two-dimensional histogram for the fraction of the LOR intersecting the irradiated volume as a function of HUmean and σHU. The corresponding anatomical regions for a particular patient can be seen in .
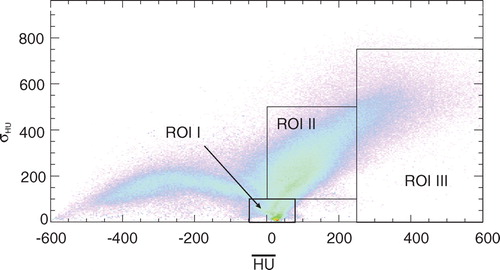
Figure 6. Effective half-lives in the patient and the back projections of the used coincidences according to the regions defined in to outline the corresponding anatomical regions. The left figure corresponds to ROI I, the middle one to ROI II and the right one to ROI III, respectively.
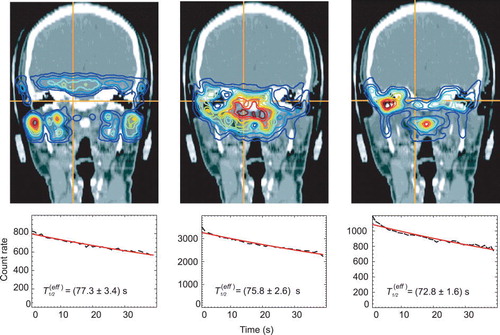
Figure 7. β+-activity distributions superimposed onto a patient CT. (1) shows the measurement, (2) simulation without considering the washout, (3) simulation with a weighted mean of T1/2(biol), (4) a dose dependent T1/2(biol) was used. The circles are to guide the eyes where an improvement of the simulation over a biological half life is obvious.
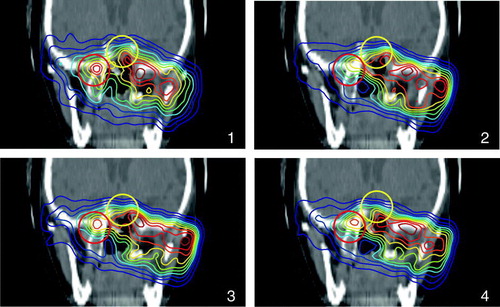
Figure 8. β+-activity distributions superimposed onto a patient CT. (1) shows the measurement, (2) simulation without considering the washout, (3) simulation with a weighted mean of T1/2(biol), (4) a dose dependent T1/2(biol) was used. The solid line shows the range, which is reproduced much better in the simulations considering the washout, the circles are to guide the eyes where an improvement of the simulation over a biological half life is obvious.
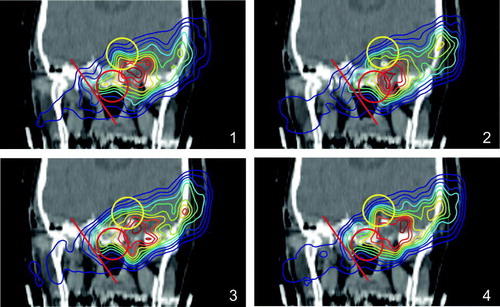
Table II. Effective half-lives as a function of the HUmean and σHU as outlined in . The error is two times the standard deviation of the fitted parameter.
The effective half-life as a function of the delivered dose
To investigate the effect of the different dose levels to the effective half-life, we selected all LOR in the ranges 50–100% and 90–100% of the total dose intersecting at least 10 voxels of a given minimum dose value. For 0–50% and 0–90% lower and upper thresholds were defined, selecting all coincidence channels intersecting at least one voxel of the given dose range and having no voxel with a higher value than the upper threshold. LOR containing only air were rejected. In order to improve the statistics, data of 55 patients (in average) were combined. Assuming the same physical half-life for all dose levels and all tissue compositions, a biological half-life T1/2(biol) can be estimated. This assumes that the washout rate is constant during the measuring time. So in the dose range of 90–100%, i.e. in the area of the tumour the biological half-life is higher than in the surrounding tissue (cf. ). In the simulation, the biological half-lives of the dose ranges 0–90% and 90–100% were applied to the irradiated volume for HU < 500, since in bone no washout is expected, which results in an improvement of the matching with the measurement in some cases (cf. and ).
Table III. Effective half-lives estimated from the patient data and biological half-lives calculated according to the formula given in section “Extraction of the effective half-lives” in dependence on the dose. The error is two times the standard deviation of the fitted parameter.
The effective half-life as a function of the overall treatment time
This analysis addresses the question whether in-beam PET data, in particular the effective half-life of the beam induced β+-emitters, reflect the tumour response to radiation therapy. Data of 50 patients were analysed. All in-beam PET data sets with a shorter decay measurement than 40 s were rejected. The number of patient data sets varies from 38 to 50. In general, a reduction of the effective half-life over the time of fractionated irradiation (cf. and ) has been found. Although not significant within the statistical errors it seems to be obvious that the reduction of T1/2(eff) is faster within the high dose region than outside regarding the overall treatment time. The slopes of the fits are given in with their maximum error.
Figure 9. Influence of the treatment time on the effective half-life as a function of the dose. In the upper line, the back projected coincidences emerging from the regions which meet the conditions are displayed as an example. The left side shows the dose range 0–90%, the right side that for 90–100% and the diagrams in the lower line give the decrease of the effective half-life during the treatment.
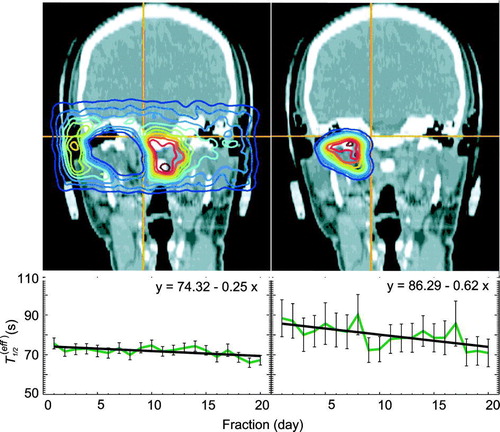
Table IV. The rise of the fit of the effective half-life as a function of the treatment time. The given error is two times the uncertainty for the fit parameter.
Discussion
As outlined in Citation[11] an efficient individual correction of the physiological washout of positron emitters produced during therapeutic 12C irradiation is feasible on perfusion data obtained from a H215O PET-scan. Moreover, dedicated MRI perfusion measurements can be applied. All these techniques would require additional diagnostic effort and a higher stress to the patient and should not be applied routinely. Therefore, to gather information for the washout correction at future patients, mean tissue dependent half lives for a large group of patients irradiated with 12C ions have been determined retrospectively from their in-beam PET data and the treatment planning CT. To reduce the variation in the results the analysis has been restricted to patients suffering from chordoma or chondrosarcoma of the skull base and treated by means of nearly equal irradiation geometry. Therefore, it should be noted that the data presented are average values.
We expected to measure a significantly higher effective half-life in the bone (ROI III) than in mixed tissue (ROI II) or in soft tissue (ROI I) including the brain, which is well perfused. The reasons for a missing dependence of T1/2(eff) from HUmean may be the high inhomogeneity of the LOR as well as the short decay measurement of 40 s after finishing the therapeutic irradiation. This time is comparable to the half-life of 10C (T1/2=19.3 s), but considerably shorter than the half-lives of the most abundant positron emitters, i.e. 11C (T1/2=1222.8 s) and 15O (T1/2=121.8 s). A reliable measurement of longer decay or washout components would require a significant prolongation of the PET scan after finishing the irradiation, which is not acceptable with respect to patient comfort and the workflow of the therapy. The definition of ROI in the HUmean, σHU histogram selecting only LOR, which merely intersect homogeneous tissue (i.e. σHU ∼ 0) leads to a very poor statistics of the decay curves and consequently to a large uncertainty of the extracted half-lives. Nevertheless a highly significant dose dependence of the effective half-life was found. The observed longer effective half-life in the high dose area may be due to a reduced perfusion of the tumour. Moreover a dependence of the effective half-life on the number of fractions delivered, and therefore, an indication of tumour response was observed. Generally the effective half-life decreases during the treatment. This reduction of the half-lives is even more pronounced in the high dose region. The most likely explanation for the observed reduction of the effective half-life is a tumour perfusion increasing with the treatment time. This can be related to the same phenomena causing tumour reoxygenation during radiation therapy like the opening of temporarily closed blood vessels, an improved microcirculation at reduced tumour tissue pressure or the reduction of inter-capillary-distance at radiation induced tumour shrinkage. Although the data show a clear tendency the effect is not significant for the analysed species of tumours, which are characterised as slow growing and late responding Citation[18], the p-value was calculated to be 0.78. However, extending the in-beam PET method to other tumours having faster dynamics would require taking into account the change in the effective half-life during therapeutic irradiation course into the prediction of positron emitters.
Conclusion
The in-beam PET data taken in the first 40 s after finishing therapeutic irradiation do not show a remarkable differentiation of tissue with respect to the washout rate of the 12C beam induced β+-radioactivity. This is in accordance with the data of Citation[10], who found for rabbit thigh muscle and brain the washout rate to be dominated by time constants exceeding 100 s. Therefore, if in-beam PET measurements can be restricted to scanning times below 100 s, the influence of tissue dependent washout processes to the spatial distribution of beam induced β+-activity can be expected to be drastically diminished. This is furthermore expected to lead to a higher correspondence between the measured in-beam PET images and those predicted from the treatment plan. In consequence it may become feasible to apply automatic procedures for detecting and quantifying deviations between the treatment plan and the delivered dose distributions Citation[2], Citation[19]. Unfortunately this cannot be experimentally verified at the unique in-beam PET installation at the therapy unit of GSI Darmstadt, since due to the parameters of this beam delivery typical irradiation times per portal are between 3 and 10 min (cf. ). New ion therapy installations, like the Heidelberger Ionenstrahl-Therapiezentrum (HIT), will be optimized for a time efficient therapy workflow by delivering a higher particle flux reducing the typical treatment times to a mean value below 100 s Citation[20]. This development can only be exploited for reaching a higher image quality if future in-beam PET scanners are of considerably higher detection sensitivity than the current installation at GSI Darmstadt Citation[2]. This requires detectors covering a large solid angle as discussed in Citation[6] and Citation[7].
Acknowledgements
The authors would like to thank T. Haberer and S. Brons from the Heidelberger Ionenstrahl-Therapiezentrum as well as D. Schardt from the Biophysics Department at GSI Darmstadt, for their help during preparation and run of the experiments, as well as the consistent support during the therapy as well as the PET group of the Radiation Physics department of FZ Rossendorf, Germany. This work has been supported by the GSI Darmstadt, Germany and the European Union (QLRT-2001-01574).
References
- Enghardt W, Debus J, Haberer T, Hasch BG, Hinz R, Jäkel O, et al. Positron emission tomography for quality assurance of cancer therapy with light ion beams. Nucl Phys A 1999; 654: 1047c–50c
- Enghardt W, Crespo P, Fiedler F, Hinz R, Parodi K, Pawelke J, et al. Charged hadron tumour therapy monitoring by means of PET. Nucl Instr Meth A 2004; 525: 284–8
- Schulz-Ertner D, Nikoghosyan A, Thilmann C, Haberer T, Jäckel O, Karger C, et al. Results of carbon ion radiotherapy in 152 patients. Int J Radiat Oncol Biol Phys 2004; 58: 631–40
- Pönisch F, Parodi K, Hasch BG, Enghardt W. The modelling of positron emitter production and PET imaging during carbon ion therapy. Phys Med Biol 2004; 49: 5217–32
- Pönisch F, Enghardt W, Lauckner K. Attenuation and scatter correction for in-beam positron emission tomography monitoring of tumour irradiations with heavy ion beams. Phys Med Biol 2003; 48: 2419–36
- Crespo P. Optimization of in-beam positron emission tomography for monitoring heavy ion tumor therapy. Wiss-Tech Berichte FZR 2005;444.
- Crespo P, Shakirin G, Enghardt W. On the detector arrangement for in-beam PET for hadron therapy monitoring. Phys Med Biol 2006; 51: 2143–63
- Stenström, T. On the chemical fate of nascent 11C atoms induced by irradiation of water and aqueous solutions with 185 MeV protons. Ph.D. Thesis, Uppsala:1970.
- Tomitani T, Pawelke J, Kanazawa M, Yoshikawa K, Yoshida K, Sato M, et al. Washout studies of 11C in rabbit thigh muscle implanted by secondary beams of HIMAC. Phys Med Biol 2003; 48: 875–89
- Mizuno H, Tomitani T, Kanazawa M, Kitagawa A, Pawelke J, Iseki Y, et al. Washout measurement of radioisotope implanted by radioactive beams in the rabbit. Phys Med Biol 2003; 48: 2269–81
- Hinz R. Beiträge zur Einführung der Positronen-Emissions-Tomographie bei der Schwerionen-Tumortherapie. Wiss.-Tech. Berichte FZR 2000;286.
- Kausch C, Enghardt W. The evaluation of carbon ion therapy PET data within the time domain. GSI Annual Report 2002;176.
- Parodi K, Crespo P, Eickhoff H, Haberer T, Pawelke J, Schardt D, et al. Random coincidences during in-beam PET measurements at microbunched therapeutic ion beams. Nucl Instr Meth A 2005; 545: 446–58
- Crespo P, Barthel T, Frais-Kölbl H, Griesmayer E, Heidel K, Parodi K, et al. Suppression of random coincidences during in-beam PET measurements at ion beam radiotherapy facilities. IEEE Trans Nucl Sci 2005; 52: 980–7
- Lauckner K. Entwicklung eines 3D Rekonstruktionsverfahrens für die Kontrolle der Tumorbehandlung mit Schwerionen mittels der Positronen-Emissions-Tomographie. Wiss.-Tech. Berichte FZR-264:1999.
- Fiedler F, Crespo P, Sellesk M, Parodi K, Enghardt W. The feasibility of in-beam PET for therapeutic beams of 3He. IEEE Trans Nuc Sci 2006; 53: 2252–9
- Pawelke J, Enghardt W, Haberer T, Hasch BG, Hinz R, Krämer M, et al. In-beam PET imaging for the control of heavy-ion tumour therapy. IEEE Trans Nucl Sci 1997; 44: 1492–8
- Schulz-Ertner D, Nikoghosyan A, Thilmann C, Haberer T, Jäckel O, Karger C, et al. Carbon ion radiotherapy for chordomas and low-grade chondrosarcomas of the skull base. Strahlentherapie und Onkologie 1993; 9: 598–605
- Enghardt W, Parodi K, Crespo P, Fiedler F, Pawelke J, Pönisch F. Dose quantification from in-beam positron emission tomography. Radiother Oncol 2004; 73: 96–8
- Haberer T. Private communication. 2006.