Abstract
Hypofractionated conformal stereotactic radiotherapy (HCSRT) is an established method of treating brain lesions such as arteriovenous malformations (AVMs) and brain metastases. The aim of this study was to investigate the reliability of treatment plans in the terms of dose distribution and absorbed dose for HCSRT. Methods and materials. Treatment plans for three different clinical intracerebral targets, AVMs, were transferred to a CT study of a spherical water filled phantom simulating the human head and recalculated for the phantom geometry using a standard treatment planning system utilizing a pencil beam algorithm for dose calculation. The calculated absorbed dose, relative three dimensional (3D) dose distribution and dose conformity were investigated using gel dosimetry normalized to liquid ionization chamber (LIC) measurements. Results. The measured absorbed dose to the dose reference point was found to be within 2% of the calculated dose for all three targets. The measured dose distribution was found to be within 3% and 2 mm of the calculated dose for more than 93% of all points in the target volume for all three targets. Conclusions. The results show that the investigated standard treatment planning system can correctly predict the absorbed dose and dose distribution in different types of intracerebral targets and that the treatment can be delivered according to the plan.
Hypofractionated conformal stereotactic radiotherapy (HCSRT) is a method of delivering stereotactic irradiation in a few fractions using a relocatable stereotactic frame. This method is currently used for the treatment of brain metastases and arteriovenous malformations of the brain (AVMs) Citation[1]. AVMs are uncommon congenital lesions made up from clusters of abnormal arteries and veins that shunt blood from the arterial to the venous system. One treatment option for AVMs is single fraction stereotactic radiosurgery (SRS). However this treatment is mainly used for smaller AVMs as it has been considered difficult to treat AVMs larger than 10 cm3 safely and effectively with radiosurgery. For large AVMs, hypofractionated stereotactic radiotherapy may be more appropriate than SRS, allowing safe delivery of a higher total dose of radiation than what is possible with a single fraction Citation[1]. Brain metastases is a common manifestation of systemic cancer, and the incidence has been reported to range from 20–40% Citation[2]. The most common treatment has been whole brain radiotherapy (WBRT), but in recent years SRS in combination with WBRT Citation[3] or alone Citation[4] has been used widely with good results in terms of local control and survival. The omission of whole brain radiotherapy does not seem to compromise survival and local control Citation[5]. An alternative to SRS is HCSRT. The results of HCSRT in terms of local control and survival has been reported to be equivalent to those of SRS Citation[6]. Similarly to the case with AVMs, HCSRT may allow treatment of larger brain metastases than possible with SRS. In addition it has been suggested that fractionated stereotactic radiotherapy may provide a radiobiological advantage over SRS Citation[7].
At Umeå University Hospital, HCSRT has been used for the treatment of AVMs and single or oligo brain metastases since 1986. The results in terms of obliteration of AVMs and control of cerebral metastases have been evaluated and found to be comparable with SRS even though our lesions were larger than in most series with SRS Citation[1], Citation[8], Citation[9]. The schedule is based on 5 fractions each delivering 6 to 8 Gy depending on lesion and size. The fractions are given in 4 to 11 non-coplanar beams conformal to the lesion shape, which is similar to what has been applied by other centers Citation[10].
There have been questions regarding the accuracy of the dose distribution actually delivered to the patient in HCSRT. The doubt raised against HCSRT has been related both to the use of a re-locatable frame in a fractionated treatment regime as well as to the dosimetry related to the source of irradiation, i.e. the linear accelerator (linac). In a recent study the geometrical reproducibility of patient positioning using the relocatable frame technique has been thoroughly analyzed Citation[8] and the main focus of the present study will be to analyze the specific dosimetric issues related to stereotactic radiotherapy with linear accelerators.
Discrepancies between calculated and measured dose distributions have been reported for several commercial treatment planning systems especially in irregular beams and in regions outside the beam edges and in the beam penumbra Citation[11]. Furthermore dose calculation results for small beams are highly sensitive even to small changes in beam characteristics.
Dose measurements in small beams involve a number of difficulties Citation[12]. The sensitive volume of the detector must be small enough compared to the beam size to reduce dose volume averaging effects. Also the photon energy spectrum is different for small beams due to a smaller fraction of scattered photons at depth compared to larger beams. Most standard detectors for measuring absorbed dose, such as gas filled ion chambers and diodes have a relatively large sensitive volume that leads to poor spatial resolution or show energy and directional dependence Citation[13]. The liquid ionization chamber (LIC) was chosen for absorbed dose measurements because of its small effective volume, and therefore good geometrical resolution, energy independence and good sensitivity Citation[14].
For experimental verification of dose distributions in three dimensions (3D), polymer gel dosimetry was used Citation[15]. The main advantage with polymer gel dosimetry is that the measurement result is a true 3D representation of the dose distribution in the phantom. The gel is furthermore nearly water equivalent Citation[16], which makes dose calculation based on water filled phantoms valid and measured dose distributions energy independent. Together with the 3D properties, this makes the gel method useful in small beam and dynamic treatment dosimetry Citation[17], Citation[18]. The sensitivity of the gel and its dose linearity are other characteristics that make the gel method suitable for verification of treatment plans. However, when using standard gel calibration methods such as the multi flask and depth dose calibration method, large differences between calculated and measured dose, in terms of absolute dose, have been reported Citation[19]. A way to minimize dose calibration errors in gel dosimetry is to normalize the relative dose distribution from the gel to a point measurement of the absorbed dose in the phantom. If a linear dose response can be verified for the gel, the main contribution to the calibration uncertainty is related to the uncertainty in the point dose measurement, which is expected to be very small in comparison with the errors reported in the above studies. In this study, the relative dose distribution measured using polymer gel was normalized to a LIC measurement.
Since there has been an increased interest in HCSRT during the last years we found it to be of value to investigate the accuracy in the prescribed 3D target dose distribution for this modality of treatment. The aim of this study was thus to verify the delivered absorbed dose and relative 3D dose distribution in three different clinical intracerebral targets treated at our hospital. A new method for calibration of the relative polymer gel dose distribution using a LIC measurement was used.
Methods and materials
Targets
Targets from three patients with AVMs treated with HCSRT were selected (). These patients had been treated using our schedule of HCSRT with 6–7 Gy delivered in five fractions to a total dose of 30–35 Gy. Conformal beams were created using individual cast shielding blocks Citation[1]. The three AVMs were chosen to represent different subtypes of AVMs and the AVM volumes were 22.2, 6.2 and 1.7 cm3, respectively. The largest AVM (22.2 cm3) was in the upper range in volume previously treated with HCSRT at Umeå University Hospital. The medium sized AVM (6.2 cm3) was chosen due to the irregular shape of the AVM and a midsize volume. The 1.7 cm3 AVM was chosen to represent a small target. The largest and the smallest AVMs were regular in shape in contrast to the medium sized AVM. The planning target volume (PTV) for the large, irregular and small AVM were 30.8, 12.1, and 3.9 cm3, respectively.
Figure 1. AVM volumes from the left: 22.2 cm3 (large), 6.2 cm3 (irregular) and 1.7 cm3 (small). The reference cube has a volume of 1 cm3.
Phantom
The phantom used to mimic the human head was a spherical glass flask (Shott Duran, VWR International AB, Stockholm, Sweden) with a volume of 2.0 L and an outer diameter of 16.6 cm. The flask had a long bottleneck used to fixate the phantom to the stereotactic frame (Fixster, Elekta, Stockholm, Sweden) Citation[20]. A special device was manufactured to fixate the phantom in the stereotactic frame in a reproducible fashion (). Another device was manufactured to fixate the LIC within the phantom (). The entire phantom and LIC fixation device was made using acrylic plastic.
Figure 2. From left: gel filled phantom with the stereotactic frame in the treatment position on the accelerator. Phantom with LIC mounted. 3D reconstruction from the CT study of the phantom with the LIC.
Treatment planning
The treatment plans were based on CT scans of the phantom, for this purpose filled with water. Since the type of polymer gel used in this study is dosimetrically nearly water equivalent Citation[16], this is assumed to have no significant effect on the absorbed dose calculations. The water filled phantom mounted in the stereotactic frame together with the LIC mounted in the fixation device was scanned in the CT using the same settings and procedure as when scanning an ordinary AVM patient. Scans covering the entire spherical glass flask were acquired in 2.5 mm slices. The beams from the selected treatment plans were then copied onto the CT study of the phantom and the treatment plans were calculated using an in plane dose matrix resolution of 1 mm. The plan isocenter and dose reference point were placed in the center of the LICs active volume determined from the CT scan. The treatment planning system (TPS) used was TMS v. 6:1B (Nucletron B.V., Veenendaal, The Netherlands).
Treatment equipment
A Varian Clinac 2300 CD (Varian Medical systems, Palo Alto CA), normally used to perform HCSRT at the department was used. The linac was calibrated using the standard dosimetry protocol IAEA TRS 398 Citation[21] with an air filled ion chamber with a calibration factor traceable to the secondary standard dosimetry laboratory (SSDL) for absorbed dose in Sweden, The Swedish Radiation Protection Authority (SSI). The linac calibration, dose per monitor unit, was performed using the radiotherapy department's normal quality assurance (QA) routines.
Liquid Ionization Chamber measurements
The LIC measurements were performed using the same fixation device that was used for the CT scanning and with position adjustments from the treatment plan. The water filled phantom with the LIC was irradiated according to the treatment plan with a dose rate of approximately 3 Gy/min at the isocenter. The irradiation of the chamber was repeated three times for each beam to check the stability of the measurement equipment and the dose monitor chamber of the linac. To confirm the long-term stability of the LIC during the course of the measurements, regular constancy checks of the LIC were performed using a 60Co source.
The plane parallel LIC used (SICAB LIC-H(g)) Citation[22] had an active volume of 2.12 mm3 (3 mm diameter, thickness 0.3 mm) and was filled with a mix of 40% Isooctane and 60% Tetramethyl Silane. This LIC was designed for a polarizing voltage of 400 V.
The LIC was calibrated against a cylindrical air filled ion chamber, of type FC 65-G (Scanditronix Wellhöfer, Schwarzenbruck, Germany), in a beam of similar energy and dose rate to that of the treatment beams. The cylindrical chamber (FC 65-G) was calibrated at the SSDL in Sweden, SSI. The dose at the reference point was calculated according to the standard dosimetry protocol, IAEA TRS 398 Citation[21]. The calibration factor for the LIC was measured both with the LIC parallel and orthogonal to the beam direction.
Gel preparation and irradiation
The gel was manufactured using methacrylic acid (purity grade approx. 99%, Sigma Aldrich), gelatine (swine skin, 300 Bloom, Sigma Aldrich), tetrakis(hydroxymethyl)phosphonium chloride (THP, techn. ∼80% in water, Sigma Aldrich) and ultra pure deionized water (resistivity >18.2 MΩcm) (). The mixing procedure has been described elsewhere Citation[23]. Since the gel preparation incorporates THP, the dose response of the gel used in this study is not negatively affected by oxygen exposure during manufacturing Citation[23]. The gel was consequently mixed in room atmosphere, at normal levels of oxygen.
Table I. Gel composition.
Two sets of gel were prepared. For the first set a single volume of 5000 ml of gel was manufactured. Two 2500 ml batches of gel were mixed in the second set. Both sets of gel were poured into two identical spherical glass flasks as described above. Screw-top glass vials for dose response evaluation (diameter 1.5 cm, length 6.0 cm) and test tubes (diameter 1.6 cm, length 13.0 cm) for depth dose measurements were also prepared. The gel preparation was carried out at Malmö University Hospital.
The gel filled phantoms mounted in the stereotactic frame were irradiated in one single session each to a total dose of 2 Gy in the isocenter according to the treatment plans. The total dose of 2 Gy was chosen in order to minimize possible dose rate effects or overshoots in the beam penumbra Citation[16]. The positioning of the phantom using the frame was done according to the patient positioning procedure.
The gel filled screw-top glass vials and the test tubes, used for dose response and depth dose evaluation, respectively, were irradiated in water.
MR scanning, image and data processing
Magnetic resonance imaging (MRI) was undertaken at the Malmö University Hospital, using a Siemens Sonata 1.5 T scanner (Siemens Medical Solutions, Erlangen, Germany). The time between irradiation and scanning was at least 20 h. The gels were scanned using a 32-echo multiple spin echo sequence, with repetition time 4000 ms (first set, large AVM), 5320 ms (second set, irregular AVM and small AVM), inter echo time 10.6 ms, and pixel size 1.0×1.0 mm2. A slice thickness of 2.5 mm was chosen in order to match the calculated data.
All image and data processing was undertaken using an in-house written software routine run under IDL (Interactive Data Language, Research Systems Inc., Boulder, CO, USA). The T2 value of each pixel was derived by fitting of a monoexponential decay to the MR signal values at each echo time using a two point fit and the Levenberg-Marquardt optimisation algorithm Citation[24].
The outer contours of the phantoms were used to match the TPS and MRI images in-plane. Vitamin E capsules were used as fiducial markers to identify the isocenter plane and the phantom rotation around the cranial-caudal axis.
Background subtraction was carried out using R2 (1/T2) values from unirradiated parts of the phantom. For each of the three phantoms, the mean values of several unirradiated regions were used. Normalization of the measured dose distributions to the LIC measurements was performed in the isocenter for each target. The corresponding isocenter point in the gel was determined from the isocenter coordinates from the treatment plan. The normalization dose levels in the gel were based on the mean dose value in a volume of 25 mm3 (10 voxels) around the isocenter point.
Sagittal, coronal and transversal dose profiles were extracted through the isocenter of the measured and calculated dose maps. A quantitative comparison of measured and calculated data was obtained using the gamma technique Citation[25], with the in plane criteria 3%/1 mm and 3%/2 mm. A unique feature of gel dosimetry is the possibility for true three dimensional evaluation using dose volume histograms (DVH), commonly used to examine the dose coverage and dose homogeneity of targets and organs at risk when evaluating and comparing treatment plans. DVHs were calculated for all three targets.
Results
Point measurements
The uncertainty of the LIC calibration is based on uncertainty estimation for the calibration method from TRS 398 Citation[21]. TRS 398 Citation[21] states that the total relative standard uncertainty for absorbed dose in the reference point using a SSDL calibrated reference chamber is 1.5% and that the cross calibration procedure increases the uncertainty by another 0.2%. The uncertainty of the measurements of the absorbed dose to the isocenter due to LIC positioning within the phantom, phantom positioning and measurement equipment was estimated to 1%. The resulting combined calibration factor and measurement uncertainty for the absorbed dose measurements using the LIC amounts to 2%. The standard uncertainty of the repeated LIC calibration and absorbed dose measurements were found to be negligible compared to the estimated uncertainties.
The results of the absorbed dose measurements in the isocenter point of the three different AVMs, using the LIC, are presented in . The measured doses were 1.4%, 0.2% and 0.1% higher than the calculated target dose in the isocenter for the large, irregular and small target, respectively. The calculated dose was based on the relative dose contribution, output factor and actual monitor units delivered for each beam. All of the calculated results for the total target dose were within the 2% uncertainty of the LIC measurement.
Table II. Comparison of calculated and LIC measured dose to isocenter for the three targets.
3D gel dosimetry
An approximately linear R2-dose response was obtained for all absorbed doses in the investigated interval (). Good agreement with reference depth dose data was also confirmed. The use of the gel for relative dosimetry was thus validated. Three sources contribute to the uncertainty in the calibration. The first one is the uncertainty in the LIC measurement, which was estimated to 2% (see above). Furthermore, the difficulty to determine a correct value for background subtraction will introduce uncertainty, as has been discussed by Gustavsson et al. Citation[15]. The maximum uncertainty from this source was estimated to approximately 3% in the low dose region, and less at the target dose level. Thirdly, there is an uncertainty in the assumption of a linear dose response. For the dose response curve in , the p-value for the test of the null hypothesis that the slope of the curve equals zero was <0.0001, and the r2 value was 0.997. This contribution was thus considered to be negligible. The combined uncertainty, assuming the contributing terms were uncorrelated, was 3.6% calculated according to ISO 1995 (ISO 1995, Guide to the expression of uncertainty in measurement, ISO, Geneva). This number should be compared to the reported errors of up to 18% when using standard gel calibration methods such as the multi flask or depth dose calibration method Citation[19].
Figure 3. Dose response evaluated by means of R2 as a function of absorbed dose for the batch of gel that was used for the large target. The uncertainty bars correspond to 1 SD in the R2 map. Note that for most data points the uncertainty bars are smaller than the symbols and therefore not visible.
The results from the normoxic polymer gel measurements compared to the dose matrix from the treatment planning system are presented in three different types of plots (). The dose profiles () were obtained through the isocenter along three orthogonal directions: X is the lateral direction, Y is the anterior-posterior direction and Z is the cranial-caudal direction. The dose profiles passes through the isocenter for all three targets. From the profiles it is evident that calculated and measured dose in the dose fall off regions outside the PTV agree well, i.e. that the treatment planning system calculates the dose in the steep dose gradient regions near the PTV correctly. In the peripheral regions there is a larger difference between the two data sets. The discrepancy is most pronounced in regions were the dose profile goes through the dose maximum of one of the treatment beams, for example around Y = − 60 mm in the anterior-posterior dose profile for the small target.
Figure 4. Dose profiles through the isocenter for the three investigated AVMs (—TMS-calculated, • measured). The X-axis shows the lateral, Y the anterior-posterior and Z the cranial-caudal direction. The gray vertical lines in each plot mark the extension of the planning target volume (PTV). Zero is the isocenter position on each plot.
Figure 5. γ-index in the three AVMs. From left to right: 1.5 cm superior to the isocenter, through the isocenter and 1.5 cm inferior to the isocenter. For the small AVM 1.0 cm superior and 1.0 cm inferior, respectively. The upper and lower plot for each AVM allows dose difference of 3%, distance to agreement 1 mm for the upper plot and 2 mm for the lower plot. Target outline in black.
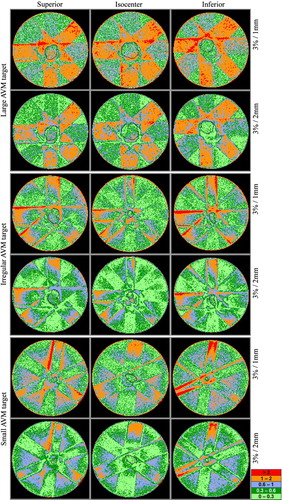
Figure 6. Dose volume histograms. Measured mean doses for the large, irregular and small AVM: 101.0%±5.2% (1 SD), 102.2%±4.3% (1 SD) and 99.3%±2.6% (1 SD), respectively. Calculated mean doses: 99.4%±3.0% (1 SD), 99.8%±3.5% (1 SD) and 99.7%±2.4% (1 SD), respectively.
The γ-plots, visualizing the difference between calculated and measured dose, are based on a selection of slices from the CT study that formed the basis for the treatment plans (). The set of slices, for each target, consists of one slice superior to the isocenter, one slice inferior to the isocenter and the slice through the isocenter. The distance from the isocenter slice to the superior and inferior slices is 1.0 or 1.5 cm depending on the target size. There are two γ-plots for each slice: one with the criteria 3%/1 mm and one with 3%/2 mm. Within the PTV, 95.6% of the volume fulfills the 3%/2 mm criterion for the large target. For the irregular and small targets the corresponding numbers are 93.3% and 99.9%, respectively. For all tree targets, in the low dose regions within the beams and in regions outside the beams, only a small number of scattered points do not fulfill the criteria (). However, there is a discrepancy between measured and calculated dose in the penumbra region and in the dose maximum region of all beams, near the phantom surface. The latter is also visualized in the dose profiles ().
The DVHs () are three-dimensional comparisons of the calculated and measured dose distribution in each PTV. The measured and calculated mean doses in the PTVs were 101.0%±5.2% (1 SD) and 99.4%±3.0% (1 SD), respectively, for the large target, 102.2%±4.3% (1 SD) and 99.8%±3.5% (1 SD) for the irregular target and 99.3%±2.6% (1 SD) and 99.7%±2.4% (1 SD) for the small target. The calculated mean dose is within ±1 SD of the measured mean dose for all three PTVs.
Discussion
Using LIC measurements and 3D gel dosimetry we have shown that our treatment planning system can adequately predict the absorbed dose and the dose distribution in small and large targets, and in targets with irregular volume. Furthermore, the treatment can be delivered according to the treatment plan using the linac and the fixation system. There has previously been concern regarding the dose distribution using HCSRT, whereas this has been well characterized in SRS Citation[17], Citation[18]. Using HCSRT we have previously been able to irradiate targets that have been considered too large to be treated safely with SRS. Fractionation enables delivery of a higher total dose than possible in a single fraction. This is important when targets are large or located in eloquent areas, enabling an effective treatment without increasing the risk of radio necrosis Citation[1], Citation[9]. There was a high consistency between the dose distributions, calculated by the treatment planning system, LIC measurements and 3D gel dosimetry both in the PTV and in dose fall off regions.
The dose distribution in gamma knife radiosurgery has been investigated in several studies using gel dosimetry Citation[17], Citation[18] and the concordance between calculated and measured dose distributions was found to be satisfactory. In these cases the measured dose distribution has been compared to dose distributions calculated using dedicated radiosurgery treatment planning systems, and the set-up technique for phantom irradiation has been that normally used for gamma knife stereotactic radiosurgery.
One of the major concerns regarding HCSRT has been the reproducibility of the patient positioning using the relocatable fixation frame. Using the Fixster stereotactic frame, the patient position in relation to the frame is secured through an individually cast thermoplastic bite block and a cast of the root of the patients nose. The spherical glass phantom, used in this investigation to simulate the human head, was considered adequate for dosimetric purposes and for verification of the linacs geometrical accuracy. However, it was not considered suitable for a realistic test of the fixation systems reproducibility because of the obvious differences between the phantom and the anatomy of the human head. Methods for patient positioning verification together with dose distribution measurements for dedicated SRS systems have been developed and tested Citation[17], Citation[18], these methods are not directly applicable for verifying a non-invasive fixation system like the Fixster when it comes to simulating patient positioning at the treatment equipment using a rigid phantom. The Fixster head fixation system, first described by Greitz et al., is not thoroughly evaluated in terms of reproducibility, but in the original paper it was reported to have a maximum deviation of 2–3 mm when testing the reproducibility of the frame Citation[20].
The dose profiles show good agreement between measured and calculated dose both for dose fall off regions and within the target area. The dose differences that can be seen in regions outside the target areas are mainly in the dose maximum regions for beams parallel or near parallel to the dose profile. This phenomenon can also be seen in the γ-plots where the γ-index is higher than unity for the regions close to dose maximum for each individual beam. Part of this discrepancy can be attributed to limitations in the pencil beam dose calculation algorithm Citation[26]. Deviations between TPS calculations and measured data have been reported at shallow depths Citation[27], which can partly explain the discrepancies around the dose maximum of the individual beams. Furthermore, TPS data has been modeled using accelerator and energy specific input data measured at larger field sizes than normally used for HCSRT. In addition, parts of this input data , the relative dose distributions, have been measured using diodes that has known limitations regarding energy independence Citation[13]. The modeling and subsequent verification of calculated dose distribution during TPS commissioning was performed at beam sizes ranging from 5×5 cm2 to 40×40 cm2. Also, to some extent, the dose calculation algorithm does not correctly model the dose deposition close to the glass phantom wall due to the difference in electron density between the gel and the 2–3 mm thick glass wall. Preliminary findings also indicate that the gel dose response is dependent on fractionation of the irradiation Citation[28], which can lead to an overestimation of the dose in regions where the dose is a summation of many small contributions. This effect together with the normalization of the gel measurements in the isocenter, where all beams contribute, can lead to an underestimation of the measured dose in the peripheral regions of the phantom where only one or a few beams contribute. However, the deviations in the target region are considerably reduced if a relative calibration is performed, which was done in this study. Furthermore, an incorrect background value used for gel normalization can cause deviations both in high and low dose regions, as discussed by Gustavsson et al. Citation[15].
Using the 3%/2 mm criterion the γ-value within the PTV is below unity for more than 93% of the volume elements, for all three targets. Since the volume elements within the PTV that do not fulfill the criterion are scattered throughout the volume for each target, it indicates that measurement noise is the main reason for the discrepancy. In the dose fall of region outside the PTV, the calculated and measured dose agrees well with the exception of the penumbra regions, especially when two or more beams overlap. For small beams the penumbra region is not accurately modeled using pencil beam algorithms Citation[27], which can explain these discrepancies. It should also be noted that the stated values were obtained using stricter criteria (3%/2 mm) than used in many publications Citation[29] and recommendations Citation[30]. If the frequently used criteria 3%/3 mm had been used in this study, nearly all points would have passed the γ-test. The penumbra regions are the areas where the stricter criterion is most likely to affect the pass-rate, which is observed in our data.
The result from the comparison of calculated and measured DVHs showed an almost perfect agreement for the small target, and the measured mean dose lies within the standard deviation of the calculated mean dose for all three targets. The gel measurements for the large and irregular targets are slightly noisier than for the small target, which is evident in the profiles (). This can also be observed as a larger standard deviation around the mean dose for the measured dose distribution than for the calculated dose distribution in the target region for these two targets. The gel measurements were normalized to the LIC measurements, and thus the dose to the isocenter is slightly higher than corresponding calculated values for all three targets (see ). For the large target, the difference was 1.4%, which leads to a shift of the DVH curve, with a higher mean value for the measured dose compared to calculated dose (). The above lead to a slightly broader dose distribution with a higher mean value for measured dose compared to calculated dose.
However, the main deviation for the large and irregular targets is that the measured volume, that received a higher dose than the target dose, is larger than corresponding calculated volume. For these targets, a peak in the measured values is observed in the dose profiles in the anterior-posterior (Y) and cranio-caudal (Z) directions (). These regions correspond to regions in the gamma plots where the penumbras of several beams coincide (). As discussed above, erroneous calculations in the penumbra regions could lead to large disagreements, especially when a number of beams are superimposed. This deviation will manifest as a high dose tail in the DVH.
Conclusions
The results from the measurements of absorbed dose suggests that the standard treatment planning system used can correctly calculate the dose to the isocenter from the small beam sizes used to treat targets of this type. In addition, the gel measurements also show that the dose distribution in and around the target could be calculated to within 3%/2 mm for more than 93% of the points for all targets. Furthermore, the treatment plan could be delivered with a good geometrical accuracy. The absorbed dose and the dose distribution in the treatment of AVMs and metastases using the technique of HCSRT could be adequately predicted.
Acknowledgements
The authors would like to thank Drs. Per Bergström and Per-Olov Löfroth for their assistance with target definition, treatment planning and phantom set-up.
In conjunction with generation of this article we have received financial support from Lion's Cancer Research Foundation, Umeå University, the Swedish Cancer Society (4726-B04-03XAC), the Cancer Foundation of Malmö University Hospital and the Department of Research and Development, Västernorrlands County Council.
References
- Lindvall P, Bergstrom P, Lofroth PO, Hariz MI, Henriksson R, Jonasson P, et al. Hypofractionated conformal stereotactic radiotherapy for arteriovenous malformations. Neurosurgery 2003;53:1036–42; Discussion 1042–3.
- Nussbaum ES, Djalilian HR, Cho KH, Hall WA. Brain metastases. Histology, multiplicity, surgery, and survival. Cancer 1996; 78: 1781–8
- Sneed PK, Suh JH, Goetsch SJ, Sanghavi SN, Chappell R, Buatti JM, et al. A multi-institutional review of radiosurgery alone vs. radiosurgery with whole brain radiotherapy as the initial management of brain metastases. Int J Radiat Oncol Biol Phys 2002; 53: 519–26
- Shirato H, Takamura A, Tomita M, Suzuki K, Nishioka T, Isu T, et al. Stereotactic irradiation without whole-brain irradiation for single brain metastasis. Int J Radiat Oncol Biol Phys 1997; 37: 385–91
- Sneed PK, Lamborn KR, Forstner JM, McDermott MW, Chang S, Park E, et al. Radiosurgery for brain metastases: Is whole brain radiotherapy necessary?. Int J Radiat Oncol Biol Phys 1999; 43: 549–58
- Aoyama H, Shirato H, Onimaru R, Kagei K, Ikeda J, Ishii N, et al. Hypofractionated stereotactic radiotherapy alone without whole-brain irradiation for patients with solitary and oligo brain metastasis using noninvasive fixation of the skull. Int J Radiat Oncol Biol Phys 2003; 56: 793–800
- Hall EJ, Brenner DJ. The radiobiology of radiosurgery: Rationale for different treatment regimes for AVMs and malignancies. Int J Radiat Oncol Biol Phys 1993; 25: 381–5
- Lindvall P. Hypofractionated conformal stereotactic radiotherapy in the treatment of AVMs and cerebral metastases. Department of Pharmacology and Clinical Neuroscience, Neurosugery and Department of Radiation Sciences Umeå University, Sweden 2006 M.D. Thesis.
- Lindvall P, Bergstrom P, Lofroth PO, Henriksson R, Bergenheim AT. Hypofractionated conformal stereotactic radiotherapy alone or in combination with whole-brain radiotherapy in patients with cerebral metastases. Int J Radiat Oncol Biol Phys 2005; 61: 1460–6
- >Veznedaroglu E, Andrews DW, Benitez RP, Downes MB, Werner-Wasik M, Rosenstock J, et al. Fractionated stereotactic radiotherapy for the treatment of large arteriovenous malformations with or without previous partial embolization. Neurosurgery 2004;55:519–30; Discussion 530–1.
- Venselaar J, Welleweerd H. Application of a test package in an intercomparison of the photon dose calculation performance of treatment planning systems used in a clinical setting. Radiother Oncol 2001; 60: 203–13
- Heydarian M, Hoban PW, Beddoe AH. A comparison of dosimetry techniques in stereotactic radiosurgery. Phys Med Biol 1996; 41: 93–110
- Westermark M, Arndt J, Nilsson B, Brahme A. Comparative dosimetry in narrow high-energy photon beams. Phys Med Biol 2000; 45: 685–702
- Wickman G, Nystrom H. The use of liquids in ionization chambers for high precision radiotherapy dosimetry. Phys Med Biol 1992; 37: 1789–812
- Gustavsson H, Karlsson A, Back SA, Olsson LE, Haraldsson P, Engstrom P, et al. MAGIC-type polymer gel for three-dimensional dosimetry: Intensity-modulated radiation therapy verification. Med Phys 2003; 30: 1264–71
- De Deene Y, Vergote K, Claeys C, De Wagter C. The fundamental radiation properties of normoxic polymer gel dosimeters: A comparison between a methacrylic acid based gel and acrylamide based gels. Phys Med Biol 2006; 51: 653–73
- Novotny J, Dvorak P, Spevacek V, Tintera J, Novotny J, Cechak T, et al. Quality control of the stereotactic radiosurgery procedure with the polymer-gel dosimetry. Radiother Oncol 2002; 63: 223–30
- Watanabe Y, Akimitsu T, Hirokawa Y, Mooij RB, Perera GM. Evaluation of dose delivery accuracy of Gamma Knife by polymer gel dosimetry. J Appl Clin Med Phys 2005; 6: 133–42
- Cosgrove VP, Murphy PS, McJury M, Adams EJ, Warrington AP, Leach MO, et al. The reproducibility of polyacrylamide gel dosimetry applied to stereotactic conformal radiotherapy. Phys Med Biol 2000; 45: 1195–210
- Greitz T, Bergstrom M, Boethius J, Kingsley D, Ribbe T. Head fixation system for integration of radiodiagnostic and therapeutic procedures. Neuroradiology 1980; 19: 1–6
- Andreo P, Burns DT, Hohlfeld K, Huq MS, Kanai T, Laitano F, et al. Absorbed dose determination in external beam radiotherapy: An international code of practice for dosimetry based on standards of absorbed dose to water. Technical Report Series (TRS 398). Vienna: International Atomic Energy Agency; 2000.
- Johansson B, Wickman G, Bahar-Gogani J. General collection efficiency for liquid isooctane and tetramethylsilane in pulsed radiation. Phys Med Biol 1997; 42: 1929–38
- Gustavsson H. Radiotherapy gel dosimetry; development and application of normoxic polymer gels. Lund University, Malmö 2004 PhD Thesis.
- Press WH, Flannery P, Teukolsky SA, Vetterling WT. Numerical recipes: The art of scientific computing (FORTRAN version). Cambridge University Press, Cambridge 1989
- Low DA, Harms WB, Mutic S, Purdy JA. A technique for the quantitative evaluation of dose distributions. Med Phys 1998; 25: 656–61
- Ahnesjo A, Aspradakis MM. Dose calculations for external photon beams in radiotherapy. Phys Med Biol 1999; 44: R99–R155
- Sohn JW, Dempsey JF, Suh TS, Low DA. Analysis of various beamlet sizes for IMRT with 6 MV photons. Med Phys 2003; 30: 2432–9
- Karlsson A, Gustavsson H, Månsson S, Bäck SÅJ. Sequential beam integration characteristics of a methacrylic acid based normoxic polymer gel dosimeter. 4th International Conference on Radiotherapy Gel Dosimetry Quebec, Canada, 2006.
- Low DA, Dempsey JF, Venkatesan R, Mutic S, Markman J, Mark Haacke E, et al. Evaluation of polymer gels and MRI as a 3-D dosimeter for intensity-modulated radiation therapy. Med Phys 1999; 26: 1542–51
- Venselaar J, Welleweerd H, Mijnheer B. Tolerances for the accuracy of photon beam dose calculations of treatment planning systems. Radiother Oncol 2001; 60: 191–201