Abstract
Purpose. Cancer-related cachexia is an obscure syndrome leading to muscle wasting, reduced physical fitness and quality of life. The aim of this study was to assess morphology, metabolism, and microcirculation in skeletal muscles of patients with cancer-related cachexia and to compare these data with matched healthy volunteers. Methods. In 19 patients with cancer-induced cachexia and 19 age-, gender-, and body-height-matched healthy volunteers body composition and aerobic capacity (VO2max) were analyzed. Skeletal muscle fiber size and capillarization were evaluated in biopsies of the vastus lateralis muscle. The cross-sectional area (CSA) of the quadriceps femoris muscle was measured by magnetic resonance imaging as well as its isokinetic and isometric force. The energy and lipid metabolism of the vastus lateralis muscle was quantified by 31P and 1H spectroscopy and parameters of its microcirculation by contrast-enhanced ultrasonography (CEUS). Results. Morphologic parameters were about 30% lower in cachexia than in volunteers (body mass index: 20±3 vs. 27±4 kg m−2, CSA: 45±13 vs. 67±14 cm2, total fiber size: 2854±1112 vs. 4181±1461 µm2). VO2max was reduced in cachexia (23±9 vs. 32±7 ml min−1 kg−1, p=0.03), whereas histologically determined capillary density and microcirculation in vivo were not different. Both concentrations of muscular energy metabolites, pH, and trimethyl-ammonium-containing compounds were comparable in both groups. Absolute strength of quadriceps muscle was reduced in cachexia (isometric: 107±40 vs. 160±40 Nm, isokinetic: 101±46 vs. 167±50 Nm; p=0.03), but identical when normalized on CSA (isometric: 2.4±0.5 vs. 2.4±0.4 Nm cm−2, isokinetic: 2.2±0.4 vs. 2.5±0.5 Nm cm−2). Conclusions. Cancer-related cachexia is associated with a loss of muscle volume but not of functionality, which can be a rationale for muscle training.
Cachexia is a life-threatening syndrome of progressive weight loss, which is associated with cancer, cardiorespiratory and inflammatory diseases. Cachexia is encountered in up to 50% of cancer patients and may account for more than 20% of cancer-related deaths Citation[1], Citation[2]. The key manifestations of cachexia are wasting of fat and muscle mass. These are only incompletely explained by accompanying factors such as malnutrition, anemia, psychosocial stress, fatigue, and factors that may be related to chemotherapy. Especially, the loss of muscle mass and function limits daily physical activity, independency and quality of life and thus may also negatively affect compliance to and outcome of specific cancer treatment, such as chemotherapy Citation[3], Citation[4].
Modern imaging enables the assessment of several aspects of muscle (patho-) physiology. Besides the sole assessment of morphology by magnetic resonance imaging (MRI), MR spectroscopy (MRS) provides information on the chemical composition of the tissue non-invasively and allows for, depending on the observed nucleus, quantification of several metabolites of the (intramyocellular) lipid (proton(1H) MRS) Citation[5] and high-energy phosphate pool (phosphorous(31P) MRS) Citation[6]. Changes in myocellular high-energy phosphate metabolism are encountered in diseases leading to muscular degeneration Citation[7]. Intracellular pH, as well as the MR signal intensity ratios Pi/PCr (inorganic phosphate (Pi) to phosphocreatine (PCr)), and PDE/PCr (phosphodiester (PDE) to PCr), have been reported to increase depending on the stage and severity of the muscle degeneration. 1H MR spectra of skeletal muscles provide information on intramyocellular lipids (IMCL) which are stored within the myoplasm in close contact with mitochondria Citation[8]. It has been shown that IMCL levels vary with diet and physical activity and it has been reported that IMCL levels are correlated with insulin sensitivity Citation[5]. Furthermore, skeletal muscle microcirculation can be quantified by contrast-enhanced ultrasonography (CEUS) analyzing replenishment kinetics after destruction of intravenously injected microbubbles by ultrasonographic pulses Citation[9], Citation[10]. This technique is sensitive enough to allow for detection of the low skeletal muscle perfusion, i.e. the capillary blood flow, at rest Citation[11]. It also allows for quantification of physiologically increased perfusion after exercise Citation[9] and pathologically increased perfusion in inflammatory myopathies Citation[10].
The aim of the present explorative study was to assess morphology, metabolism, and microcirculation in skeletal muscles of patients with cancer-related cachexia in vivo by MRI, MRS and CEUS, as well as ex vivo in biopsies from the same muscles and to compare these data with those of matched healthy volunteers. We also investigated muscle functionality by testing the isometric and isokinetic strength of the quadriceps muscle as well as aerobic capacity (VO2max) as a parameter of endurance performance.
Patients and methods
Study population
Nineteen mobile patients (9 female, 10 male; age, 58±9 years; height, 171±10 cm; weight, 58±11 kg) with diagnosis of gastrointestinal cancer and cancer-related cachexia defined as a progressive weight loss of >10% in 6 months were included in this study. For comparison, 19 healthy age-, gender- and height-adapted volunteers were included in the study (9 female, 10 male; age, 56±7 years; height, 174±10 cm; weight, 80±17 kg). All subjects underwent an initial clinical examination for exclusion criteria that comprised routine laboratory parameters in venous blood samples, blood pressure measurement in sitting position, and electrocardiogram at rest. None of the 38 subjects had absolute or relative contraindications of the ultrasound contrast agent Levovist® (SH U 508A; Schering; Berlin, Germany), such as galactosaemia, severe heart failure, severe pulmonary disease, pregnancy, or myocardial infarction within the preceding two weeks. None of the subjects had other exclusion criteria for this study, such as any diagnosed cardiovascular, metabolic, respiratory, renal, hepatic, neurological, psychiatric or inflammatory disease, cancer (type of cancer other than the aforementioned type admitted to the group of cachectic patients), or orthopedic problems of the lower extremity or spine that would limit daily mobility and activity. Informed written and oral consent was obtained from all subjects after the nature of the procedure had been fully explained to them. The study was approved by the local review board and performed according to the declaration of Helsinki. All subsequent listed measurements were performed within one week after inclusion.
Body composition
Body composition was analyzed by measurement of electrical impedance and reactance under highly standardized conditions (regarding body position, electrode localization, overnight fast) using the TVI-10 body composition analyzer purchased from FM Service GmbH (Leverkusen, Germany) in combination with the BIA-Star program by RECAL Biomed Co. (Heidelberg, Germany) for calculation of absolute and percentage values of body fat (total fat), fat-free mass (FFM) and total body water (TBW), as well as body cell mass (BCM) and body mass index (BMI) based on body height and actually measured body weight. The theoretical basis of this method has been described elsewhere Citation[12].
Maximal oxygen uptake (VO2max)
The endurance work capacity is best determined by the aerobic capacity i.e. the maximal oxygen uptake (VO2max). The maximal oxygen (O2) uptake represents the cardiorespiratory capacity of O2-transport together with capacity of the working (locomotor) muscle to consume O2. Besides the muscle mass itself, factors like blood O2 binding capacity, cardiac output, muscle capillarization, fiber composition or mitochondrial density have been identified to conditionally limit VO2max itself in health or disease Citation[13], Citation[14]. VO2max was determined breath-by-breath by the spirometric system ZAN680 (ZAN Ferraris Cardiorespiratory; Oberthulba, Germany) uptake during an incremental exercise test on a cycle ergometer type Ergoline 100 (Ergoline; Windhagen, Germany). Work load was increased from a starting level of 50 watt (W) in steps of 25 W every two minutes until exhaustion. VO2max was calculated as the maximum of mean values covering every 10 s.
Venous blood analysis
Blood samples were drawn from an antecubital vein after an overnight fast and immediately centrifuged at 2 000 rpm for 10 min (4°C) to obtain serum or EDTA-plasma, which were stored at −75°C for further analysis. The plasma concentrations of tumor necrosis factor-alpha (TNF-α or cachexin), a cytokine causing cachexia in laboratory animals Citation[15], Citation[16], were measured by a solid-phase enzyme-amplified immunosorbent assay performed on microtiter plates (TNF-α-EASIA, BioSource® Europe, Nivelles, Belgium) according to manufacturer's instructions. This assay uses monoclonal antibodies (MAbs) directed against distinct epitopes of TNF-α and allows to perform a sandwich of MAb1 (coated on the plate), TNF-α, MAb2, and horseradish peroxidase. The bound enzyme-labeled antibody is measured through a chromogenic reaction and then read at the appropriate wavelength of 450 nm and 490 nm (reference at 620 nm). All plasma samples were measured twice and the concentrations were calculated as means of both measurements.
Magnetic resonance imaging
MRI of both thighs was performed in the supine position on a 1.5-Tesla clinical MR system (MAGNETOM Vision Plus; Siemens Medical Solutions, Erlangen, Germany) using a standard phased-array coil for signal reception. The imaging protocol comprised an axial and coronal T1-weighted spin echo sequence (repetition time (TR)/echo time (TE) in ms, 500/15 and 570/17, respectively), an axial (4000/60; inversion time (TI) in ms, 150) and coronal (6194/60; TI, 150) T2-weighted fat-suppressed short-τ inversion-recovery sequence, and a T1-weighted turbo spin echo sequence (520/15) with selective fat suppression. Muscle cross-sectional area (CSA) of the right quadriceps femoris muscle were determined at 12, 20 and 28 cm distances from the trochanter major on T1-weighted images (A). Image analysis was performed by an independent reader, blinded to clinical data. All MR images were displayed on our picture archiving and communication system (PACS), which enabled a precise and reproducible measurement of muscle CSA. All MR examinations were jointly randomized and identifying parameters such as patient's name were removed. The mean of the three CSA values obtained at 12, 20 and 28 cm distance from the trochanter major was used for statistical analysis. Muscle CSA of the whole quadriceps femoris muscles was determined, because especially in the proximal and distal axial MRI scans, the fascial boundaries between the lateral and deep vastus muscles were often indiscernible, as described before Citation[17]. A muscle edema was defined as an area of localized hyperintensity on T2-weighted images. The reader was asked to assess whether a muscle edema could be identified or not. Moreover, lipomatous degeneration of the quadriceps muscle was quantified by the ratio of signal intensity of muscle and subcutanous fat tissue using a region-of-interest (ROI) analysis according to Citation[18]. ROIs were placed on T1-weighted images (B) of the same sections used for CSA analysis. Attention was paid by the reader to avoid ROI placement in those regions of the thighs affected by signal inhomogeneities. The mean of the ratios of signal intensity of muscle and subcutanous fat tissue obtained at 12, 20 and 28 cm distance from the trochanter major was used for statistical analysis.
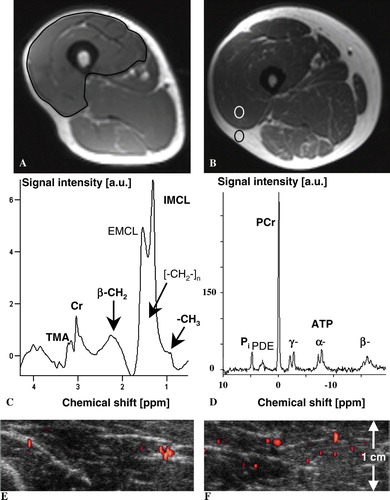
Figure 1. Magnetic resonance T1-weighted imaging of the right thigh in a 54-year old man with cachexia due to pancreatic cancer (weight 58 kg) (A) and the corresponding right thigh at the same level of the matched healthy volunteer (55 years, weight 107 kg) (B). In A), determination of muscle cross-sectional area (CSA) of the right quadriceps femoris is illustrated (CSA in patient with cachexia vs. volunteer, 51.3 vs. 85.9 cm2). In B), the quantification of the ratio of signal intensities of muscle and subcutaneous fat tissue using a region-of-interest analysis is illustrated. The corresponding 1H MR spectrum (C) from the right vastus lateralis muscle and the 31P MR spectrum of the same region (D) of the patient with cachexia illustrate the metabolites that were quantified. Peak assignments in C): Cr, (phospho-)creatine; TMA peak, trimethyl-ammonium-containing compounds among which is choline; IMCL, intramyocellular lipids; EMCL, extramyocellular lipids. Peak assignments in D): Phosphocreatine (PCr), inorganic phosphate (Pi), phosphodiester (PDE), and the three resonances (α, β, γ) of adenosine 5′-triphosphate (ATP); intensity ratio β-ATP/PCr in patient with cachexia vs. volunteer, 0.27 vs. 0.27. Only the signals printed in bold in C) and D) were quantified. The corresponding transverse power Doppler images after bolus injection of 10 ml Levovist® in 1.5 cm depth (focus area) show the initial increase (E) and maximum plateau (F) of microbubbles’ replenishment within the right vastus lateralis muscle of the patient with cachexia. Microcirculation and concentration of lipid and energy metabolites in vivo were comparable in muscles of volunteers and cachectic patients at rest.
Magnetic resonance spectroscopy
1H and 31P MRS of the right vastus lateralis muscle were performed on the same MR system used for MRI. 1H MRS was performed by spin excitation using the body resonator and signal reception using the flexible extremity coil. Application of the STEAM technique Citation[19] yielded localized 1H MR spectra from vastus lateralis muscle (measurement parameters: TR = 1.5 s, TE = 10 ms, middle interval (TM) = 15 ms, number of excitations (NEX) = 400). The voxel size (maximum, 2×2×2 cm3) was adjusted according to the thickness of the muscle. B0-homogeneity corresponded to a linewidth (FWHM) of about 20 Hz of the water resonance from the voxel. The pulse sequence employed a frequency-selective 90° pulse (25.6 ms, Gaussian shape) and spoiler gradients for water signal suppression. The unsuppressed water signal (NEX=10) was used to normalize metabolite 1H signal intensities. For proton-decoupled 31P MRS studies, a double-loop surface coil system (10 and 5 cm in diameter) for 1H and 31P excitation and detection was employed. Shim on the water resonance of the sensitive volume of the 1H coil yielded a linewidth of 30–40 Hz. The 31P signal was acquired with NEX=400 of a one-pulse sequence with a rectangular excitation pulse optimized for maximum signal with TR = 1.5 s (pulse amplitude 5–7 V) and subsequent readout of the free induction decay (FID) during 500 ms. All spectroscopy data were post-processed with the software LUISE (Siemens Medical Solutions; Erlangen, Germany) of the MR scanner, comprising apodization (Gaussian shape), Fourier transformation, phase correction, and baseline correction with a spline function. Signal intensities were quantified by fit of Gaussian lineshapes to the resonances and subsequent integration of the peak areas for trimethyl-ammonium-containing compounds (TMA) among which is choline, total creatine (Cr), myocellular free fatty acids, and tissue water (H2O) in 1H MRS, and PCr, Pi, and adenosine 5′-triphosphate (ATP) in 31P MRS. Intracellular pH was calculated using the Pi-PCr chemical-shift difference Citation[20]. 1H MR signal intensity was normalized by using the measured H2O signal intensity for reference. Examples of in vivo 1H and 31P MR spectra with assignments of the resonances of the quantified metabolites are given in C,D. To avoid contamination of the fitted IMCL integral from extramyocellular lipids (EMCL), caused by adipose tissue in subcutaneous layers or around muscle fasciae Citation[8], voxels were carefully placed within the vastus lateralis boundaries using MRI as guidance.
The total MRI and MRS examination time inside the MR scanner was about 50 min. Additionally, about 25 min were needed for patient positioning and coil placement leading to a total examination time of 75 min.
Contrast-enhanced ultrasound analysis of skeletal muscle perfusion
CEUS was applied after MRI and MRS to the right vastus lateralis muscle covering the planned site of biopsy. We used a CEUS method that has recently been described in detail regarding its theoretical background as well as its applicability and validation for measuring skeletal muscle perfusion parameters in humans Citation[9–11], Citation[21]. In short, CEUS can quantify several perfusion-related parameters Citation[22] by analyzing replenishment kinetics of intravasal contrast agents (microbubbles) in a ROI after their destruction by high-energy ultrasound pulses. Two measurements are necessary to derive perfusion-related parameters from replenishment kinetics, one at an early and one at a late time point of the replenishment kinetics Citation[21]. The examination protocol for quantification of skeletal muscle perfusion using CEUS is briefly described: After the subjects had been resting for 20 min on a stretcher in a cool (20° Celsius), quiet and darkened room, muscle perfusion was measured using a Sequoia 512 ultrasonographic device connected to a linear transducer 15L8w (both Siemens-Acuson, Mountain View, CA). We used power Doppler ultrasonography with a constant device setting: Transmission frequency of 7 megahertz with maximal acoustic power (mechanical index, 1.9) and minimal sensitivity to reduce motion artifacts and to ensure that mainly signals from the microbubbles were detected. The beam width was 0.8 mm and the triggered frame rate was 1.67/s Citation[9]. After choosing a 2.75 cm×2 cm large ROI at a depth of 0.5 cm with a focus depth of 1.5 cm in a representative cross-section at the distal part of the vastus lateralis muscle, a single bolus of 10 ml Levovist® 300 mg/ml was infused within 5 s into a left cubital vein followed by an injection of 15 ml 0.9% saline solution. Then, a continuous video clip was acquired while the probe rested initially at the same position, reflecting the measurement of the early time point of the replenishment kinetics. For measuring the late time point, the probe was slowly moved over the vastus lateralis muscle to its proximal end starting 75 s after contrast injection. The color pixels in the ROI, which are proportional to the microbubbles’ concentration, were measured to quantify the power Doppler video intensity using an external PC-based quantification tool (Data Pro®; Noesis, Courtaboeuf, France) Citation[9]. The baseline-corrected signal intensity reflects the relevant phases of replenishment kinetics, i.e., maximum plateau and initial increase of the derived replenishment curves (E,F). These phases are required to calculate local blood volume, i.e., the blood volume within the slice obtained by the transducer, which is proportional to maximum plateau, blood flow velocity, which is proportional to the initial increase normalized on the maximum plateau, and blood flow, which is proportional to the maximum plateau multiplied by initial increase Citation[9]. Since the choice of device settings (e.g., gain, depth, and ROI size) can influence quantification, they were carefully kept constant.
Sampling and analysis of muscle biopsy
After imaging, muscle biopsies were taken at about mid-thigh level from the right vastus lateralis muscle by the Bergström technique Citation[23] applied after local anesthesia and disinfection. The muscle samples were snap-frozen in liquid nitrogen-cooled isopentane and stored at −70°C. For immunohistochemistry and morphometric analysis, serial transverse sections (6 µm) were cut in a cryotome at −20°C. The mean fiber number that could be analyzed per sample was 220±142. The total cross-sectional capillary count (capillary density per mm2 or microvascular density) was analyzed within the transverse sections after staining with a monoclonal mouse anti-laminin antibody (alpha-5-chain, Chemicon International Inc., Tenecula, CA) in cross-sectional areas containing at least 100 fibers. Fiber cross-sectional areas (FCSA) were analyzed within the same set of serial transverse sections and were determined at a 200-fold magnification. Microscopic video recordings of the cross sections were digitized by a PC-based image analysis system (VIBAM 0.0-VFG1 frame grabber) as described previously Citation[17].
Muscular strength testing
Functional muscle testing was performed both in motion, i.e. isokinetically, and static, i.e. isometrically. Isokinetic muscular strength was measured in two sets of four repetitions of maximal concentric leg extension from 90° flexion to 10° flexion (80° range of motion (ROM), speed 60°/s) using an isokinetic dynamometer (Multi-Joint-System Isomed 2000®, D + R Ferstl GmbH, Hemau, Germany). Prior to testing, subjects were familiarized with use of the dynamometer and the testing procedure in three similar sessions to reduce possible influences of test habituation on muscular performance. Before testing, each subject completed a warm-up protocol of 10 min of cycling (at 30–50% of individual maximal O2-consumption) and a bout of 25 repetitions of concentric flexion and extension on the dynamometer at 30% of individual maximal torque (at 80° ROM and 90°/s speed). Isometric maximal strength measurements were performed on the same dynamometer in 3 sets of 7 seconds with knee position fixed at 40° flexion.
Statistics
Two-sided t-tests were used to assess differences between patients and volunteers. P-values were corrected for multiple comparisons by the method of Bonferroni-Holm. The level of significance of p<0.05 was chosen. Pearson correlations were calculated to investigate the association of TNF-α levels and any of the parameters presented in . Data entry procedures and statistical analysis were performed with a statistical analysis software system (SAS for Windows, SAS Institute, Cary, NC).
Table I. Overview of data from cancer-related cachectic patients and healthy volunteers.
Results
For our study population, anthropometric data, body composition, aerobic capacity, as well as parameters of skeletal muscle morphology, microcirculation, and metabolism are given in .
Morphologic parameters on different levels (body composition, muscle size, and muscle fiber size) were about 30% lower in cachectic patients than in volunteers ( and ; e.g. body mass index: cachexia vs. volunteers, 20±3 vs. 27±4 kg m−2; CSA: 45±13 vs. 67±14 cm2; total fiber size: 2 854±1 112 vs. 4 181±1 461 µm2). No muscle edema was identified in any patient or volunteer. In comparison to healthy volunteers, there was no major lipomatous degeneration of the quadriceps muscle evidenced on MR images in patients with cachexia, because the ratio of muscular signal intensity on T1-weighted images normalized on that of subcutaneous fat tissue was only about 6% higher in cachexia (). Although the comprehensive parameter aerobic capacity (VO2max) was significantly reduced in cachexia (23±9 vs. 32±7 ml min−1 kg−1, Bonferroni-Holm adjusted p = 0.03), both parameters reflecting muscle microcirculation ex vivo (capillary density per mm2) and in vivo (blood volume and flow derived from CEUS) were comparable between cachectic patients and control subjects (all less than 7% percent change between patients and controls, ). TNF-α levels were about 56% higher in cases than in controls ().
Regarding metabolism of skeletal muscles in both populations, high-energy phosphates showed comparable intensities with less than 6% percent change between patients and controls (in arbitrary units, patients vs. healthy volunteers, PCr: 568±117 vs. 602±126; β-ATP: 163±47 vs. 170±40; Pi: 67±13 vs. 71±14). Likewise, pH as a marker of acidosis and the TMA intensity as a marker of membrane turnover had nearly the same values in both groups (less than 6% percent change between patients and controls, ). A significant positive relationship was found for water-reference normalized TMA and TNF-α levels (p = 0.0005). IMCL levels were substantially higher in cachexia (about 35%, ). Other lipid fractions quantified by 1H MRS, such as resonance intensities of β-CH2 and -CH3 groups of lipid chains, showed about 10% lower intensities (patients vs. healthy volunteers, β-CH2: [6.21±5.74]×10−3 vs. [6.95±9.57]×10−3) or were about 50% higher in cachexia (patients vs. healthy volunteers, -CH3: [4.61±3.25]×10−3 vs. [3.06±2.39]×10−3 normalized on the water signal).
Absolute strength of quadriceps muscle was reduced in cachectic patients compared with healthy volunteers by about 33% for isometric and 40% for isokinetic strength (, patients vs. healthy volunteers, isometric: 107±40 vs. 160±40 Nm, isokinetic: 101±46 vs. 167±50 Nm), but the same when normalized on the CSA (patients vs. healthy volunteers, isometric: 2.4±0.5 vs. 2.4±0.4 Nm cm−2, isokinetic: 2.2±0.4 vs. 2.5±0.5 Nm cm−2). The difference of isometric and isokinetic strength normalized on CSA was: Isometric, 0.03 (95%-confidence interval, −0.3 to 0.4) and isokinetic, −0.3 (95%-confidence interval, −0.7 to 0.2), i.e. the available strength per muscle area was not reduced in cachexia.
Discussion
In this study, we explored morphology, metabolism, and microcirculation in skeletal muscles of patients with cancer-related cachexia by MRI, MRS, and CEUS in vivo, as well as ex vivo in biopsies and compared these data with data from matched healthy volunteers. We also investigated muscle functionality by testing the isometric and isokinetic quadriceps muscle's strength.
From the presented data, we draw the conclusion that cancer-related cachexia is associated with a loss of muscle volume, but not of muscular functionality. When normalizing the absolutely measured muscle strength on the reduced CSA in cachectic patients, it turned out that although muscle volume was diminished in cachexia, the principal ability to generate force was maintained. The morphological basis for this finding seems to be the smaller mean fiber diameter associated with an increased total fiber number per area. Obviously, the percentage fiber shrinking explained most of the percentage loss in muscle mass, as measured by CSA, and a larger number of smaller fibers generated the virtually identical strength per cross-sectional area. Whether loss of extramyocellular fat contributed to the muscle CSA reduction as well, cannot be decided from the present analysis.
Our 31P MRS studies of resting muscle exclude additional metabolic causes-so far as detectable by the employed in vivo MRS technique-for loss of muscle function. The concentration of high-energy phosphates, which is mandatory for muscle cell function Citation[7], was not reduced in muscles of cachectic patients. In contrast, in case of irreversible muscle atrophy, a dramatic decrease in high-energy-phosphate levels was observed Citation[24]. 31P MRS could only be performed with resting muscles, because of the long MR examination protocol. Thus, differences between muscles of cachectic patients and healthy volunteers have not been assessed regarding the kinetics of energy metabolism, such as oxidative phosphorylation during recovery from exercise Citation[7], which may limit contracting ability of the muscles. To our knowledge, there are still no studies exploring the kinetics of energy metabolism in those patients. Nevertheless, another finding supported our hypothesis: Also, both ex vivo and in vivo data of muscle capillarization were not different in both groups, which may – together with the results from MRS – be another indication of a sufficient oxidative-phosphorylation potential and perfusion-related O2-availability in muscles of patients with cancer-induced cachexia. This also means that these muscles should respond positively to specific training schemes, since muscle cells are apparently not (irreversibly) structurally degenerated. The 1H MRS results of our study also agree with the hypothesis that muscles in cachexia are not structurally irreversibly impaired. The TMA levels were comparable in both populations. Since the signal of choline, a marker of membrane turnover, that takes place, e.g., in muscular reorganization processes, contributes to the TMA peak, this finding possibly indicates missing fatty alteration in muscles of cachectic patients, which was also demonstrated by MRI (comparable T1-signal intensity ratios of muscle/subcutaneous fat tissue in both groups). On the other hand, our results suggest a positive correlation of TMA and TNF-α levels and some myocellular lipid components measured by 1H MRS, such as IMCL and -CH3 groups of lipid chains, were substantially higher, while others (β-CH2) were lower in muscles of cachectic patients – an issue, which clearly needs further exploration. Obesity – reflecting caloric oversupply – and aerobic fitness are important determinants of myocellular free fatty acids Citation[25]. In case of irreversible muscle atrophy, strongly increased lipid signals in lipomatous degenerated skeletal muscles can be observed (increase of more than 80% compared with healthy muscles) Citation[24].
Thus, all these in vivo and ex vivo findings substantiate the rationale that there is no major contraindication but rather an indication for training these patients. Strength training has already been demonstrated to be beneficial in a pilot study on patients with cachexia induced by rheumatoid arthritis Citation[26]. Other emerging functional MR techniques, such as arterial spin labeling and blood oxygen level-dependent sequences to measure muscle perfusion, diffusion-tensor imaging techniques that allow for visualizing fiber patterns and measuring parameters of muscular microstructural integrity, as well as dynamic 31P MRS techniques, may help to further elucidate whether muscle cells in cachexia are structurally degenerated and contracting functionality is preserved or impaired and thus should be considered in future studies on this topic.
Most patients with cancer-induced cachexia experience a reduction in capacity of daily activity, especially locomotion and other tasks requiring mainly aerobic muscle work Citation[27], Citation[28]. Among the factors responsible for the impaired performance, the progressive loss of muscle mass could be targeted early in therapy, because muscle force correlates closely with muscle volume Citation[29] and dedicated training schemes induce detectable muscle hypertrophy as an early contributor to strength gain after only 3 weeks of training Citation[30]. To what extent muscle loss and fat loss are responsible for the reduction in performance and may precede each other in the process of cancer related cachexia remains at present a matter of debate Citation[31], Citation[32]. This question may be considered academic given the fact that cachectic cancer patients are presently seen months after surgery or begin of chemotherapy and thus have a considerable loss of both muscle and fat. Likewise, in our study both parameters of body fat and muscle mass were significantly reduced in the cachexia group.
TNF-α levels were substantially higher in our cachectic patients. This cytokine is considered one of the major triggers of cachexia in cancer and various other human diseases such as chronic obstructive pulmonary disease Citation[1], Citation[15], Citation[16]. TNF-α levels, among various other factors, may depend on the prevailing fat mass, which is one of its sources but wasted upon cachexia. Our definition of the inclusion criterion as a progressive weight loss of >10% in 6 months, may imply a bias towards moderate cachexia and thus excluding advanced to terminal cachexia, because these patients would not have tolerated our examination protocol.
In conclusion, the present study provides arguments for the hypothesis that although cancer-related cachexia leads to loss of muscle volume, contracting functionality is preserved in principle and this should be a rationale against the still frequent recommendation of rest, but rather of training the muscles of these patients.
Acknowledgements
The authors appreciate the expert assistance of Marco Ulrich, PhD, Central Institute of Mental Health, Mannheim, for analysis of MR spectroscopic data. The authors thank Juan Millies, Ingrid Ionescu, and René Hertel, Department of Radiology, German Cancer Research Center (dkfz), for skillful assistance in performing 31P and 1H MRS examinations. The skillful assistance of Hanna Renk and Annette Künkele, National Center for Tumor Diseases (NCT), Heidelberg, for analysis of muscle biopsies is gratefully acknowledged.
References
- Argiles JM, Alvarez B, Lopez-Soriano FJ. The metabolic basis of cancer cachexia. Med Res Rev 1997; 17: 477–98
- Tisdale MJ. Cachexia in cancer patients. Nat Rev Cancer 2002; 2: 862–71
- Ebrahimi B, Tucker SL, Li D, Abbruzzese JL, Kurzrock R. Cytokines in pancreatic carcinoma: Correlation with phenotypic characteristics and prognosis. Cancer 2004; 101: 2727–36
- Giordano A, Calvani M, Petillo O, Carteni M, Melone MRAB, Peluso G. Skeletal muscle metabolism in physiology and in cancer disease. J Cell Biochem 2003; 90: 170–86
- Boesch C, Machann J, Vermathen P, Schick F. Role of proton MR for the study of muscle lipid metabolism. NMR Biomed 2006; 19: 968–88
- Taylor DJ. Clinical utility of muscle MR spectroscopy. Semin Musculoskelet Radiol 2000; 4: 481–502
- Argov Z, Lofberg M, Arnold DL. Insights into muscle diseases gained by phosphorus magnetic resonance spectroscopy. Muscle Nerve 2000; 23: 1316–34
- Boesch C, Kreis R. Observation of intramyocellular lipids by 1H-magnetic resonance spectroscopy. Ann N Y Acad Sci 2000; 904: 25–31
- Krix M, Weber MA, Krakowski-Roosen H, Huttner HB, Delorme S, Kauczor HU, et al. Assessment of skeletal muscle perfusion using contrast-enhanced ultrasonography. J Ultrasound Med 2005; 24: 431–41
- Weber MA, Krix M, Jappe U, Huttner HB, Hartmann M, Meyding-Lamade U, et al. Pathologic skeletal muscle perfusion in patients with myositis: Detection with quantitative contrast-enhanced US – initial results. Radiology 2006; 238: 640–9
- Weber MA, Krakowski-Roosen H, Delorme S, Renk H, Krix M, Millies J, et al. Relationship of skeletal muscle perfusion measured by contrast-enhanced ultrasonography to histologic microvascular density. J Ultrasound Med 2006; 25: 583–91
- Lukaski HC. Methods for the assessment of human body composition: Traditional and new. Am J Clin Nutr 1987; 46: 537–56
- Palange P, Forte S, Onorati P, Paravati V, Manfredi F, Serra P, et al. Effect of reduced body weight on muscle aerobic capacity in patients with COPD. Chest 1998; 114: 12–8
- Richardson RS, Grassi B, Gavin TP, Haseler LJ, Tagore K, Roca J, et al. Evidence of O2-supply-dependent VO2max in the exercise-trained human quadriceps. J Appl Physiol 1999; 86: 1048–53
- Di Francia M, Barbier D, Mege JL, Orehek J. Tumor necrosis factor-alpha levels and weight loss in chronic obstructive pulmonary disease. Am J Respir Crit Care Med 1994; 150: 1453–5
- Pitsiou G, Kyriazis G, Hatzizisi O, Argyropoulou P, Mavrofridis E, Patakas D. Tumor necrosis factor-alpha serum levels, weight loss and tissue oxygenation in chronic obstructive pulmonary disease. Respir Med 2002; 96: 594–8
- Friedmann B, Kinscherf R, Borisch S, Richter G, Bärtsch P, Billeter R. Effects of low-resistance/high-repetition strength training in hypoxia on muscle structure and gene expression. Pflugers Arch 2003; 446: 742–51
- Bachmann G, Damian MS, Koch M, Schilling G, Fach B, Stoppler S. The clinical and genetic correlates of MRI findings in myotonic dystrophy. Neuroradiology 1996; 38: 629–35
- Frahm J, Bruhn H, Gyngell ML, Merboldt KD, Hanicke W, Sauter R. Localized high-resolution NMR spectroscopy using stimulated echoes: Initial applications to human brain in vivo. Magn Res Med 1989; 9: 79–93
- Ng TC, Evanochto WT, Hiramoto RN, Ghanta VK, Lilly MB, Lawson AJ, et al. 31P NMR spectroscopy of in vivo tumors. J Magn Res 1982; 49: 271–86
- Krix M, Kiessling F, Farhan N, Schmidt K, Hoffend J, Delorme S. A multivessel model describing replenishment kinetics of ultrasound contrast agent for quantification of tissue perfusion. Ultrasound Med Biol 2003; 29: 1421–30
- Wei K, Jayaweera AR, Firoozan S, Linka A, Skyba DM, Kaul S. Quantification of myocardial blood flow with ultrasound-induced destruction of microbubbles administered as a constant venous infusion. Circulation 1998; 97: 473–83
- Bergström J. Percutaneous needle biopsy of skeletal muscle in physiological and clinical research. Scand J Clin Lab Invest 1975; 35: 609–16
- Schröder L, Weber MA, Ulrich M, Regula JU. Metabolic imaging of atrophic muscle tissue using appropriate markers in 1H and 31P NMR spectroscopy. Neuroradiology 2006; 48: 809–16
- Thamer C, Machann J, Bachmann O, Haap M, Dahl D, Wietek B, et al. Intramyocellular lipids: Anthropometric determinants and relationships with maximal aerobic capacity and insulin sensitivity. J Clin Endocrinol Metab 2003; 88: 1785–91
- Marcora SM, Lemmey AB, Maddison PJ. Can progressive resistance training reverse cachexia in patients with rheumatoid arthritis? Results of a pilot study. J Rheumatol 2005; 32: 1031–9
- Ahlberg K, Ekman T, Gaston-Johansson F, Mock V. Assessment and management of cancer-related fatigue in adults. Lancet 2003; 362: 640–50
- Evans WJ. Physical Function in men and woman with cancer. Effects of anemia and conditioning. Oncology 2002; 16: 109–15
- Holzbaur KR, Delp SL, Gold GE, Murray WM. Moment-generating capacity of upper limb muscles in healthy adults. J Biomech 2007; 40: 2442–9
- Seynnes OR, de Boer M, Narici MV. Early skeletal muscle hypertrophy and architectural changes in response to high-intensity resistance training. J Appl Physiol 2007; 102: 368–73
- Ryden M, Arner P. Fat loss in cachexia–is there a role for adipocyte lipolysis?. Clin Nutr 2007; 26: 1–6
- Saini A, Nasser AS, Stewart CE. Waste management – cytokines, growth factors and cachexia. Cytokine Growth Factor Rev 2006; 17: 475–86