Abstract
Background. The image quality of 4DCT depends on breathing regularity. Respiratory audio coaching may improve regularity and reduce motion artefacts. We question the safety of coached planning 4DCT without coaching during treatment. We investigated the possibility of coaching to a more stable breathing without changing the breathing amplitude. The interfraction variation of the breathing cycle amplitude in free and coached breathing was studied as well as the possible impact of fatigue on longer coaching sessions. Methods. Thirteen volunteers completed respiratory audio coaching on 3 days within a 2 week period. An external marker system monitoring the motion of the thoraco-abdominal wall was used to track the respiration. On all days, free breathing and two coached breathing curves were recorded. We assumed that free versus coached breathing from day 1 (reference session) simulated breathing during an uncoached versus coached planning 4DCT, respectively, and compared the mean breathing cycle amplitude to the free versus coached breathing from day 2 and 3 simulating free versus coached breathing during treatment. Results. For most volunteers it was impossible to apply coaching without changes in breathing cycle amplitude. No significant decrease in standard deviation of breathing cycle amplitude distribution was seen. Generally it was not possible to predict the breathing cycle amplitude and its variation the following days based on the breathing in the reference session irrespective of coaching or free breathing. We found a significant tendency towards an increased breathing cycle amplitude variation with the duration of the coaching session. Conclusion. These results suggest that large interfraction variation is present in breathing amplitude irrespective of coaching, leading to the suggestion of daily image guidance for verification of respiratory pattern and tumour related motion. Until further investigated it is not recommendable to use coached 4DCT for planning of a free breathing treatment course.
In radiotherapy of lung cancer, breathing-related tumour motion must be taken into account. When using new and fast multislice CT scanners there is a potential risk of misleading information on tumour configuration because of motion artefacts Citation[1] or of imaging the tumour in a peripheral position of its motion range. One approach to solve these problems is to apply 4D CT Citation[2]. In a 4D CT scan, images are over-sampled and sorted into different bins each related to a different phase of the breathing cycle, thereby creating images of the tumour configuration and position throughout the entire breathing cycle. In this way it is possible to analyse the intrafraction variation of the tumour motion and for example estimate the mean tumour position. Wolthaus et al. suggested that by using the midventilation scan for planning, the risk of introducing a systematic error caused by tumour motion is diminished Citation[3]. However, the image quality in a 4D CT scan depends on the regularity of breathing, and irregular breathing may cause artefacts which in effect distort the images making evaluation and delineation difficult. Respiratory coaching for 4D CT may improve breathing regularity and thereby reduce motion artefacts. Unless respiratory coaching is applied during treatment, this presupposes that tumour motion is not affected by the respiratory coaching.
It has already been documented that audio respiratory coaching improves frequency regularity Citation[4], Citation[5]. However, it is the breathing cycle amplitude that is closely related to tumour motion Citation[6], Citation[7] and is addressed in this study.
We questioned the safety of applying audio coaching for the planning 4D CT without coaching during treatment. Hence, this study investigates whether it is possible to audio coach to a more stable breathing mimicking free breathing without changing the breathing cycle amplitude. Moreover, we wanted to investigate whether the variability of the breathing motion in free and coached breathing changed from day to day. We also wanted to investigate whether the variability of the breathing motion increased with the duration of the breathing session, as a sign of fatigue, questioning the safety of respiratory coaching for long treatment sessions such as hypo-fractionation schedules. Finally, we wanted to investigate two different audio coaching approaches.
Materials and methods
Thirteen volunteers went through respiratory audio coaching on three different days within a two-week period. Recruitment was made through a notice to the staff in the department of Radiation Oncology in Rigshospitalet. No preselection was made concerning gender or age. Smoking history was recorded. The Real Time Position Management (RPM) 1.6.5 and 1.7.5 systems (Varian Medical systems, Palo Alto, California) were used to track and record the respiratory traces. The system consists of a marker box with two reflective markers and an infrared camera interfaced to a computer. The RPM software installed on the computer records the traces of the reflective markers with a frame rate of 25 frames per second. The volunteers were positioned on their back with a pillow to support the head, their arms above the head and a knee support, mimicking a lung cancer treatment position. The marker box was placed on the lower chest or upper abdomen to ensure an unambiguous presentation of the breathing phases. A drawing showing the marker box positions ensured a uniform day-to-day positioning. On all days three breathing curves were recorded; a two-minute free breathing curve and hereafter two different audio coached breathing curves lasting five minutes each. The two coached breathing sequences were started with one minute of free breathing. A recorded female voice saying “in” and “out” was used for audio coaching. The first coaching approach consisted of the following steps: The two-minute free breathing curve was visually inspected and three typical breathing cycles were chosen. The duration of the in- and expiration phases were determined for the three cycles, mean values calculated and used for the first respiratory coaching (coach 1). For the second respiratory coaching the volunteer adjusted the length of the in- and expiration intervals aiming at a comfortable and natural breathing (coach 2). On the two subsequent days, the audio frequencies found on the first day were used. After each coaching sequence on the subsequent days the volunteer was asked if the breathing rhythm felt comfortable, and if not, to describe whether the intervals had been too long or too short.
Data analysis
Data processing of the breathing curves was performed using Matlab®. The breathing curves were split into 30-second sequences. An effort was made to split the curves between the end in- and expiration phases as this improved the accuracy of the following division into separate breathing cycles. Ensuring this caused a maximum two-second overlap or maximum one-second gap between the sequences in the split curves. In all coached breathing sequences the initial free breathing part was split from the rest and the first 15 seconds of the audio coaching were regarded as an adaptation period, and thus cut out and not analysed. All the subsequent 30-second sequences were analysed using Fourier transformation to find the typical frequency for each sequence and then split the sequences into separate breathing cycles. For each breathing cycle an exhale point was defined as the 5% fractile of the box positions and an inhale point was defined as the 95% fractile of the box positions. The breathing cycle amplitude was defined as the distance between the inhale and the exhale point. This method is previously described by Juhler-Nøttrup et al. Citation[8]. To ensure that the sizes of the amplitudes in the sequences were normally distributed a Kolmogorov-Smirnov test for continuous variables (WinSTAT statistics) was performed. This test was performed with data from two volunteers.
The reference session (day 1): Free breathing versus coaching
We compared the mean breathing cycle amplitude of the two coached breathing traces to the mean breathing cycle amplitude of free breathing using a two tailed student's t-test, significance level p < 0.05 Citation[9]. The medians and crude ranges of the absolute numeric difference between the mean breathing cycle amplitude of the two coaching approaches and free breathing for all volunteers on day 1 were determined. To investigate whether the coached breathing was less variable with respect to amplitude compared to free breathing, the SD of breathing cycle amplitude distribution of the two-minute free breathing from the first day was compared to the SD of breathing cycle amplitude distribution of the first two minutes of both the two coached breathing curves from the first day using a Wilcoxon paired signed rank test, significance level p < 0.05 Citation[9]. The two-minute period was chosen because it is approximately the time it takes to perform a 4D CT of the thorax using a multislice CT.
Interfraction variation
The breathing traces from the first day were considered the reference sessions, and we wanted to test if they were representative for the breathing the following days.
To allow a comparison of the variability of the breathing from day to day, without the influence of random variations such as set-up variations and variations in stomach filling, a normalised SD was calculated: All breathing cycle amplitudes of each sequence were normalised to their mean and the SD of their distribution was calculated. We assumed that first day's free breathing simulated a free breathing 4D CT planning and compared the breathing cycle amplitude to the breathing cycle amplitude of the free breathing from day 2 and 3 simulating free breathing treatment. We equally assumed that the coached breathing from day 1 simulated a coached 4D CT planning and that coached and free breathing respectively from day 2 and 3 simulated free and coached treatment sessions for comparison of breathing cycle amplitudes. A comparison between the means and the SD of breathing cycle amplitude distributions as well as a comparison between the normalised SD of breathing cycle amplitude distributions was made.
For the comparison of means a two tailed student's t-test, significance level p < 0.05, was used Citation[9].
The medians and the crude ranges of the absolute numeric difference between the mean breathing cycle amplitudes of the first two minutes of the breathing sequences of the reference sessions and from the treatment days for the simulated courses for all volunteers were determined.
Variability and duration of the coaching session
Assuming coaching was applied during hypo-fractionated radiotherapy we examined whether the variation of the breathing increased with the duration of the coaching session. In our department it takes between two to four minutes to deliver a hypo-fractionated treatment field depending on the technique applied. The breathing cycle amplitude of the first two minutes was compared to the following two minutes breathing cycle amplitude using student's t-test, significance level p < 0.05. We also compared the SD of breathing cycle amplitude distribution of the two first minutes to the following two minutes of the coached sequences for all volunteers. The Wilcoxon paired signed rank test, significance level p < 0.05, was used to test if there was a significant tendency in the change in SD of breathing cycle amplitude distribution from the first two to the following two minutes. For the latter analysis the data from all three days were pooled giving two datasets of 36 samples to analyse.
Comparing the two coaching approaches
We evaluated if one of the two coaching approaches gave a less variable breathing pattern than the other. Looking at the first day the SD of breathing cycle amplitude distribution of the two coaching approaches were compared. To compare the data from all days the normalised SD of breathing cycle amplitude distribution was used to compare coach 1 to coach 2. The Wilcoxon paired signed rank test, significance level p < 0.05, was used for both comparisons.
Results
The characteristics of the volunteers are shown in . Volunteer number one (age 62, former smoker, no pulmonary disease) was excluded as he was not able to follow the audio coaching at all. The data from the remaining 12 volunteers were analysed.
Table I. Demographics of the 13 volunteers
The magnitude of the breathing cycle amplitudes on day 1 of volunteer number four and seven was tested to be approximately Gaussian distributed, with the exception of a single very deep inspiration breathing cycle.
The reference session (day 1): Free breathing versus coaching
Within the first day the mean breathing cycle amplitude of coach 1 and coach 2 respectively was compared to the mean breathing cycle amplitude of free breathing. For seven of 12 volunteers the mean breathing cycle amplitude increased significantly and for two it decreased significantly with coach 1 compared to free breathing (p values between <0.0001 and 0.0156). With coach 2 the mean breathing cycle amplitude increased significantly for six volunteers and decreased significantly for two of the volunteers compared to free breathing (p < 0.0001–0.0237).
shows the mean and SD of the breathing cycle amplitude distribution for free breathing, coach 1 and coach 2 on the first day for the 12 volunteers.
Figure 1. The mean and SD of the breathing cycle amplitude distribution in free and coached breathing from day 1. Free breathing – white, coach 1 – hatched, coach 2 – grey.
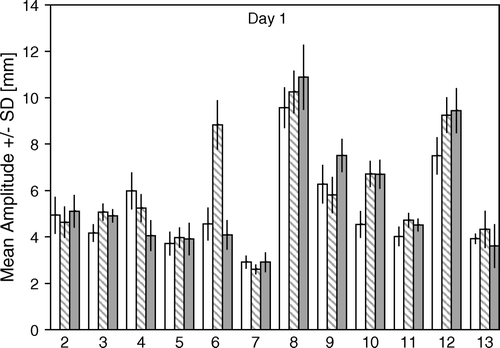
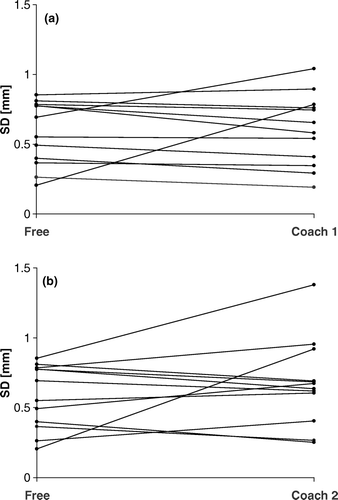
compares the SD of the breathing cycle amplitude distribution on day 1 for free breathing, coach 1 and coach 2 respectively. There was no significant tendency towards a decrease in SD with either coaching approach compared to free breathing.
Figure 2. Comparisons of the SD of the breathing cycle amplitude distribution between free breathing and coach 1 (a) and free breathing and coach 2 (b) in the reference session.
The median (crude range) of the absolute numeric difference between the mean breathing cycle amplitude of coach 1 and free breathing for all volunteers was 0.69 mm (0.27–4.29 mm). The median of the absolute numeric difference between the mean breathing cycle amplitude of coach 2 and free breathing for all volunteers was 0.62 mm (0.003–2.16 mm).
Interfraction variation
Mimicking a free breathing planning 4D CT and free breathing treatment we compared the free breathing on day 1 to the free breathing of the following days: This showed a significant increase in mean breathing cycle amplitude for nine and a significant decrease for one volunteer on day 2 (p < 0.0001–0.0387), and a significant increase in mean breathing cycle amplitude for nine and a significant decrease for two volunteers on day 3 (p < 0.0001–0.0228). In a the mean breathing cycle amplitude for free breathing is visualised for day 1–3 for the twelve volunteers.
Figure 3a-e. The mean and SD of the breathing cycle amplitude distribution in the simulated courses. Day 1 – white, day 2 – hatched, day 3 – grey. a) free all three days. b) coach 1 day1, free day 2 + 3. c) coach 2 day1, free day 2 + 3. d) coach 1 all three days. e) coach 2 all three days.
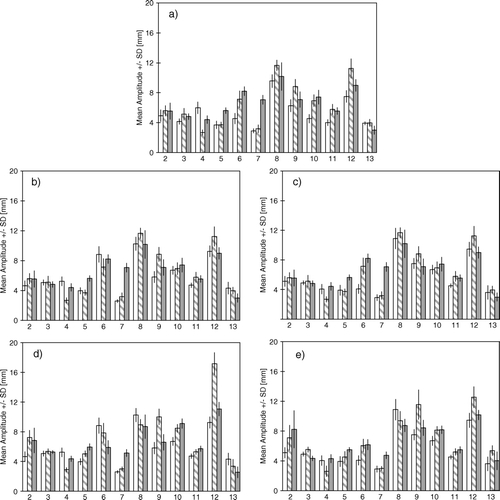
The median of the absolute difference between the mean breathing cycle amplitudes of the free breathing in reference sessions and free breathing on day 2 and 3 for all volunteers was 1.55 mm (0.01–4.16 mm).
In order to simulate a coached 4D CT for planning and free breathing treatment we compared both of the two coaching approaches from the first day to the free breathing of the following days: For coach 1 there was a significant increase in mean breathing cycle amplitude for six and a significant decrease for two volunteers on day 2 (p < 0.0001), and a significant increase in mean breathing cycle amplitude for six and a decrease for four volunteers on day 3 (p < 0.0001–0.0307). For coach 2 there was a significant increase in mean breathing cycle amplitude for six and a significant decrease for one volunteer on day 2 (p < 0.0001–0.043) and on the third day there was a significant increase in mean breathing cycle amplitude for six and a significant decrease for one volunteer (p < 0.0001–0.0356). In b + c the mean breathing cycle amplitude for coach 1 and 2 respectively from day 1 and free breathing from day 2 and 3 is visualised for all volunteers.
The median of the absolute numeric difference between the mean breathing cycle amplitudes of the coach 1 reference session and free breathing on day 2 and 3 for all volunteers was 0.87 mm (0.05–4.47 mm). The median of the absolute numeric difference between the mean breathing cycle amplitudes of the coach 2 reference session and free breathing on day 2 and 3 for all volunteers was 0.66 mm (0.09–4.16 mm).
Mimicking a coached 4D CT for planning and coaching during treatment we compared coaching on the first day to coaching on the following days for both of the two coaching approaches: For coach 1 there was a significant increase in mean breathing cycle amplitude for eight and a significant decrease for four volunteers on both day 2 (p < 0.0001–0.0104) and 3 (p < 0.0001–0.0218). For coach 2 there was a significant increase in mean breathing cycle amplitude for ten and a significant decrease for two volunteers on day 2 (p < 0.0001–0.0095) and a significant increase in mean breathing cycle amplitude for eight and a significant decrease for two volunteers on day 3 (p < 0.0001–0.0089). In d + e the mean breathing cycle amplitude for coach 1 and 2 respectively is visualised for day 1–3 for all volunteers.
The median of the absolute numeric difference between the mean breathing cycle amplitudes of the coach 1 reference session and coach 1 on day 2 and 3 for all volunteers was 1.65 mm (0.21–7.92 mm). The median of the absolute numeric difference between the mean breathing cycle amplitudes of the coach 2 reference session and coach 2 on day 2 and 3 for all volunteers was 1.46 mm (0.09–4.04 mm).
For most volunteers significant interfraction variation was present in all the simulated treatment courses irrespective of coached or free breathing.
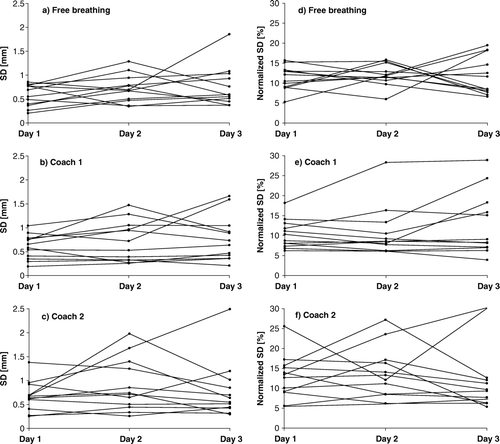
In the SD (a-c) as well as the normalised SD (d-f) of the breathing cycle amplitude distribution for free breathing, coach 1 and coach 2 on the three days are displayed. On all three days the normal breathing had a smaller range than coach 1 and coach 2 for both the SD and the normalised SD of the breathing cycle amplitude distribution.
Figure 4a-f. The SD of the breathing cycle amplitude distribution (a-c) and the normalised SD of the breathing cycle amplitude distribution (d-f) for free breathing, coach 1 and coach 2 on the three days.
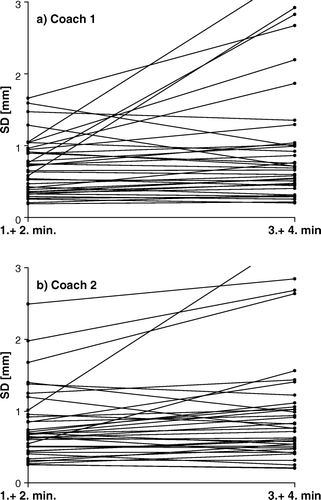
Variability and the duration of the coaching session
We tested whether the mean breathing cycle amplitude from the first two minutes to the following two minutes for coach 1 and 2 changed significantly for each volunteer on each day. Pooled data for all volunteers on all days showed a significant increase for five sessions, a significant decrease for 13 sessions (p < 0.0001–0.0336) and no significant change for 18 sessions with coach 1. With coach 2 there was significant increase for five sessions, a significant decrease for eight sessions (p < 0.0001–0.0487) and no significant change for 23 sessions.
Comparing the SD of the breathing cycle amplitude distribution of the first two minutes of coaching with the following two minutes of coaching showed a significant increase in SD of the breathing cycle amplitude distribution with the duration of coaching for both coach 1 (p = 0.034) and coach 2 (p = 0.0155). In the SD of the first two minutes and the following two minutes is plotted for coach 1 (a) and coach 2 (b).
Figure 5. SD of the breathing cycle amplitude distribution from the first two minutes and the following two minutes from all volunteers on all days.
Comparing the two coaching approaches
At the reference session (day 1) there was no significant difference between the SD of breathing cycle amplitude of the two coaching approaches (p = 0.246). Comparing the normalised SD of the breathing cycle amplitude distribution from all volunteers on all three days there was a significant tendency towards a larger normalised SD for coach 2 (p = 0.0414). Volunteer number two, five and eight wanted no change in the in- and expiration intervals for coach 2, the rest of the volunteers wanted to extend the in- or expiration interval. In general the volunteers felt more comfortable with coach 2 on the first day but this was less clear on the following days.
Discussion
We found a significant change in the amplitude between free and coached breathing for most volunteers on the day of the reference session. The absolute differences were small for most volunteers, but the relative changes cannot be ignored. It can be assumed that changes in breathing motion translates into similar changes in tumour motion Citation[6], Citation[7], leading to the conclusion that respiratory coaching probably can lead to changes in tumour motion. It can be argued that the change in breathing cycle amplitude caused by audio coaching might be acceptable because of an improvement of the image quality of the 4D CT, and that the change in tumour motion caused by the change in breathing amplitude may be predicted and incorporated into a standard margin. Such predictions should be based on the mean difference in mean tumour amplitude in three dimensions for several patients and not on external marker box motion. Therefore further and larger studies of the tumour motion comparing free breathing and respiratory coaching are warranted as are studies examining the potential advantage of using respiratory coaching for planning 4D CT, comparing the image quality in free breathing versus coached breathing 4D CT scans of the individual patient.
Our results show that significant interfraction variation is present in breathing amplitude irrespective of coaching. For the majority of the volunteers it was not possible to reproduce the breathing cycle amplitude and its variation the following days based on the breathing in the reference session irrespective of coaching or free breathing. There is no reason to believe that this will be different for lung cancer patientsCitation[8]. This interfraction motion variation in breathing cycle amplitude indicates the presence of a significant interfraction variation in tumour motion, which has to be taken into account when designing appropriate margins for lung cancer radiotherapy. The day-to-day variation of tumour motion during lung cancer radiotherapy with or without respiratory coaching is not fully known. We support the use of daily image guidance to verify respiratory pattern and tumour motion irrespective of conventional or breathing adapted radiotherapy for lung cancer.
We also found that the variability probably tends to increase with the duration of the coaching session. This should lead to caution before considering coaching for longer treatment sessions such as hypo-fractionated radiotherapy.
We compared two different audio coaching approaches: Coach 1 was based on the free breathing in- and expiration intervals. Coach 2 was adjusted to be comfortable by the volunteers. We wanted to evaluate if one of the approaches was superior to the other in preventing changes in breathing cycle amplitude compared to free breathing. Both approaches induced significant changes in the mean breathing cycle amplitude for most patients. A comparison of the normalised SD of the breathing cycle amplitude distribution showed a significant tendency towards a larger variability when applying coach 2. This difference is probably induced by fatigue since coach 2 was always applied last.
We are aware that in this study as in daily clinical practice, many stochastic variables can influence the magnitude of the breathing amplitude: Set up variables, placement of the marker box, filling of the stomach and bowels etc. and some of these may influence tumour movement. These variables may affect our results when comparing amplitudes from different days. Trying to rule out the effect of these variables, we chose also to analyse the normalised variation in amplitude – the normalised SD.
In this study only audio coaching is applied despite other studies having shown that audio visual coaching is superior in decreasing variability of breathing cycle amplitude Citation[5], Citation[10]. Audio visual coaching is less feasible than audio coaching as many lung cancer patients cannot comply with the technique Citation[5]. Audio coaching is an easy and feasible approach.
In this study we are trying to mimic a clinical situation but the volunteers may not be representative for lung cancer patients considering age, smoking history and co-morbidity and presumably have a much better lung function.
One volunteer could not comply with the audio coaching. This is in concordance with our clinical experience with respiratory gated radiotherapy for breast cancer patients, where about 10% of patients can not comply with the respiratory coaching Citation[11].
In a study by Neicu et al. from 2006 Citation[5] the impact of respiratory audio and audiovisual coaching was examined for lung cancer patients undergoing 4D CT. Thirteen patients in the study were audio coached and the amplitude increased with coaching in most cases. There was no major difference in the variation in amplitude between coached and normal breathing. In a study from 2003 of five patients with thoracic malignancies, Kini et al. found that audio coaching decreased the variation in frequency but gave a larger variability and amplitude Citation[4]. In a larger study of 24 patients by George et al. examining consecutive four-minute long audio coached breathing curves, they found an increase in amplitude of the audio coached breathing as compared with free breathing. No significant increase in breathing variability with the duration of the breathing session was found Citation[10], Citation[12]. Thus, from the available evidence so far it seems that an increase in amplitude can be expected during audio coaching, as compared with free breathing. More studies of the interfraction variation of free and coached breathing are needed.
Not many studies have assessed the influence of respiratory coaching on tumour movement. Recently Haasbeek et al. showed that coaching does influence tumour motion. Twenty two lung cancer patients had both a coached and a normal breathing 4D CT. They found a significant displacement of the centre of the internal target volume mainly in the cranio-caudal direction, leading them to recommend audio coaching throughout the treatment course, if used for planning Citation[13]. Again, the day-to-day variation of tumour motion during respiratory coaching is not known and fluoroscopy studies investigating the effect of coaching on the interfraction tumour motion are warranted.
Conclusion
This study indicates that significant interfraction variation is present in breathing cycle amplitude irrespective of coaching or free breathing leading us to suggest that daily image guidance should be applied to verify respiratory pattern and tumour related motion even during free breathing planning and treatment. Until further investigated it is not recommendable to use coached 4D CT for planning of a free breathing treatment course.
Acknowledgements
The authors would like to thank the volunteers for participating and making the data collection possible. The department of Radiation Oncology has a research agreement with Varian Medical Systems.
References
- Shimizu S, Shirato H, Ogura S, kita-Dosaka H, Kitamura K, Nishioka T, et al. Detection of lung tumor movement in real-time tumor-tracking radiotherapy. Int J Radiat Oncol Biol Phys 2001; 51: 304–10
- Keall P. 4-dimensional computed tomography imaging and treatment planning. Semin Radiat Oncol 2004; 14: 81–90
- Wolthaus JW, Schneider C, Sonke JJ, van HM, Belderbos JS, Rossi MM, et al. Mid-ventilation CT scan construction from four-dimensional respiration-correlated CT scans for radiotherapy planning of lung cancer patients. Int J Radiat Oncol Biol Phys 2006; 65: 1560–71
- Kini VR, Vedam SS, Keall PJ, Patil S, Chen C, Mohan R. Patient training in respiratory-gated radiotherapy. Med Dosim 2003; 28: 7–11
- Neicu T, Berbeco R, Wolfgang J, Jiang SB. Synchronized moving aperture radiation therapy (SMART): Improvement of breathing pattern reproducibility using respiratory coaching. Phys Med Biol 2006; 51: 617–36
- Korreman S, Mostafavi H, Le QT, Boyer A. Comparison of respiratory surrogates for gated lung radiotherapy without internal fiducials. Acta Oncol 2006; 45: 935–42
- Vedam SS, Kini VR, Keall PJ, Ramakrishnan V, Mostafavi H, Mohan R. Quantifying the predictability of diaphragm motion during respiration with a noninvasive external marker. Med Phys 2003; 30: 505–13
- Juhler-Nottrup T, Korreman SS, Pedersen AN, Aarup LR, Nystrom H, Olsen M, et al. Intra- and interfraction breathing variations during curative radiotherapy for lung cancer. Radiother Oncol 2007; 84: 40–8
- http://faculty.vassar.edu/lowry/VassarStats.html. 2008. Ref Type: Computer Program.
- George R, Ramakrishnan V, Siebers JV, Chung TD, Keall PJ. Investigation of patient, tumour and treatment variables affecting residual motion for respiratory-gated radiotherapy. Phys Med Biol 2006; 51: 5305–19
- Korreman SS, Pedersen AN, Josipovic M, Aarup LR, Juhler-Nottrup T, Specht L, et al. Cardiac and pulmonary complication probabilities for breast cancer patients after routine end-inspiration gated radiotherapy. Radiother Oncol 2006; 80: 257–62
- George R, Chung TD, Vedam SS, Ramakrishnan V, Mohan R, Weiss E, et al. Audio-visual biofeedback for respiratory-gated radiotherapy: Impact of audio instruction and audio-visual biofeedback on respiratory-gated radiotherapy. Int J Radiat Oncol Biol Phys 2006; 65: 924–33
- Haasbeek CJ, Spoelstra FO, Lagerwaard FJ, van Sornsen de Koste JR, Cuijpers JP, Slotman BJ, et al. Impact of audio-coaching on the position of lung tumors. Int J Radiat Oncol Biol Phys 2008.