Abstract
Introduction. Our aim was to investigate the immune status of midgut carcinoid patients. Cancer patients generally display suppressed Th1-type immunity that disables mounting of an efficient anti-tumor response. However, little is known about patients with neuroendocrine midgut carcinoids. Material and methods. Circulating regulatory T cells were determined in patient blood by staining for CD4, CD25 and FoxP3 in flow cytometric analysis. T cell proliferation was measured by Alamar Blue in response to polyclonal activation and the regulatory phenotype of patient CD25+ cells was validated by allogeneic stimulation of CFSE labelled responders. Cytokine levels in patient peripheral blood were measured by ELISA and CBA. Tumor infiltrating T cells were analyzed by immunohistochemistry and immunofluorescence. Results. The results demonstrate that midgut carcinoid patients exhibit increased frequencies of circulating Tregs and patient T cells have a decreased proliferative capacity compared to healthy donors. Systemic Th1-promoting cytokines are reduced. Midgut carcinoid tumors display CD4+ and CD8+ T cell infiltration, always in the presence of regulatory CD4+FoxP3+ cells. Discussion. Midgut carcinoid patients display elevated T regulatory cell numbers and T cell dysfunction. Therapeutic strategies to overcome tumor-induced Th1 immunosuppression are required in combination with anti-tumor vaccinations.
Cancer immunotherapy has thus far primarily been focusing on the activation and amplification of anti-tumor immune responses with emphasis on T helper (Th) 1 immunity activating cytolytic T cells (CTLs). A host of tumor-associated antigens (TAA) have been identified Citation[1] and used in adoptive T cell therapies Citation[2], Citation[3] and dendritic cell (DC) vaccinations Citation[4–6]. Several clinical trials have been conducted, favourable clinical responses have been reported, however, complete responses have been rare Citation[7]. Focus has now turned towards mechanisms of immune evasion, the tumor microenvironment and the Th1-immunosuppressive networks orchestrated by the tumor Citation[8]. Presently, tumor-associated regulatory T cells (Tregs) receive much attention in this context. Tregs are crucial for maintaining peripheral tolerance against self-antigens but have also been described as a main obstacle hindering successful immunotherapy Citation[9].
The most studied suppressor cell is the CD4+CD25+FoxP3+ Treg cell that can be further subdivided according to cytokine profile etc Citation[10], Citation[11]. Lately, it has become evident that effector T cells may transiently upregulate FoxP3. Since activated T cells express CD127, the CD4+Foxp3+CD127− population is considered to be the true Treg cell population Citation[12], Citation[13]. Several studies report an increased prevalence of Treg cells in the peripheral blood and tumor tissue of cancer patients Citation[14–19]. Increased Treg frequencies and tumor infiltration are correlated with reduced patient survival Citation[20–24]. Interestingly, in a study on five patients with medullary thyroid carcinoma the number of Treg cells was decreased prior immunotherapy with DCs loaded with tumor-specific antigens Citation[19]. In other trials, cytotoxic T lymphocyte antigen-4 (CTLA-4) blockade Citation[25–27], low-dose cyclophosphamide Citation[28] and the agent denileukin diftitox Citation[29] have all been used to target Tregs with a concomitantly enhanced clinical efficiency of anti-tumor immunotherapy.
Classical midgut carcinoids are well-differentiated neuroendocrine tumors arising from lower jejunum, ileum, caecum and ascending colon Citation[30]. They are typically associated with overproduction of serotonin and large liver metastases may give rise to the carcinoid syndrome characterized by flushes, diarrhea and heart valve fibrosis Citation[31]. The tumor has generally metastasized at the time of diagnosis, and surgery is seldom curative at that point. Medical therapy involving somatostatin analogues and interferon-α aim at relieving the symptoms of hormonal over-production and stabilize tumor progression Citation[32]. Recently, immunotherapy has emerged as a novel potential treatment for neuroendocrine malignancies Citation[6], Citation[33]. However, little is known about the immunological profile in these patients. Our work to develop an immunotherapeutic strategy for midgut carcinoid tumors Citation[34], Citation[35] prompted us to investigate the immunological status including the presence of Treg cells in these patients.
Material and methods
Patient material and healthy controls
Patients (n=68) diagnosed with midgut carcinoid tumor at the Department of Endocrine Oncology, Uppsala University Hospital, Uppsala, Sweden were included in the study. Peripheral blood was obtained during routine disease monitoring and 39 of the included patients were treated with interferon α (IFNα) at the time of blood sampling. Permission to collect blood was approved by the regional ethical review board (ref.no 2005:241) and informed consent was obtained from each patient. All patients demonstrated metastatic disease and were divided into two groups based on their tumor burden. The distinguishing criteria for a high tumor burden was≥5 liver metastases while patients with<5 liver metastases and/or local metastases in lymph nodes and mesentery and at extra-abdominal sites were considered to have a low tumor burden. Healthy blood donors (n=53) from Uppsala University Hospital Blood Center, Uppsala, Sweden were used as controls.
Isolation and purification of blood cells
Peripheral blood mononuclear cells (PBMCs) were obtained by means of ficoll density centrifugation (Ficoll-Paque PLUS, GE Healthcare, Uppsala, Sweden) according to the manufacturer's instructions. Lymphocytes were enriched by plastic adherence for 2 hours. CD25+ lymphocytes were enriched by magnetic-activated cell sorting (MACS) using CD25+ Microbeads (Miltenyi Biotech, Bergisch Gladbach, Germany) according to the manufacturer's instructions.
Regulatory T cell quantification
T cells expressing regulatory markers were quantified in patients and a group of healthy age-matched blood donors by surface staining of CD4-FITC and CD25-APC. Intracellular stainings of FoxP3 (APC/FITC) was performed with a kit from eBioscience (San Diego, CA, USA) with surface markers CD4-FITC or PerCP, CD25-APC, CD127-PE. Irrelevant isotype- and fluorescence-matched antibodies were used as controls and evaluated cells were gated on lymphocytes based on a forward and side scatter dot plot. All antibodies were from BD Biosciences (San Diego, CA, USA). Flow cytometry was performed on a FACS Calibur and FACS Canto (BD Biosciences).
Proliferation assays
T cell proliferation in response to stimulation with 1.5 µg/ml anti-CD3 antibody (OKT3 Orthoclone®, Janssen-Cilag, Cincinnati, OH, USA) and 50U/ml IL-2 (Proleukin®, Chiron, Emeryville, CA, USA) was measured using AlamarBlue™ (BioSource, Nivelles, Belgium) according to manufacturer's instructions. Absorbance was measured at 24 hour intervals. Ten thousand stimulated PBMCs from patients carrying a high tumor burden and normal lymphocyte counts (0.7–3.9×10⁹/L) were compared to PBMCs of healthy blood donors during 6 days of culture in RPMI 1640 supplemented with 10% FBS and 1% Penicillin-Streptomycin. All cell culture reagents were from Invitrogen (Carlsbad, CA, USA). Proliferation was measured similarly in the patient CD25+ and CD25− cell fractions, respectively. Inhibition of proliferation by the CD25+ lymphocyte fraction from patients were assayed by labelling healthy donor lymphocytes with carboxyfluorescein succinimidyl ester (CFSE) (Molecular Probes, Eugene, OR, USA) and stimulate them as described above. The CD25− and CD25+ patient lymphocyte fractions were irradiated at 40 Gy and added to the stimulated healthy donor lymphocytes in different ratios on a 96-well plate. Cells were cultured for 5 days with fresh media and additional IL-2 on day 3. Cell proliferation was evaluated by FACS (FACS Calibur, BD Biosciences).
Enzyme-linked immunosorbent Assay (ELISA)
Serum levels of transforming growth factor beta TGFβ were measured by ELISA (Biosource, Nivelles, Belgium) according to the manufacturer's instructions. TGFβ was measured in serum from 25 patients recently diagnosed with midgut carcinoid and prior to any interferon treatment. Serum levels of TGFβ from 8 healthy blood donors were measured for comparison.
Cytometric bead array (CBA)
Serum levels of interleukin-12p70, IL-1β, IL-10, IL-6, IL-8 were measured by CBA (BD Biosciences) according to the manufacturer′s instructions. Cytokines were measured in serum from 25 patients recently diagnosed with midgut carcinoid and prior to any interferon treatment and 18 healthy controls (10 healthy controls for IL1β).
Immunohistochemistry
Tumor infiltrating lymphocytes were investigated by immunohistochemistry on formalin-fixed paraffin-embedded material from ten midgut carcinoid patients using mouse anti-human CD4 (Novocastra, Newcastle, UK) and mouse anti-human CD8 (DAKO, Glostrup, Denmark) antibodies. Sections were de-paraffinized and epitope retrieval was performed by microwave treatment in 10mM Tris-EDTA, pH 9.0. Endogenous peroxidase was blocked using Peroxidase blocking solution. Tissue sections were allowed to incubate for 1 hour at RT with primary antibodies followed by DAKO Envision Peroxidase and AEC Substrate Chromogen. All chemicals were purchased from DAKO. Stainings were evaluated by a pathologist using an Olympus BX40 microscope. The level of infiltrating immune cells within the tumor area was graded according to negative (−), scattered, single positive cells (+), scattered, single positive cells and reactive inflammatory foci (++), lymph node metastases (+++), which also served as a positive control. Lymphocytes not present in the immediate tumor area were disregarded.
Immunofluorescence
Frozen acetone-fixed tissue sections from 10 midgut carcinoid patients were stained with mouse anti-human CD4-APC (BD Biosciences), goat anti-human FoxP3 (Novus Biologicals, Littleton, CO, USA) and donkey anti-goat Ig-AlexaFluor 488 (Molecular Probes, Eugene, OR, USA). A control isotype-matched mouse antibody conjugated to APC (BD Biosciences) and an irrelevant isotype-matched goat antibody (Jackson Immunoresearch Laboratories, West Grove, PA, USA) were used as controls. Immunofluorescence stainings were analyzed with a Zeiss 510 META confocal microscope at the Rudbeck Cell Analysis Core Facility.
Statistical evaluation
The results were statistically evaluated using Microsoft Analyseit by Excel. The methods of analyses were calculations of standard error of mean (SEM) and Student's t-test.
Results
Evaluation of the number of circulating Treg cells in patients with midgut carcinoid tumors
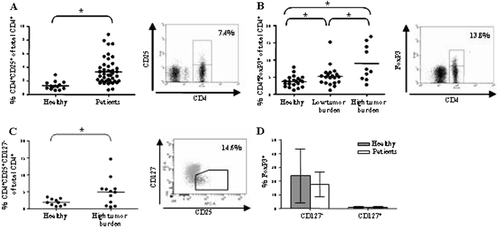
Peripheral blood collected from midgut carcinoid patients and healthy blood donors was subjected to ficoll density centrifugation and stained for Treg cell markers. CD4+CD25+ lymphocytes, expressed as percentage of total CD4+, proved more abundant in patients compared to healthy controls (t-test, p=0.0002). Patients had on average 3.3% CD4+CD25+ cells in comparison to 1.3% in healthy donors (A, left panel). An example is shown in the right panel of A. Intracellular staining of FoxP3 yielded even higher frequencies of Tregs, 6.5% in patients compared to 3.7% in healthy donors (t-test, p=0.0054). The patients were subdivided into two groups carrying a high or a low tumor burden. There was a significantly higher proportion Tregs in patients with a high tumor load, 9.0%, compared to patients with a low tumor burden, 5.2% (t-test, p=0.0166) (B, left panel). An example is shown in the right panel of B. Patients with a high tumor load were further analyzed regarding their CD4+CD25+CD127− cell population. The CD4+CD25+CD127− population was increased in patients compared to healthy controls, 4.9% versus 1.8% (t-test, p=0.0320) (C, left panel). An example is shown in the right panel of C. The CD127− population also contained a large fraction of FoxP3+ cells as opposed to the CD127+ population (D).
Figure 1. Midgut carcinoid patients display increased Treg prevalence in peripheral blood. Patients display increased Treg prevalence based on (A) CD4+CD25+ stainings (patients n=46, healthy n=14) (B) CD4+FoxP3+ stainings (patients n=30, healthy n=21) (C-D) CD4+CD25+CD127− stainings (patients n=12, healthy n=10) (p<0.05). Evaluated cells were gated on the lymphocyte population based on a forward and side scatter dot plot and percentages have been calculated based on the total CD4+ population. Individual values are shown as filled circles and the mean value is indicated with a line. Representative FACS plots are shown, in the right panels of A, B and C. (D) A significant fraction of the CD127− population is FoxP3+ positive in comparison to the CD127+ population both in patients and healthy controls. FoxP3+ cells are labelled black in the dot plot shown in C, compared to the grey Foxp3− cells.
In vitro estimation of the proliferative capacity of patient T cells
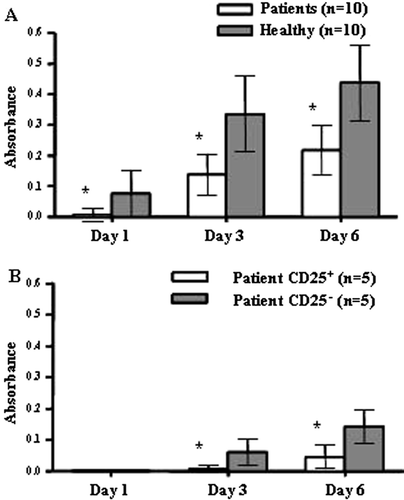
The proliferative T cell response to polyclonal stimulation was tested in 10 patients with a high tumor burden. All patients displayed normal lymphocyte counts and were compared to age-matched healthy donors. Peripheral blood mononuclear cells (PBMC) were stimulated using an anti-CD3 antibody (OKT3) together with IL-2 and proliferation was measured using AlamarBlue. Proliferation was measured continuously for 6 days and the results showed that patient T cells do not proliferate as well as healthy donors (A). Separating patient PBMCs into a CD25+ and CD25− fraction and measuring proliferation showed that the CD25+ fraction is highly resistant to polyclonal activation. The CD25− fraction remained suppressed compared to healthy donors even when the CD25+ fraction had been removed (B).
Figure 2. Patient PBMCs are less responsive to polyclonal T cell activation compared to healthy controls. (A) Patient PBMCs (n=10) proliferate poorly in response to polyclonal activation with OKT3 and IL-2 in comparison to healthy controls (n=10, p<0.02). Proliferation of triplicate samples was measured continuously for 6 days with AlamarBlue. Mean absorbance values at indicated days are plotted with SD. (B) The CD25+ fraction of patient lymphocytes are highly resistant to polyclonal stimuli. The CD25− fraction remains hyporesponsive after removal of the CD25+ population and do not reach mean values for healthy donors, shown in A. Mean absorbance values at indicated days for the CD25+ and CD25− populations from 5 patients are plotted with SD.
Functional analysis of patient Treg cells
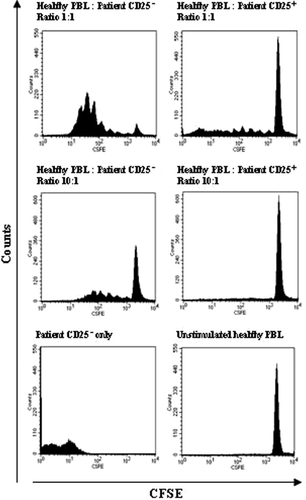
To validate whether the patient CD25+ fraction contains cells that are truly regulatory in nature, a proliferation test was performed using CFSE-labelled lymphocytes from a healthy donor. Labelled responder cells were stimulated with anti-CD3 antibody (OKT3) and IL-2 and patient CD25+ and CD25− lymphocytes were added in different ratios. The cells were cultured for 5 days before FACS evaluation of CFSE dilution. Labelled responder cells mixed with patient CD25− cells in a 1:1 ratio proliferated vigorously as opposed to cells mixed with patient CD25+ cells (). Labelled responder cells mixed with patient CD25+ cells displayed inhibited cell division and a CFSE fluorescence profile similar to unstimulated responder cells both at a 1:1 and 10:1 ratio. This experiment was repeated using blood from three patients and three healthy controls with the similar results. These results validate that patient CD25+ lymphocytes do contain cells with regulatory properties.
Figure 3. Patient CD25+ lymphocytes suppress allogeneic activation. CFSE-labelled healthy donor lymphocytes were mixed with the CD25+ and the CD25− cell fraction of patient lymphocytes in various ratios on a 96 well plate. The cells were cultured for 5 days when cell proliferation was determined by FACS analysis of CFSE dilution. Responder cells mixed with patient CD25− cells proliferated extensively while patient CD25+ cells suppressed proliferation down to 10:1 ratio. Cells were gated on the lymphocyte gate in a forward and side scatter dot plot and comparable numbers of gated events were counted for each ratio. The experiment was performed 3 times using blood from 3 healthy donors and 3 patients.
Evaluation of the systemic cytokine levels in cancer patients and healthy individuals
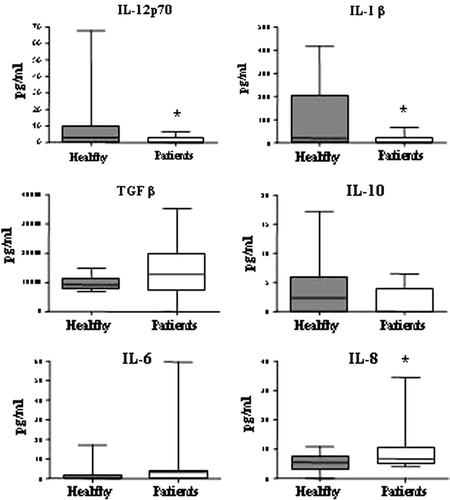
Serum levels of inflammatory and regulatory cytokines were analyzed in 25 patients with CBA and ELISA to make a general cytokine profile of these patients. Serum samples taken from patients were compared to serum from healthy controls (). The results show a systemic environment with a significant reduction in the important CTL-promoting cytokines IL-12p70 and IL-1β (t-test, p<0.05). The Treg-associated cytokine TGFβ was slightly increased, but not to a statistically significant degree. No differences were detected for IL-10 and IL-6. However, IL-8 was significantly increased in patients (t-test, p<0.05).
Figure 4. Patients present a systemic cytokine profile shifted from Th1 towards Th3. Serum levels of the cytokines IL-12p70, IL-1β, TGFβ, IL-10, IL-6 and IL-8 were measured by CBA and ELISA in patients (n=25) and healthy controls (n=18, IL-1β n=10, TGFβ n=8). There was a significant reduction in the pro-inflammatory cytokines IL-12p70 and IL-1β in patients (as indicated by asterisks) and a slight increase in TGFβ. IL-8 was significantly increased in patients compared to healthy controls. Data is displayed as box plots, all values are included and the box extends from the 25th to the 75th percentile with median value indicated.
Defining the presence of immune cells in biopsies from midgut carcinoid tumors
Infiltration of immune cells in the tumor area was determined by immunohistochemistry using anti-CD4 and anti-CD8 antibodies. Stained sections were evaluated and graded based on the presence of positive cells and reactive inflammatory foci inside the tumor area. The results show that these tumors are infiltrated both by CD4+ and CD8+ T lymphocytes with a tendency towards heavier infiltration in metastases compared to primary tumors. The complete evaluation of CD4+ and CD8+ T cell infiltration is presented in . Another set of frozen tumor specimens were used to detect presence of FoxP3+ expressing CD4+ cells in the tumor area with immunofluorescence. An initial staining with solely CD4+ revealed presence of CD4+ cells in 2 of 4 primary tumors and 4 of 6 metastases. These tumors were further stained with CD4+ and FoxP3+ and double-positive cells were detected in all cases. The complete evaluation of CD4+FoxP3+ T cell infiltration is presented in . Representative immunohistochemistry and immunofluorescence stainings are shown in .
Figure 5. Midgut carcinoids demonstrate lymphocyte infiltration including FoxP3+ cells. Presence of tumor infiltrating lymphocytes was detected by immunohistochemistry (n=10) and immunofluorescence microscopy (n=10). Inflammatory foci with CD4+ and CD8+ cells in the tumor area are shown at 20x magnification. A representative immunofluorescent staining of FoxP3+-expressing CD4+ cells, with CD4+ indicated by red and FoxP3+ by green, is also shown.
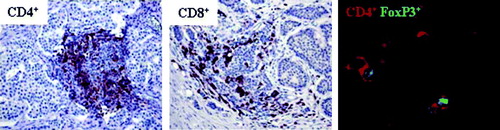
Table I. Tumor infiltrating CD4+ and CD8+ cells.
Table II. Tumor infiltrating CD4+FoxP3+ cells.
Discussion
Numerous reports have described cancer patients as immunosuppressed with high numbers of circulating and tumor infiltrating Tregs. Our data confirm this to be the case also for midgut carcinoid patients. Midgut carcinoid primary tumors develop in the gut, a TH1-suppressed environment, rich in Tregs and TGFβ Citation[36–38]. The tumors metastasize most commonly to mesentery and liver. Previous investigations indicate that midgut carcinoid tumors can produce TGFβ Citation[39–43] and the excessive serotonin synthesis by tumor cells can give rise to decreased systemic levels of tryptophan Citation[44]. Tryptophan is an essential amino acid that is the substrate for all serotonin synthesis within the CNS and the enteric system Citation[45]. Tryptophan can also be degraded by indoleamine 2,3 dioxygenase (IDO) along the kynurenin pathway and IDO-expressing APCs have been implicated in T cell suppression. Depletion of tryptophan has been shown to induce T cell anergy, and in combination with tryptophan catabolites, it may induce T cells with a regulatory phenotype Citation[46], Citation[47]. Decreased systemic levels of tryptophan could contribute to immunosuppression in midgut carcinoid patients. In our study, the levels of tryptophan in the patients were not investigated but preliminary data from reverse transcription PCR and microarray studies indicate that IDO mRNA is expressed in the midgut carcinoid tumor area (data not shown) and this might contribute to the increased systemic levels of Tregs seen in these patients. Midgut carcinoid patients displayed increased circulating levels of Tregs based on CD4+CD25+ and CD4+FoxP3+ staining. The differences proved statistically significant in relation to healthy donors. Treg frequency also increased with the tumor load. A group of patients carrying a high tumor burden, defined by 5 liver metastases or more had a significantly higher proportion FoxP3+ cells in peripheral blood compared to patients carrying a low tumor burden. There was no clear cut correlation between interferon treatment and high presence of Tregs, however patients with extremely high Tregs levels (>10% CD4+FoxP3+) cells were all receiving IFNα treatment. Additional experiments need to be performed to further discriminate between high tumor burden and interferon treatment. As previously shown by other investigators Citation[12], Citation[13] the FoxP3+ cells were mainly located in the CD4+CD25+CD127− cell fraction and there were no difference between patients and healthy donors in this regard. The cell population CD4+CD25+CD127− containing the highest proportion FoxP3+ cells was also increased in patients. A regulatory cell population primarily defined by cell surface markers could be of importance for sorting purposes.
Patient T cells were less responsive to polyclonal activation with OKT3 and IL-2 compared to healthy donors. Proliferation measured by AlamarBlue after stimulation was significantly lower among patients compared to healthy individuals. An explanation for this could be the high Treg content in patient blood. Separating patient PBMCs into CD25+ and CD25− cells revealed an extremely low proliferative capacity within the CD25+ cell fraction, while the CD25− cell fraction displayed higher proliferation. The CD25− cell fraction did, however, not reach the proliferative capacity seen in healthy individuals, suggesting that they remain in an anergized state. The most important characteristic of Tregs are their ability to suppress proliferation in other cells. By separating patient PBLs into CD25+ and CD25− cells and adding these populations to CFSE-labelled, OKT3-activated healthy donor lymphocytes the CD25+ cell fraction could effectively inhibit allogeneic proliferation while the CD25− cell fraction could not. This experiment proves that the CD25+ cell fraction contains cells with regulatory properties and an increased CD25+ population might lead to decreased T cell expansions in patients. Further, patients showed a tendency towards Th1-suppression based on the general cytokine profile in serum. The proinflammatory cytokines IL-12p70 and IL-1β were significantly reduced in patients and TGFβ was slightly increased. However, differences in cytokines may in general be difficult to detect systemically and might be more obvious in the tumor microenvironment.
An investigation of the tumor area revealed T cell infiltration in a majority of cases using CD4 and CD8 antibodies. T cells infiltrating the immediate tumor area were analyzed whereas T cells located in the outer surroundings were not considered. In general, metastases were more heavily infiltrated by T cells than primary tumors suggesting an activation of the immune system during tumor progression. Scattered cells and reactive foci appeared with both CD4 and CD8 stainings. Immunofluorescence with double staining of CD4 and FoxP3 revealed presence of Treg-like cells in all cases infiltrated by CD4+ cells. These tumor-infiltrating Tregs may contribute to suppression of infiltrating anti-tumor effector T cells.
Our analysis shows that patients with midgut carcinoid tumors are immunosuppressed with increased systemic prevalence of Tregs and Th1-suppressive cytokines. Patient T cells have decreased proliferative capacity and the tumor area shows infiltration of T cells in combination with Treg-like cells. This has to be considered when creating an immunotherapeutic strategy for this type of malignancy. In coming studies, different strategies to block immunosuppression by Treg cells will be investigated.
Acknowledgements
The authors would like to thank research nurses Monica Hurtig and Lena Olsson at the Clinic for Endocrine Oncology, Uppsala University Hospital for kindly providing patient samples. The authors would also like to thank Lisa H. Ekbom for laboratory assistance and Jan Grawé for excellent technical assistance with immunofluorescence microscopy. Finally, the authors would like to express their gratitude towards the Verto Institute and Dr. Raymond and Beverly Sackler for scientific and financial support.
References
- Renqvist N, Castelli C, Robbins PF, Parmiani G. A listing of human tumor antigens recognized by T cells. Cancer Immunol Immunother 2001; 50: 3–15
- Dudley ME, Wunderlich JR, Yang JC, Sherry RM, Topalian SL, Restifo NP, et al. Adoptive cell transfer following non-myeloablative but lymphodepleting chemotherapy for the treatment of patients with refractory metastatic melanoma. J Clin Oncol 2005; 23: 2346–57
- Morgan RA, Dudley ME, Wunderlich JR, Hughes MS, Yang JC, Sherry RM, et al. Cancer regression in patients after transfer of genetically engineered lymphocytes. Science 2006; 314: 126–9
- Tuettenberg A, Becker C, Huter E, Knop J, Enk AH, Jonuleit H. Induction of strong and persistent Melan A/MART-1-specific immune responses by adjuvant dendritic cell-based vaccination of stage II melanoma patients. Int J Cancer 2006; 118: 2617–27
- Small EJ, Schellhammer PF, Higano CS, Redfern CH, Nemunaitis JJ, Valone FH, et al. Placebo-controlled phase III trial of immunologic therapy with sipuleucel-T (APC8015) in patients with metastatic, asymptomatic hormone refractory prostate cancer. J Clin Oncol 2006; 24: 3089–94
- Stift A, Sachet M, Yagubian R, Bittermann C, Dubsky P, Brostjan C, et al. Dendritic cell vaccination in medullary thyroid carcinoma. Clin Cancer Res 2004; 10: 2944–53
- Ferrantini M, Capone I, Marincola FM, Parmiani G, Belardelli F. International meeting “Immunotherapy of cancer: Challenges and needs”. Cancer Immunol Immunother 2007; 56: 581–5
- Zou W. Immunosuppressive networks in the tumor environment and their therapeutic relevance. Nature Rev Cancer 2005; 5: 263–74
- Zou W. Regulatory T cells, tumor immunity and immunotherapy. Nat Rev Immunol 2006; 6: 295–307
- Wilczynski JR, Radwan M, Kalinka J. The characterization and role of regulatory T cells in immune reactions. Front Biosci 2008; 13: 2266–74
- Jonuleit H, Schmitt E. The regulatory T cell family: Distinct subsets and their interrelations. J Immunol 2003; 171: 6323–7
- Liu W, Putnam AL, Xu-yu Z, Szot GL, Lee MR, Zhu S, et al. CD127 expression inversely correlates with FoxP3 and suppressive function of human CD4+ Treg cells. J Exp Med 2006; 203: 1701–11
- Hartigan-O′Connor DJ, Poon C, Sinclair E, McCune JM. Human CD4+ regulatory T cells express lower levels of the IL-7 receptor alpha chain (CD127), allowing consistent identification and sorting of live cells. J Immunol Method 2007; 319: 41–52
- Woo EY, Chu CS, Goletz TJ, Schlienger K, Yeh H, Coukos G, et al. Regulatory CD4(+)CD25(+) T cells in tumors from patients with early-stage non-small cell lung cancer and late-stage ovarian cancer. Cancer Res 2001; 61: 4766–72
- Liyanage UK, Moore TT, Joo HG, Tanaka Y, Herrmann V, Doherty G, et al. Prevalence of regulatory T cells is increased in peripheral blood and tumor microenvironment of patients with pancreas or breast adenocarcinoma. J Immunol 2002; 169: 2756–61
- Sasada T, Kimura M, Yoshida Y, Kanai M, Takabayashi A. CD4+CD25+ regulatory T cells in patients with gastrointestinal malignancies. Cancer 2003; 98: 1089–99
- Miller AM, Lundberg K, Özenci V, Banham AH, Hellström M, Egevad L, et al. CD4+CD25high T cells are enriched in the tumor and peripheral blood of prostate cancer patients. J Immunol 2006; 177: 7398–405
- Loskog A, Ninalga C, Paul-Wetterberg G, de la Torre M, Malmström P-U, Tötterman TH. Human bladder carcinoma is dominated by T regulatory cells and Th1 inhibitory cytokines. J Urol 2007; 177: 353–8
- Papewalis C, Wuttke M, Jacobs B, Domberg J, Willenberg H, Baehring T, et al. Dendritic cell vaccination induces tumor epitope-specific Th1 immune response in medullary thyroid carcinoma. Horm Metab Res 2008; 40: 108–16
- Curiel TJ, Coukos G, Zou L, Alvarez X, Cheng P, Mottram P, et al. Specific recruitment of regulatory T cells in ovarian carcinoma fosters immune privilege and predicts reduced survival. Nat Med 2004; 10: 942–9
- Petersen RP, Carpa MJ, Sperlazza J, Conlon D, Joshi MB, Harpole DH, Jr, et al. Tumor infiltrating Foxp3+ regulatory T-cells are associated with recurrence in pathologic stage I NSCLC patients. Cancer 2006; 107: 2866–72
- Bates GJ, Fox SB, Han C, Leek RD, Garcia JF, Harris AL, et al. Quantification of regulatory T cells enables the identification of high-risk breast cancer patients and those at risk of late relapse. J Clin Oncol 2006; 24: 5373–80
- Kobayashi N, Hiraoka N, Yamagami W, Ojima H, Kanai Y, Kosuge T, et al. FOXP3+ regulatory T cells affect the development and progression of hepatocarcinogenesis. Clin Cancer Res 2007; 13: 902–11
- Badoual C, Hans S, Rodriguez J, Peyrard S, Klein C, Agueznay Nel H, et al. Prognostic value of tumor-infiltrating CD4+ T-cell subpopulations in head and neck cancers. Clin Cancer Res 2006; 12: 465–72
- Maker AV, Phan GQ, Attia P, Yang JC, Sherry RM, Topalian SL, et al. Tumor regression and autoimmunity in patients treated with cytotoxic T lymphocyte-associated antigen 4 blockade and interleukin 2: A phase I/II study. Ann Surg Oncol 2005; 12: 1005–16
- Phan GQ, Yang JC, Sherry RM, Hwu P, Topalian SL, Schwartzentruber DJ, et al. Cancer regression and autoimmunity induced by cytotoxic T lymphocyte-associated antigen 4 blockade in patients with metastatic melanoma. Proc Natl Acad Sci USA 2003; 100: 8372–7
- Hodi FS, Mihm MC, Soiffer RJ, Haluska FG, Butler M, Seiden MV, et al. Biologic activity of cytotoxic T lymphocyte-associated antigen 4 antibody blockade in previously vaccinated metastatic melanoma and ovarian carcinoma patients. Proc Natl Acad Sci USA 2003; 100: 4712–7
- Berd D, Mastrangelo MJ. Effect of low dose cyclophosphamide on the immune system of cancer patients: depletion of CD4+ 2H4+ suppressor-inducer T cells. Cancer Res 1988; 48: 1671–5
- Dannull J, Su Z, Rizzieri D, Yang BK, Coleman D, Yancey D, et al. Enhancement of vaccine-mediated antitumor immunity in cancer patients after depletion of regulatory T cells. J Clin Invest 2005; 115: 3623–33
- Åkerström G, Hellman P, Hessman O, Osmak L. Management of midgut carcinoids. J Surg Oncol 2005; 89: 161–9
- Van der Horst-Schrivers ANA, Machteld Wymenga AN, Links TP, Willemse PHB, Kema IP, de Vries EGE. Complications of midgut carcinoid tumors and carcinoid syndrome. Neuroendocrinology 2004; 80(Suppl 1)28–32
- Öberg K. Neuroendocrine tumors of the gastrointestinal tract: Recent advances in molecular genetics, diagnosis, and treatment. Curr Opin Oncol 2005; 17: 386–91
- Schott M, Seissler J. Dendritic cell vaccination: New hope for the treatment of metastasized endocrine malignancies. Trends Endocrinol Metab 2003; 14: 156–62
- Vikman S, Essand M, Cunningham JL, de la Torre M, Öberg K, Tötterman TH, et al. Gene expression in midgut carcinoid tumors: potential targets for immunotherapy. Acta Oncol 2005; 44: 32–40
- Vikman S, Giandomenico V, Sommaggio R, Öberg K, Essand M, Tötterman TH. CD8+ T cells against multiple tumor-associated antigens in peripheral blood of midgut carcinoid patients. Cancer Immunol Immunother 2008; 57: 399–409
- Chen W, Perruche S, Li J. CD4+CD25+ T regulatory cells and TGF-beta in mucosal immune system: The good and the bad. Curr Med Chem 2007; 14: 2245–9
- Allez M, Mayer L. Regulatory T cells: Peace keepers in the gut. Inflamm Bowel Dis 2004; 10: 666–76
- Weiner HL. The mucosal milieu creates tolerogenic dendritic cells and TR1 and TH3 regulatorycells. Nat Immunol 2001; 2: 671–2
- Zhang PJ, Furth EE, Cai X, Goldblum JR, Pascha TL, Min KW. The role of beta-catenin, TGF beta 3, NGF2, FGF2, IGFR2, and BMP4 in the pathogenesis of mesenteric sclerosis and angiopathy in midgut carcinoids. Hum Pathol 2004; 35: 670–4
- Wimmel A, Wiedenmann B, Rosewicz S. Autocrine growth inhibition by transforming growth factor β-1 (TGFβ-1) in human neuroendocrine tumor cells. Gut 2003; 52: 1308–16
- Zeutenhorst JM, Bonfrer JM, Korse CM, Bakker R, van Tinteren H, Taal BG. Carcinoid heart disease: The role of urinary 5-hydroxyindoleacetic acid excretion and plasma levels of atrial natriuretic peptide, transforming growth factor-beta and fibroblast growth factor. Cancer 2003; 97: 1609–15
- Chaudhry A, Funa K, Öberg K. Expression of growth factor peptides and their receptors in neuroendocrine tumors of the digestive system. Acta Oncol 1993; 32: 107–14
- Beauchamp RD, Coffey RJ, Jr, Lyons RM, Perkett EA, Townsend CM, Jr, Moses HL. Human carcinoid cell production of paracrine growth factors that can stimulate fibroblast and endothelial cell growth. Cancer Res 1991; 51: 5253–60
- Russo S, Boon JC, Kema IP, Willemse PH, den Boer JA, Korf J, et al. Patients with carcinoid syndrome exhibit symptoms of aggressive impulse dysregulation. Psychosom Med 2004; 66: 422–5
- Martinez A, Knappskog PM, Haavik J. A structural approach into human tryptophan hydroxylase and its implications for the regulation of serotonin biosynthesis. Curr Med Chem 2001; 8: 1077–91
- Munn DH, Mellor AL. Indoleamine 2,3-dioxygenase and tumor-induced tolerance. J Clin Invest 2007; 117: 1147–54
- Fallarino F, Grohmann U, You S, McGrath BC, Cavener DR, Vacca C, et al. The combined effects of tryptophan starvation and tryptophan catabolites down-regulate T cell receptor ξ-chain and induce a regulatory phenotype in naïve T cells. J Immunol 2006; 176: 6752–61