To the Editor
We appreciate Drs. Mavroidis and Lind's interest on our short article about the EUD concept Citation[1], and also appreciate their great effort in developing biological measures to evaluate the effectiveness of radiation plans in treating cancer patients Citation[2], Citation[3]. Biologically conformal radiation therapy is the ultimate goal of treating human cancer with radiation, and all various concepts and tools developed to achieve this goal should have great clinical value. In response to Drs. Mavroidis and Lind, we want to share our understanding and comments on the concept “biologically effective uniform dose ()” and its relation to EUD, as well as other concepts and arguments presented in their letter.
TCP: Binomial distribution vs. Poisson distribution
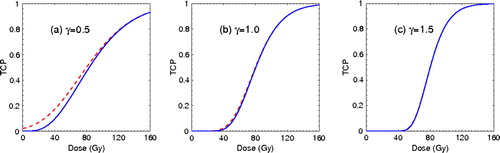
The Poisson distribution has been widely used in estimating the tumor control probability (TCP). We agree with Mavroidis and Lind that the Poisson statistics may not be accurate for TCP calculation in low dose regions; however, this difference only applies to tumors or tissues with rather flat dose response features. In this letter, we use an example with model parameters similar to those presented by Mavroidis and Lind in their letter and their paper Citation[3] to illustrate this point. shows the TCP curves with different dose response characteristics. While all curves are plotted with a D50 (dose to achieve a TCP of 50%) of 80 Gy and a fixed number of fractions, as used by Mavroidis and Lind, the dose response gradient γ at D50 is 0.5, 1.0, and 1.5 respectively. The solid curves and dashed curves represent the TCP results with Binomial distribution and Poisson distribution, respectively. As shown in , the difference in TCP values between the two models is minimal across the entire dose range when γ = 1, and it disappears almost completely when γ ≥ 1.5. However, for typical tumor and normal tissues, the dose response is fairly clear and the gradient γ is in the range of 2–4, similar to the example presented by Movroidis et al. ( in Citation[3]). Data compiled by Wigg Citation[4] indicate that the mean γ is 2.2 for tumors and 4.3 for normal tissues. The lower γ for tumors is due to tumor heterogeneity. When tumors are stratified by risk factors, the dose response curve becomes steeper, and the γ value approaches 3–4 or even higher Citation[5], Citation[6]. Therefore, the Poisson TCP model can provide reliable modeling of the clinical data in the therapeutic dose region, similar to the Binominal statistics Citation[7].
Figure 1. Dose response with two different statistics: Binomial distribution (solid curves) and Poisson distribution (dashed curves). The dose response gradients at D50 of 80 Gy are (a) γ = 0.5, (b) γ = 1.0, and (c) γ = 1.5 respectively.
Describing dose response: γ and N0
As Mavroidis et al. have shown Citation[3], the steepness of the dose response curve is described by parameter γ. For a radiation therapy schedule with a constant dose per fraction, γ is solely determined by the number of clonogen cells of the tumor or the normal tissue functional subunits, N0,1
Mavroidis and Lind used one example to illustrate different concepts. In that example, a gradient γ = 1 was selected, which is related to a very flat dose response curve as discussed above. The small γ corresponds to a N0 of only 15, which is a rather low number for tumor clonogens.
The number of clonogen cells in a tumor typically ranges from103 to 108Citation[4], Citation[8]. In the studies of the low α/β ratio for prostate cancer, Brenner et al. Citation[9], Citation[10] and Fowlor et al. Citation[11] indeed derived a very small N0 for prostate tumors. However, these modeling studies with such extremely low clonogen numbers were criticized by many other investigators Citation[6], Citation[12], Citation[13]. In a 2003 study, we analyzed the clinical data collected at MSKCC Citation[5] and derived a N0 of 1.6×10⁶, 3.0×10⁶, and 1.1×10⁷ for low, intermediate, and high risk patients respectively Citation[6]. These clonogen numbers indicate γ = 5.3, 5.5, and 6.0 respectively. In a letter to the editor of PMB Citation[14], we mentioned that the relatively flat dose response observed in the clinical data is generally masked by other uncertainties associated with the clinical setting, including patients’ risk heterogeneity, dose delivery, outcome definition, and inter-institution variations, etc. Well controlled data from a single institution, if stratified according risk factors, indeed demonstrate steep dose response with a γ value in range of 5–6 Citation[5], Citation[6].
As shown above, a low γ value of 1 might be necessary to demonstrate the TCP difference between the Binomial distribution and Poisson distribution, but it is very unusual and is associated with a very flat dose-response curve and an extremely low number of clonogens in a tumor.
Biological equivalence:  vs. EUD
Both the EUD and the have been proposed to illustrate the biological effect of various dose distributions with various radiation delivery schedules/modalities. According to Niemierko Citation[7], EUD is the dose that, when distributed uniformly across the target volume, results in the survival of the same number of clonogens. Similarly, as defined by Mavroidis et al. Citation[3],
is the uniform dose that results in exactly the same tumor control or normal tissue complication probability as the real dose distribution in a complex target or in the normal tissue of the patient. Based on their definitions, these two concepts are very similar except for the different biological/clinical endpoint used; according to current theory and understanding, the survival of the same number of clonogens/functional subunits in the target will lead to the same control probability if the target is a tumor, or to the same complication probability if the target is a normal tissue.
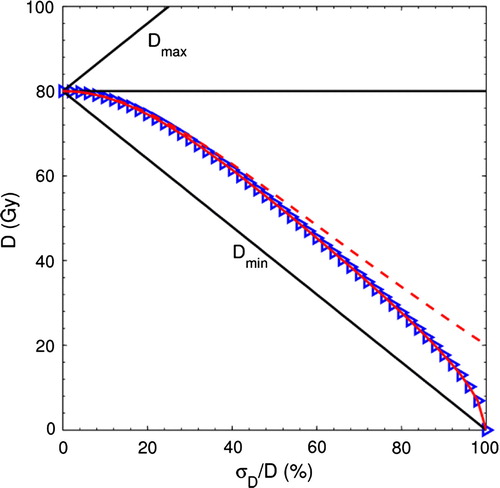
Mavroidis and Lind investigated the relationship between and EUD. In of their letter and Figure 6 in Citation[3], they showed that the two quantities began to diverge from each other at large dose inhomogeneity (σD/
>40%). We re-plotted the
and EUD as a function of dose inhomogeneity σD/
in ; however, we used both the Binomial distribution and the Poisson distribution to calculate EUD (solid curve with Binomial distribution and dashed curve with the Poisson distribution). We found that the EUD curve with Binomial distribution matched the
curve (triangles overlapped with the solid curve) exactly. Therefore the difference between
and EUD illustrated by Mavroidis and Lind is actually the difference between Binomial distribution and Poisson distribution. In his initial paper on EUD Citation[7], Niemierko indeed used the Poisson distribution for the EUD derivation, but there is no reason to limit the EUD concept by not using the Binomial distribution for outcome evaluation. When the same statistics are used in TCP calculation,
and EUD merge into the same concept that describes the biological equivalence of various dose distributions.
Figure 2. EUD and as a function of the dose inhomogeneity σD/
. The curves represent the EUD calculations with Binomial distribution (solid curve) and Poisson distribution (dashed curve). The
calculation is represented by the triangles, which overlap the solid curve.
DVH
Furthermore, we would like to clarify our understanding of the dose-volume histogram (DVH) used in the Mavroidis and Lind's examples ( of their letter). According to Mavroidis and Lind, the target is presumed to be divided into two equal parts that receive a dose of Dmin or Dmax. If this is the case, the differential DVH and cumulative DVH should be similar to the DVHs shown in , not the left-top DVH plot of shown in Mavroidis and Lind's letter (a similar plot can be found in the Figure 6 in Citation[3]). Here we present to help the reader understand the dose-volume relations used in those examples.
Figure 3. (a) Differential and (b) cumulative dose volume histograms (DVH) used in the example calculation.
In summary, and EUD are the same concept, which is useful to summarize the biological effect of various complex treatment plans. While outcome modeling with Binomial statistics may better estimate the TCP values at low dose regions for cases with a rather flat dose response (γ ≤ 1), Poisson statistics still provide reliable outcome estimates for radiation therapy in the clinical practice.
References
- Wang JZ, Mayr NA, Yuh WT. Behind EUD. Acta Oncol 2008; 47: 971–2
- Lind BK, Mavroidis P, Hyodynmaa S, Kappas C. Optimization of the dose level for a given treatment plan to maximize the complication-free tumor cure. Acta Oncol 1999; 38: 787–98
- Mavroidis P, Lind BK, Brahme A. Biologically effective uniform dose (D) for specification, report and comparison of dose response relations and treatment plans. Phys Med Biol 2001; 46: 2607–30
- Wigg DR. Plausible parameter values of normal tissues and tumors that may be used for predictive models and bioeffect planning. Applied Radiobiology and Bioeffect Planning. Medical Physics Publishing, Madison, WisconsinUSA 2001; 234–276
- Levegrun S, Jackson A, Zelefsky MJ, Skwarchuk MW, Venkatraman ES, Schlegel W, et al. Fitting tumor control probability models to biopsy outcome after three-dimensional conformal radiation therapy of prostate cancer: Pitfalls in deducing radiobiologic parameters for tumors from clinical data. Int J Radiat Oncol Biol Phys 2001; 51: 1064–80
- Wang JZ, Guerrero M, Li XA. How low is the α/β ratio for prostate cancer?. Int J Radiat Oncol Biol Phys 2003; 55: 194–203
- Niemierko A. Reporting and analyzing dose distributions: A concept of equivalent uniform dose. Med Phys 1997; 24: 103–10
- Wyatt RM, Beddoe AH, Dale RG. The effects of delays in radiotherapy treatment on tumour control. Phys Med Biol 2003; 48: 139–55
- Brenner DJ, Hall EJ. Fractionation and protraction for radiotherapy of prostate carcinoma. Int J Radiat Oncol Biol Phys 1999; 43: 1095–101
- Brenner DJ, Martinez AA, Edmundson GK, Mitchell C, Thames HD, Armour EP. Direct evidence that prostate tumors show high sensitivity to fractionation (low alpha/beta ratio), similar to late-responding normal tissue. Int J Radiat Oncol Biol Phys 2002; 52: 6–13
- Fowler J, Chappell R, Ritter M. Is alpha/beta for prostate tumors really low?. Int J Radiat Oncol Biol Phys 2001; 50: 1021–31
- King CR, Mayo CS. Is the prostrate alpha/beta ratio of 1.5 from Brenner & Hall a modeling artifact. Int J Radiat Oncol Biol Phys 2000; 47: 536–9
- Wang JZ, Li XA, Yu CX, DiBiase SJ. The low α/β ratio for prostate cancer: What does the clinical outcome of HDR brachytherapy tell us?. Int J Radiat Oncol Biol Phys 2003; 57: 1101–8
- Wang JZ, Stewart RD, Carlson DJ, Jennings K, Li XA, Guerrero M. Reply to ‘Comments on ‘Comparison of in vitro and in vivo α/β ratios for prostate cancer’ ’ [letter]. Phys Med Biol 2005; 50: L5–L8