Abstract
Purpose. To evaluate diffusion weighted magnetic resonance imaging (DWI) in liver and liver cancers during and following conformal radiotherapy (RT). To determine the feasibility of using changes in apparent diffusion coefficients (ADC) as a potential surrogate for tumour control or normal tissue injury. Materials and methods. Patients on a six-fraction conformal liver RT protocol underwent DW-MRI at the time of treatment planning, during RT (week one and two) and one month following RT. Diffusion weighted MR images were acquired in exhale breath hold, using b-values of 0 and 600. Regions of interest (ROIs) corresponding to maximal tumour dose, high-dose peri-tumour liver, irradiated normal liver, non-irradiated liver, and spleen were analyzed on ADC maps. Results. Eleven patients (four hepatocellular carcinoma, five liver metastases, two cholangiocarcinoma) were evaluated. The baseline median tumour ADC of 1.56×10⁻³mm2/sec increased to 1.89×10⁻³mm2/sec at RT week one, to1.91x10-3mm2/sec during week two and to 2.01×10⁻³mm2/sec at one month following treatment (p < 0.0001). Early increases in mean ADC were correlated with higher dose and sustained tumour response, whereas RECIST and volume changes on T2 images were not. Peri-tumour mean ADC also increased, from 1.40×10⁻³mm2/sec (baseline) to 1.55×10⁻³mm2/sec (RT week 2) and 1.64 × 10⁻³mm2/sec (follow-up). Small ADC changes were seen in the irradiated liver, and no significant changes were seen in the un-irradiated liver. Conclusions. Changes in tumour ADC were seen during RT. Larger increases were correlated with higher doses and increased likelihood of response.
Diffusion-Weighted MR Imaging (DWI) derives contrast from regional differences in mobility of water molecules and has been related to cytotoxic edema and necrosis in brain tissues Citation[1], Citation[2]. Diffusion co-efficients are not directly measured but are expressed as apparent diffusion co-efficients (ADC) in millimetres squared per second, measured on MR images. Early increases in ADC in metastatic liver tumours, breast cancers, spinal metastases and bone sarcomas can be seen following anti-cancer treatment, and have promise to be used as an early surrogate for long-term response Citation[3]. Although in each of these sites, the timing of evaluation appears to be important, as initial increases in ADC values best correspond to response when measured early (days to weeks) following treatment, and precede volumetric response measurements, the timing is variable amongst diagnoses, and treatment types Citation[4], Citation[5].
Changes in liver mean ADC have been observed in the absence of radiographic response to chemo-embolization, chemotherapy or hepatic arterial delivery of 90-Yttrium microspheres Citation[6–9]. If meaningful changes in tumour or normal tissue response could be measured early in a course of radiotherapy, the potential exists for adaptation to the change, possibly improving the therapeutic ratio. This would only be useful if early changes were related to clinically relevant long-term outcomes, and could be of particular significance for liver cancer radiation therapy (RT), where many patients are not cured and liver toxicity is a possibility; i.e. it is desirable to determine early who is more likely to respond to RT and who is not.
DWI has long been used to evaluate intracranial diseases and detect early or subtle changes within the brain before any visible abnormality can be seen on conventional morphological imaging Citation[7], Citation[9]. With developments in MR technology, such as echo-planar imaging (EPI), high-gradient amplitudes, multi-channel coils and parallel imaging, it has been possible to extend the applications of DWI extra-cranially.
As described by Hamstra Citation[3] and others, an increase in ADC suggests a loss of cellular membrane integrity or an increase in extra-cellular fluid with corresponding decrease in cellular size and/or number, such as in necrosis or apoptosis. As such, if necrosis represents tumour death (i.e., treatment response), DWI may have a role as an early indicator of pathologic, radiographic or clinically relevant endpoints Citation[3]. Changes in ADC of liver and metastatic breast cancers can precede or be observed in the absence of traditional radiographic response to chemotherapy, chemo-embolization or targeted liver radiotherapy using yttrium-90 microspheres Citation[4], Citation[10–13]. ADC changes are generally not seen in untreated lesions, non-tumour bearing liver and normal tissues (spleen, skeletal muscle) following chemo-embolization Citation[4]. Some studies have demonstrated correlations between ADC changes and ultimate tumour response, suggesting ADC changes may be useful as an early predictor of response and long-term tumour control.
This paper investigates the feasibility of using DWI and ADC maps to assess and predict normal tissue and liver cancer response to hypofractionated conformal radiation therapy (RT). For the tumour and peri-tumour region, we hypothesized that larger changes in ADC would be associated with an increased chance of long-term control. For the liver itself, we hypothesized that a dose dependent relationship with ADC change would be observed.
Material and methods
Patients with unresectable liver cancer treated on an institutional research ethics board (REB) approved six-fraction, conformal RT study were offered participation in a REB approved companion DWI study. DW images were planned to be acquired at the time of RT planning (baseline), week one and week two of treatment, and one month following completion of RT.
Patients
Eligible patients had unresectable primary or metastatic liver cancer, liver enzymes <six-fold higher than the upper limit of normal, Child-Pugh liver score A, >800cc normal liver, and no MRI contra-indications. It was anticipated that 20 patients would be enrolled in this imaging study; however, accrual was halted at 14 due to challenges in imaging analysis and patient recruitment (e.g., scheduling conflicts, unsuitable breath-holding abilities, and withdrawal from study prior to follow-up imaging).
Liver radiotherapy
RT planning included simulations (fluoroscopy, MRI and/or 4DCT) to evaluate liver motion due to breathing and screening patients for suitability of treatment with repeat exhale breath holds using Active Breathing Co-ordination (ABC) Citation[14], Citation[15]. All treatment planning was performed using contrast enhanced CT imaging and whenever feasible, patients were treated in ABC exhale breath hold with a uniform planning target volume (PTV) margin of 5 mm. If ABC breath hold was not feasible, individualized PTVs based on breathing motion were used and the patient was treated in free breathing. Dose was individualized based on the effective liver volume (Veff) treated, as previously described Citation[14]. The mean (range) prescription dose was 43.9 Gy (28.8 to 54 Gy) in 6 fractions delivered over two weeks. RT was delivered under daily image guidance with patient repositioning for all offsets >3 mm.
Patient follow-up
Patients were followed after RT at 1, 3, 6, and 12 months, then every 6 months for three years and annually after that. Dynamic contrast enhanced computed tomography (CT) scans were obtained at each follow-up. Tumour control was evaluated using RECIST criteria at the time of each follow-up scan.
MRI technique
Patients were imaged in voluntary end-exhale breath hold in a single acquisition, using a 1.5 T MRI scanner (Excite HD; GE Healthcare. Milwaukee, WI) and a four-channel phased array torso coil. The imaging protocol consisted of: breath hold DW echo planar images using a matrix size 128×128; slice thickness 8 mm; inter-slice gap, 0 mm; b-value 0 and 600 s/mm2; optimized TE (range 67.8, 96.8) and TR (range 3000, 3775); receive bandwidth, 62.5 kHz; 2 NEX; maximal field of view (FOV) (37.9–43.8 cm). T2-weighted fast spin-echo fat saturated images were also obtained with the following parameters: matrix size 256×160; slice thickness 6 mm, inter-slice gap, 0 mm; TE 90 ms, TR 3 000 ms; receive bandwidth 31 kHz; 1 NEX. All diffusion weighted image acquisitions were performed using b = 0 (the T2 component) and a second b-value (b = 600, s/mm2) so that the average diffusion co-efficient was calculated from each pair of b-value of 0 and non-zero values resulting in multiple ADC measurements for a given location. DWI acquisition time was approximately 22 s with 14 to 22 slices acquired encompassing the liver tumour and as much liver as possible during a single breath hold. demonstrates typical baseline imaging. Exhale breath hold was selected for all imaging to maintain a liver position consistent with RT planning. Advantages of using breath hold DWI are retention of good anatomical detail as images are not degraded by respiratory motion or volume averaging, making it feasible to localize small lesions Citation[8]
Figure 1. Typical Baseline Imaging. Top Row: Baseline T2 (A), DWI b300 (B) and DWI b600 (C). Images obtained with exhale breath-hold through same axial region of the tumour. Bottom Row: Typical ROI selection in tumour, peri-tumour and irradiated liver on ADC map (D), gadolinium enhanced T1 (E), contrast enhanced planning CT with (F) dose map. Gross tumour volume and planning target volume shown on T1 MRI and CT in blue and pink contours respectively.
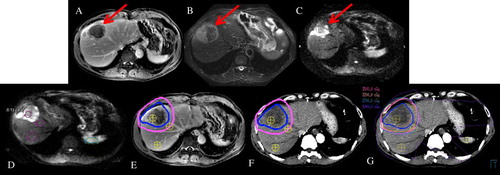
Image analysis
ADC maps were calculated in Advantage Windows Workstation (v 4, GE Medical Healthcare) using a two-point fit with b-value of 0 s/mm2. Although an attempt was made to acquire multiple b-values including either 300 or 1 000 for all patients, for a multi point linear fit, image quality was limited and the analysis was performed at b-values of 0 and 600 s/mm2.
Tumour measurements
Using a radiation treatment planning system, gross tumour volumes (GTV) were delineated on T2 images in the treatment planning system (ADAC Pinnacle v. 7.6, Milpitas, CA) so that volume and diameter measurements could be evaluated using T2 imaging at all available time points, and compared to the changes in ADC at each time point. To validate volume assessments on T2 imaging, baseline T2 volume and largest diameter measurements were compared to baseline contrast-enhanced CT and contrast-enhanced T1wMRI measurements (used for GTV delineation and for response monitoring in the clinic).
Regions of interest selection
Five ovoid regions of interest (ROI) of approximately 1 cm in diameter were delineated on axial slices of the planning CT in the treatment planning system. The ROIs included the high dose irradiated tumour, peri-tumour (treated to doses similar to the prescription dose), normal liver receiving moderate doses, normal liver receiving <8 Gy, and the spleen. Given the spleen was not irradiated, it was selected to serve as a normal control within a given patient for intra-patient comparison.These ROIs were subsequently delineated on the ADC map in the Advantage Windows workstation, using a manual visual image registration and anatomical landmarks such as vessel bifurcations to localize the ROIs on each image. ROIs were correlated visually in side-by-side windows and compared between the planning CT, the T2, DWI b-600 and ADC map for each imaging session. ROIs were chosen to minimize artefacts, image distortions, bile ducts and blood vessels in all serial images ().
To ensure intra- and inter-observer variability did not exceed the imaging noise, repeat ROI placement and ADC measurements were repeated four times in three patients; once to attempt to reproduce ADC measurements and ROI placements between two users in three patients, and thrice to confirm reproducibility of ADC measurements and ROI placement for a single user.
Dose determination
The mean dose delivered to each ROI at each time point was calculated in the treatment planning system. The mean ADC values in each of the five ROIs at each time point were compared to baseline ADC values. shows typical ROI placement.
Statistical analysis
The statistical analysis was completed using SAS v.9.1 (SAS Institute Inc., Cary, NC). All tests were two-sided and the alpha was 0.05. The change in mean ADC over time was examined for all ROIs using linear mixed models. Mixed models were used to account for repeated measures on individual patients. A compound symmetry variance was used and time was treated as a categorical variable. ADC values for the tumour, peri-tumour, irradiated liver, non-irradiated liver and spleen were assessed using Pearson correlation coefficients to compare ADC change from baseline. Similar analyses were conducted to evaluate gross tumour volume (GTV) change and RECIST change on T2 MR images obtained at the same time points as the ADC imaging. Correlations were also used to evaluate the relationship between the GTV (delineated on a contrast enhanced planning CT) and change in mean ADC as well as the dose-response relationship for the tumour and the liver.
Results
Patients
Accrual was halted after 14 patients were entered into this feasibility study. Of these 14 patients planned for liver RT between August 2005 and February 2007 three were excluded because they did not have sufficient imaging obtained (n = 2) or due to an error in image acquisition (n = 1). It was decided that in order to be evaluated patients should undergo a minimum of three imaging sessions: baseline plus a minimum of two (n = 3) or three (n = 8) time points during and/or after RT. The 11 patients with sufficient imaging are the focus of this paper. Four patients had hepatocellular carcinoma (HCC), five patients liver metastases and two cholangiocarcinoma. All patients had tumours located in the right lobe and the average reproducibility of ADC measurements was small, with a maximal difference of 11%.
At the time of treatment planning, week one and two during RT and one month post RT, DWI datasets using b = 0 and b = 600 were obtained. Using day one of radiation as t = 0, baseline images were acquired at a median (range) of −13 days (−8, −32), week one six days (0, 11), week two, 11 days (7, 14) and one month, 44 days (32, 64) from t = 0 respectively. Week one refers to treatments one to three, and week two refers to treatments four through six which were delivered over alternate days. Population changes in mean ADC values for irradiated and non-irradiated ROIs at baseline, week one and two of treatment and one month post RT are shown in .
Figure 2. Plots demonstrating population mean ADC values for irradiated and non-irradiated ROIs at baseline, week one, week two and follow-up.
Normal tissue results
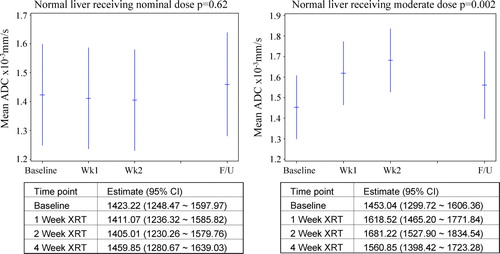
In addition to using non-irradiated spleen as a control, two liver ROIs were selected for each patient, to explore the possibility of a dose-response of DWI MR in the liver; one in (non-tumour) liver that received substantial dose (>24 Gy in 6 fractions) and one that received low dose (<8 Gy, in 6 fractions). Statistically significant changes in mean ADC from baseline occurred only in irradiated normal tissues. A significant increase in the ADC was seen in the ROI representing the irradiated liver (p = 0.002). The largest increase occurred during the first week of RT, and levelled off towards week two with a return to near baseline valued one month following radiotherapy (). Changes in the spleen and un-irradiated normal liver were not significant (p = 0.54 and p = 0.62 respectively).
Figure 3. Population mean ADC values for normal liver receiving nominal (<8Gy) and moderate (>8Gy) doses of radiotherapy.
Tumour results
The tumour and peri-tumour ROI demonstrated statistically significant increases in mean ADC at each time point (p-value < 0.0001 and 0.03 respectively) (). Correlations between total dose delivered to the tumour and mean ADC values for the entire population were strong and statistically significant at one-month post RT (r = 0.73, p = 0.04). Details of the patient mean tumour and peri-tumour doses and percent change in mean ADC are shown in . Early increases in mean tumour ADC from baseline were associated with local control (). demonstrates the relationship between the prescribed tumour dose and the change in mean tumour ADC from baseline for all patients. Using this information patients were divided into three groups: “responders” (patients with partial and complete in-field RECIST responses at most recent follow-up, based on contrast enhanced (CE) CT imaging; n = 4), “stable” (patients with stable in-field responses; n = 5), and “progressors” (progressive disease in-field responses; n = 2). The median follow-up time was nine months (range 1.5–36 months). The “responders” had larger week one changes in tumour mean ADC compared to “stable” and “progressors” over all time points ().
Figure 4. Population mean ADC values for irradiated tumour and peri-tumour ROIs.
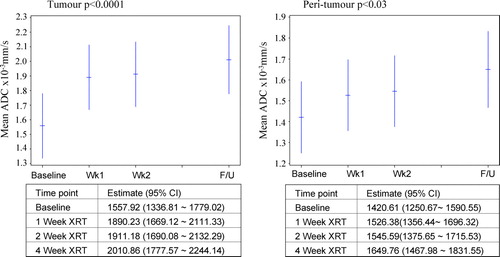
Figure 5. Change in mean ADC values from baseline to each subsequent imaging session, relative to delivered dose to tumour region at the time of imaging. Responders (R) shown in solid black, patients with stable disease (S) shown in solid grey, and patients with progressive disease (P), shown as open shapes.
Table I. Percent change in mean ADC for patients at all time points for tumour and peri-tumour.
Table II. Correlation and significance of delivered tumour dose and change in mean ADC (all patients).
All patients, demonstrated an initial rise in mean tumour ADC from baseline to week one. At week two, 10/11 patients continued to have increases in mean ADC within their tumours (). Two patients (1 and 11, both responders) continued to have large changes in ADC at one month post-treatment within the tumour. The magnitude of mean tumour ADC change was correlated with dose delivered (r = 0.76, p < 0.03).
Contrast enhanced MR imaging was not performed following the baseline imaging, and as such tumour RECIST response was challenging to document at each time point. The baseline tumour volume demonstrated a weak negative correlation with ADC change following treatment (r = -0.65, p = 0.08) (), suggesting smaller tumours may respond better to treatment. Because prescription doses were based on the effective liver volume irradiated, baseline tumour volumes and RT dose were correlated, with smaller tumours receiving greater doses ().
Figure 6. Dose versus baseline tumour volume (left). Mean ADC at baseline (solid) and in follow-up (open square) versus baseline tumour volume (right).
Table III. Correlation between tumour volume at baseline with mean change in ADC.
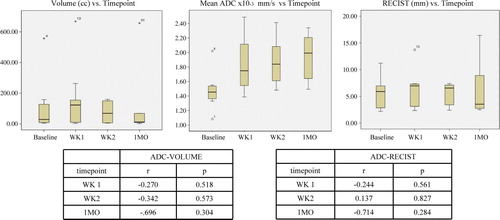
In contrast to ADC changes seen early during RT, there were no significant changes or trends in RECIST response or volumetric response of tumours assessed using T2 MRI at the same time points when ADC measurements were made, as seen in . Negative correlations between tumour volume and RECIST response to ADC were seen at most time point and were not statistically significant (). Strong correlations between GTV were seen on T2 imaging with T1 contrast enhanced MRI measurements (r = 9.97, r = 0.98) and with contrast enhanced CT imaging (r = 0.98, r = − 0.97) were seen, validating the use of T2 tumour response assessment at these time points (since contrast CT or MR was not available at these time points for GTV response assessment).
Figure 7. Box plots demonstrating population changes in ADC, tumour volume and RECIST measurements (as measured on T2 images) over time.
Discussion
DWI provides qualitative and quantitative insight into tumour characteristics, and has the potential to predict response to cancer therapy. Our preliminary experience in primary and metastastic liver cancers suggests early increases in tumour mean ADC are correlated with eventual response to radiation treatment and is in keeping with the results of others Citation[3], Citation[10], Citation[12], Citation[13]. When compared to baseline, the greatest early increase in tumour mean ADC was seen during the first week of RT. Other authors have seen increases in ADC as early as 4–11 days post start of anti-cancer treatments Citation[10], Citation[11], Citation[13]. Theilman et al. investigated the relationship between lesion sizes at baseline with response predicted by changes in mean ADC Citation[10]. There was a trend towards smaller lesions having larger changes in ADC, similar to our findings.
The novelty of this study is the potential use of functional MRI as a non-invasive, radiation-free method of assessing radiotherapy response early, before it is clinically obvious using standard imaging at the same time points. This study shows that dose dependent change in ADC occurs in tumours. A significant dose dependent response in the irradiated liver was not observed. If further studies validate that the ADC response is related to eventual long-term tumour control, DW-MRI could be used as an early imaging bio-marker for tumour control detected earlier than standard RECIST response.A strength of this study is that all patients were imaged in exhale breath hold to maximize reproducibility of the liver shape and position, and 8 of 11 were treated in exhale controlled breath hold liver immobilization Citation[16]. The use of breath hold, daily image guidance and repositioning for offsets increases the concordance of RT planned and delivered doses, compared to non breath hold, non image guided radiotherapy Citation[17]. Little is available in the literature on DWI response of normal tissues to RT Citation[18]. We investigated whether a dose-response in ADC may exist in the irradiated liver that could be used as a measure of a ‘bio effect”, possibly related to long-term injury. As expected, the irradiated liver showed some response although not as great in magnitude as the tumour response, with no statistically significant dose response observed. The un-irradiated liver (< 8 Gy in 6 fractions) showed little change in ADC during and following RT.
Limitations of this study are the small patient population, and the selection of only five ROIs at each time point per patient. The use of volumetric analysis, which was not available at our institution at the time this work was undertaken, would have enabled, multiple sampling of more regions using multiple b-values, in more patients could possibly demonstrate a more significant ADC dose effect in the irradiated liver. Furthermore, three-dimensional measurements of ADC would allow more sampling across more regions, to increase the power to detect a dose response if one exists. Three-dimensional ADC measurements combined with deformable image registration should strengthen future studies of ADC change in serial imaging post therapies that may lead to liver deformation (e.g., radiation therapy) Citation[19].
As this is a small study, with large variation among the measured ADC values at baseline and follow-up, it is difficult to ascertain from this small cohort, whether these variations indicate the results are representative of groups of individuals (most likely) rather than individual patients (less likely). The groups of individuals may be represented by diagnosis, tumour burden or underlying liver disease. As such further investigation as to the cause of this variability are warranted, but were beyond the scope of this project. Future work to validate these preliminary findings should include greater numbers of patients categorized by diagnosis, and with more tightly maintained time-lines with smaller spans in the timing of the evaluations.
In addition to un-irradiated liver, the un-irradiated spleen was chosen as a control for normal tissue. However, some variation in the diffusion of the spleen between patients due to alterations in portal flow and portal venous hypertension is possible. It is also possible that radiation induced changes in the liver or tumour response could cause some alteration in portal venous flow changing the ADC of the spleen.
The use of breath hold immobilization is a challenge also since it limits the number of b-values that can be acquired over the duration of the image acquisition, resulting in poorer signal to noise compared to multiple averaging methods, and greater sensitivity to pulsatile and susceptibility artefacts (from air in stomach or colon) Citation[8]. Limitations not unique to this study include the inherently noisy nature of DW imaging, spatial and temporal heterogeneous nature of the tumour microenvironment that may result in summary statistics (mean ADC) inadequately reflecting lesion heterogeneity, and that little is known about the reproducibility of DWI measurements. Kim et al. Citation[20] and Koh et al. Citation[8] described the challenges associated with appropriate b-value selection in extra-cranial DW imaging, as selecting values too low will overestimate, and selecting values too high will underestimate the ADC of liver tumours due to their sensitivity to motion. Although recognized as challenges potentially limiting the interpretation of DWI results, a complete discussion of these technical imaging aspects are however, beyond the scope of this preliminary analysis.
It is not known if the radiographic tumour responses in this study will lead to permanent local control, but at last follow-up the “responding’ patients had continued in-field response at 19, 24, 28 and 32 months post RT. It is also unclear if the early changes in tumour ADC were related to delivered dose or likelihood of response, since dose and response were correlated. These preliminary results are in keeping with the literature Citation[3–5], Citation[10–13], Citation[21–25], suggesting DW imaging may be a useful tool in the prediction of long-term tumour response to anti-cancer therapy. Initial increases in mean ADC in irradiated tissues (e.g., at week one of RT) may be the result of early epithelial apoptosis and/or a preliminary inflammatory response to the radiation.
This is the first report of DWI changes in patients with primary and metastatic liver cancers observed in liver tumours and irradiated liver, early during a course of RT, with a suggestion that these changes are associated with long-term response.
Acknowledgements
Presented in part at the Canadian Association of Radiation Oncology Annual Scientific Meeting MRI in Radiation Oncology Symposium, October 10, 2007, Toronto. Patients evaluated were treated on clinical protocols funded in part by the Canadian Cancer Society, Varian and Elekta Oncology Systems. The authors gratefully acknowledge Anna Kirilova, Maria Hawkins and Mark Lee for their valuable input regarding this research. Declaration of interest: The authors declare that there are no known conflicts of interest. Should new information arise indicating otherwise, notification will be provided.
References
- Le Bihan D, Breton E, Lallemand D, Grenier P, Cabanis E, Laval-Jeantet M. MR imaging of intravoxel incoherent motions: Application to diffusion and perfusion in neurologic disorders. Radiology 1986; 161: 502–7
- Sorensen AG, Wu O, Copen WA, Davis TL, Gonzalez RG, Koroshetz WJ, et al. Human acute cerebral ischemia: Detection of changes in diffusion anisotropy by using MR imaging. Radiology 1999; 212: 785–92
- Hamstra DA, Rehemtull A, Ross BD. Diffusion magnetic resonance imaging: A biomarker for treatment response in oncology. J Clin Oncol 2007; 25: 4104–9
- Gillies RJ, Raghunand N, Karcamar GS, Bhujwall ZM. Noninvasive imaging of anticancer therapy. Mol Cancer Ther 2003; 2: 333–4
- Mardor Y, Pfeffer R, Spieglemann R, Roth Y, Maier SE, Nissim O, et al. Early detection of response to radiation therapy in patients with brain malignancies using conventional and high b-value diffusion-weighted magnetic resonance imaging. J Clin Oncol 2003; 21: 1094–100
- Salem R, Thurston KG, Carr BI, Goin JE, Geschwind JF. Yttrium-90 microspheres: Radiation therapy for unresectable liver cancer. J Vasc Interv Radiol 2002; 13: S223–S229
- Yoshikawa K, Nakata Y, Yamada K, Nakagawa M. Early pathological changes in the parkinsonian brain demonstrated by diffusion tensor MRI. J Neurol Neurosurg Psychiatry 2004; 75: 481–4
- Koh D-M, Collins DJ. Diffusion-weighted MRI in the body: Applications and challenges in oncology. Am J Radiol 2007; 188: 1622–35
- Eastwood JD, Lev MH, Wintermark M, Fitzek C, Barboriak DP, Delong DM, et al. Correlation of early dynamic CT perfusion imaging with whole-brain MR diffusion and perfusion imaging in acute hemipheric storke. Am J Neuroradiol 2003; 24: 1869–75
- Theilmann RJ, Borders R, Trouard TP, Xia G, Outwater E, Ranger-Moore J, et al. Changes in water mobility measured by diffusion MRI predict response of metastatic breast cancer to chemotherapy. Neoplasia 2004; 6: 831–7
- Pickles M, Gibbs P, Lowry M, Turnbull LW. Diffusion changes precede size reduction in neoadjuvant treatment of breast cancer. Magn Reson Imaging 2006; 24: 843–7
- Kamel IR, Reyes DK, Liapi E, Bluemke DA, Geschwind J-FH. Functional MR imaging assessment of tumor response after 90Y microsphere treatment in patients with unresectable hepatocellular carcinoma. J Vasc Interv Radiol 2007; 18: 49–56
- Kamel IR, Bluemke DA, Eng J, Liapi E, Messeremith W, Reyes DK, et al. The role of functional MR imaging in the assessment of tumor response after chemoembolization in patients with hepatocellular carcinoma. J Vasc Interv Radiol 2006; 17: 505–12
- Dawson LA, Eccles C, Craig T. Individualized image guided iso-NTCP based liver cancer SBRT. Acta Oncol 2006; 45: 856–64
- Wong JW, Sharpe M, Jaffray DA, Kini VR, Robertson JM, Stromberg JS, et al. The use of active breathing control (ABC) to reduce margin for breathing motion. Int J Radiat Oncol Biol Phys 1999; 44: 911–9
- Eccles CL, Craig T, Dawson LA. Estimated dosimetric impact of IGRT in liver SBRT with ABC ABSTRACT. ECJ Supplements 2007; 5: 125–6
- Eccles C, Brock K, Bissonnette J-P, Hawkins MA, Dawson LA. Reproducibility of liver position using active breathing control for liver cancer radiotherapy. Int J Radiat Oncol Biol Phys 2006; 64: 751–9
- Studer, G, Kirilova, A, Jaffray, D, Dawson, LA, Lockwood, G, Bayley, A, , et al. Major salivary gland function: Diffusion-weighted MRI (SWI) assessment before, during and after radiation therapy. Int J Radiat Oncol Biol Phys 2005;Suppl:S361, Abstract.
- Brock KK, Dawson LA, Sharpe MB, Moseley DJ, Jaffray DA, et al. Feasibility of a novel deformable image registration technique to facilitate classification, targeting, and monitoring of tumor and normal tissue. Int J Radiat Oncol Biol Phys 2006; 64: 1245–54
- Kim B, Boes JL, Bland PH, Chenevert TL, Meyer CR. Motion correction in fMRI via registration of individual slices into an anatomical model. Magnet Reson Med 1999; 41: 964–72
- Ross BD, Moffat BA, Larwence TS, Mukherji SK, Gebarski SS, Quint DJ, et al. Evaluation of cancer therapy using diffusion magnetic resonance imaging. Mol Cancer Ther 2003; 2: 581–7
- Deng J, Miller FH, Rhee TK, Sato KT, Mucahy MF, Kulik LM, et al. Diffusion-weighted MR imaging for determination of hepatocellular carcinoma response to Yttrium-90 radioembolization. J Vasc Interv Radiol 2006; 17: 1195–200
- Vossen JA, Buijs M, Kamel IR. Assessment of tumor response on MR imaging after locoregional therapy. Tech Vasc Interventional Rad 2006; 9: 125–32
- Hayashida Y, Yakushiji T, Awai K, Katahira K, Nakayama Y, Shimomura O, et al. Monitoring therapeutic response of primary bone tumors by diffusion-weighted image: Initial results. Eur Radiol 2006; 16: 2637–43
- Tomura N, Narita K, Izumi J, Suzuki A, Anbai A, Otani T, et al. Diffusion changes in a tumor and pertumoral tissue after stereotactic irradiation for brain tumors: Possible prediction of treatment response. J Comput Assist Tomogr 2006; 30: 496–500