
 ?Mathematical formulae have been encoded as MathML and are displayed in this HTML version using MathJax in order to improve their display. Uncheck the box to turn MathJax off. This feature requires Javascript. Click on a formula to zoom.
Abstract
Purpose
To explore the potential benefit and complementary value of a multiparametric approach using diffusion-weighted (DW-) and dynamic contrast-enhanced (DCE-) magnetic resonance imaging (MRI) for prediction of response to neoadjuvant chemoradiotherapy (nCRT) in esophageal cancer.
Material and methods
Forty-five patients underwent both DW-MRI and DCE-MRI prior to nCRT (pre), during nCRT (week 2–3) (per) and after completion of nCRT, but prior to esophagectomy (post). Subsequently, histopathologic tumor regression grade (TRG) was assessed. Tumor apparent diffusion coefficient (ADC) and area-under-the-concentration time curve (AUC) were calculated for DW-MRI and DCE-MRI, respectively. The ability of these parameters to predict pathologic complete response (pCR, TRG1) or good response (GR, TRG ≤ 2) to nCRT was assessed. Furthermore the complementary value of DW-MRI and DCE-MRI was investigated.
Results
GR was found in 22 (49%) patients, of which 10 (22%) patients showed pCR. For DW-MRI, the 75th percentile (P75) ΔADCpost-pre was most predictive for GR (c-index = 0.75). For DCE-MRI, P90 ΔAUCper-pre was most predictive for pCR (c-index = 0.79). Multivariable logistic regression analyses showed complementary value when combining DW-MRI and DCE-MRI for pCR prediction (c-index = 0.89).
Conclusions
Both DW-MRI and DCE-MRI are promising in predicting response to nCRT in esophageal cancer. Combining both modalities provides complementary information, resulting in a higher predictive value.
Introduction
Worldwide esophageal carcinoma continues to affect more than 450.000 people annually, with 5-year overall survival rates rarely exceeding 35% [Citation1–3]. Currently, neoadjuvant chemoradiotherapy (nCRT) followed by surgery is considered standard of care for patients with resectable locally advanced esophageal cancer. Many studies have reported that the degree of response to neoadjuvant therapy is associated with patient prognosis, with pathologic complete response (pCR) having the most favorable long-term prognosis [Citation1, Citation4–7]. Accurate prediction of good response to nCRT potentially allows a wait-and-see approach, with omission of surgery and close clinical follow-up. On the other hand, accurate prediction of poor response allows early treatment modification, e.g. intensification of neoadjuvant therapy or primary surgery.
Unfortunately, diagnostic modalities – including endoscopic biopsy, endoscopic ultrasonography and computed tomography (CT) – that are currently used to identify pathologic response yield unsatisfactory results [Citation8,Citation9]. Highest overall pooled sensitivities and specificities were found for 18F-FDG-PET(/CT), however, with values ranging from 67% to 70% this is still insufficient to justify changes in clinical decision making [Citation10,Citation11]. Meanwhile, functional MRI techniques are emerging as an advanced imaging technique since it visualizes different and possibly complementary tumor characteristics. With diffusion-weighted (DW-) magnetic resonance imaging (MRI) the variation in free diffusion of water molecules between different tissues is visualized, allowing it to distinguish tumorous tissue with high cellular density from healthy tissue using the apparent diffusion coefficient (ADC) [Citation12–15]. With dynamic contrast-enhanced (DCE-) MRI, the vascular integrity is visualized using administration of a contrast agent, allowing to monitor neoplastic changes in tissue [Citation16]. Two recent pilot studies reported that tumor alteration on both DW-MRI and DCE-MR imaging during the first 2–3 weeks of nCRT for esophageal cancer are highly predictive for pCR [Citation17,Citation18]. However, these findings have not yet been validated in a larger cohort. Also, no direct comparison between DW-MRI and DCE-MRI for treatment response evaluation in this setting has been reported.
The purpose of the current study was to evaluate, in a multicenter setting, whether combining data from both DW-MRI and DCE-MRI in patients receiving nCRT for esophageal cancer yields complementary information for response prediction, and may therefore increase predictive power compared to single technique MR imaging.
Material and methods
Study population
Patients were included in the University Medical Center Utrecht (UMCU) and in the Netherlands Cancer Institute (NKI), from August 2013 to January 2016. Written informed consent was obtained from all the patients and this study was approved by the institutional review board of each center. Patients with contraindications for 1.5T MRI with administration of a contrast agent were not eligible for inclusion. All 46 patients with biopsy-proven esophageal cancer receiving nCRT followed by surgery who underwent all MRI studies were initially included in this study. One patient was excluded due to a very small tumor volume (<2.5 mL on the initial scan). Of the remaining patients, 31 were scanned in the UMCU and 14 in the NKI ().
Table 1. Patient and treatment-related characteristics for both institutes.
Treatment protocol
All patients included in this study were planned to receive weekly administration of intravenous carboplatin (area under the curve of 2 mg/mL per minute) and paclitaxel (50 mg/m2 body surface-area) for 5 weeks, with concurrent radiotherapy of 41.4 Gy in 23 fractions of 1.8 Gy [Citation1]. All patients were treated with step-and-shoot intensity modulated radiation therapy (IMRT) or volumetric modulated arc radiotherapy (VMAT), planning goals were to cover at least 99% of the target volume with a minimum of 95% of the prescribed dose. Five to ten weeks (median 8 weeks) after completion of neoadjuvant treatment, all patients underwent a transhiatal or transthoracic esophagectomy.
Histopathologic assessment
Histopathologic assessment of the resection specimen was performed by a dedicated pathologist with GI subspecialty according to Mandard, with a tumor regression grade (TRG) ranging from 1 (pCR) to 5 (absence of regressive changes) [Citation19]. Two approaches were applied to discriminate between response to treatment: an analysis was performed to differentiate between patients with good (GR, TRG ≤ 2) versus poor response (noGR, TRG ≥ 3), and pathologic complete response (pCR, TRG1) versus no pathologic complete response (no-pCR, TRG ≥ 2).
MRI acquisition
Acquisition of MR images was performed at three time points: a baseline scan prior to treatment (pre), a scan after two weeks (8–13 fractions) of nCRT treatment (per) and a preoperative scan 3–9 weeks after completion of nCRT treatment (post). In all patients there was a similar initial intention to schedule surgery 6–8 weeks after completion of nCRT and plan the post-scan within two weeks prior to surgery. All image acquisition was performed on a 1.5T Philips Achieva or Ingenia (Best, The Netherlands) using the Torso (16 channels) or Anterior/Posterior (28 channels) receive coils, respectively. The same imaging protocol was used in both institutes. DWI scans were acquired in transverse plane during free breathing, for three different b-values (0, 200, 800 s/mm2), with a bandwidth per pixel of 29.4 or 23.4 Hz for the Achieva and Ingenia, respectively. The DCE-series consisted of 62 3D scans, scanned with a temporal resolution of 3 s. After the 10th scan the contrast agent was injected with an automatic syringe pump at a flow rate of 1 mL/s (for patients >100 kg 2 mL/s), followed by a saline injection. In the UMCU gadobutrol (Gd-BT-DO3A, Gadovist; Schering AG, Berlin, Germany) was used at a dose of 0.1 mmol/kg of body weight, at the NKI Dotarem (Gadoteric acid, 0.5 mM; Guerbet, Paris, France) was used with a fixed dose of 7.5 mmol for each patient. In order to prevent artifacts in the aorta due to pulsatile flow, the heart was included in the scanned volume. Prior to the DCE scan, a transverse T2-weighted scan was acquired for anatomical verification with a multi-slice turbo spin echo sequence, using a navigator for respiratory triggering [Citation17,Citation18]. Detailed scanning parameters are presented in .
Table 2. Scan parameters of the used MRI protocol.
Image analysis
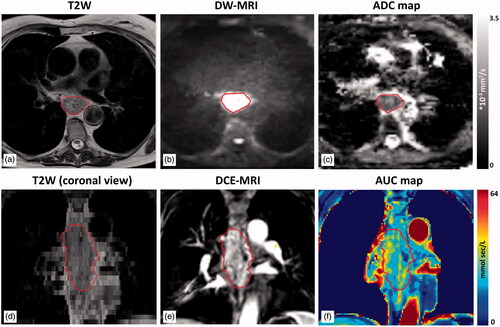
DWI scans were corrected for geometric distortions using a B0-field inhomogeneity map [Citation20] and ADC values were calculated using a mono-exponential model. DCE scans were processed according to a previously reported protocol [Citation18]. Rigid registration was performed to account for motion between scans. A series of scans with variable flip-angles were acquired. This enabled quantification of the intrinsic tissue T1 time which is required to quantify the contrast agent concentration after injection [Citation21]. The area-under-the-concentration versus time curve (AUC), defined as an integral over 60 s after inflow of contrast, was calculated. Examples of a T2-weighted, a DWI and a DCE scan and the corresponding ADC- and AUC-maps are shown in . To minimize inter-observer variability, the primary tumor was automatically delineated on the initial b800 DWI using a contouring algorithm in ITK-SNAP v3.4.0.QT4 with 2 clusters in pre-segmentation mode and default evolution parameters [Citation22]. As a result, a region with high values on the b800 DWI was delineated. These automatic delineations were verified and manually adjusted if necessary (e.g. in case of volume overestimation or the inclusion of lymph nodes), using both the ADC-map and T2-weighted scan in Volumetool, an in-house developed image software tool [Citation23]. This pre-delineation was registered to the next time point (per) and manually adjusted for possible shrinkage in the circumference of the esophagus, which was then propagated to the final time point (post), again followed by manual adjustments if necessary. In other words, in each individual patient the cranio-caudal length of the delineations remained constant over the three time points. All adjustments were performed in consensus by two readers (S.E.H. and L.G.) and verified by a radiation oncologist (S.M.).
Figure 1. An example of acquired MRI scans for one patient for one time point (pre scan). In (a) a T2W scan is shown with in (d) the coronal view of the same scan. (b) A b800 DW-MRI scan and its corresponding ADC-map in (c). In (e) the 24th scan of a DCE-MRI series is shown, during inflow of contrast in the tumor. The corresponding calculated AUC-map is found in (f).
Data analysis
In line with our previous work [Citation17,Citation18], mean, median and several percentiles (P75/P90) were calculated for ADC (DW-MRI) and AUC (DCE-MRI) within the delineations on both modalities. Separate time points as well as percentage differences between time points were analyzed. The first acquired scan was used as a reference for these calculations, as this was found to provide the highest predictive performance in the prior studies on DW-MRI or DCE-MRI. Previously published optimal thresholds for both modalities were reoptimized in this larger patient cohort.
A quantitative quality assessment was performed on all DW-MRI scans because some scans were visually of poor quality. Scans with poor quality typically showed high noise levels in the lung and/or poor visibility of the spleen, therefore, on the b800 DWI both organs were delineated and mean signal values were divided to reach a quantitative quality measure (spleen/lung). The analysis of the DW-MRI and a combined analysis of DW-MRI and DCE-MRI was only performed in scans in which the aforementioned quality measure was higher than mean minus standard deviation (SD) of the whole patient group.
Statistical analysis
Patient and treatment-related characteristics were described as count with percentages, mean with SD or median with range as appropriate. The association between response and DW-MRI or DCE-MRI parameters was estimated using univariable logistic regression analysis. Diagnostic performance measures (i.e. sensitivity, specificity, positive predictive value (PPV) and negative predictive value (NPV)) were computed and receiver operating characteristics (ROC) curve analysis was performed, calculating the area-under-the-curve (c-index). A p-value of <.05 was considered statistically significant. Complementary value of DW-MRI and DCE-MRI was assessed using a multivariable logistic regression model. Model performance was assessed by the Akaike Information criterion [Citation24]. Predictive values were only presented when DW-MRI and DCE-MRI were complementary. Ideal cutoff values were calculated by giving equal weight to sensitivity and specificity. The threshold in terms of probability (output of logistic regression) was converted in terms of ADC and AUC following the equation:
(1)
(1)
with n the number of variables X (univariable [n = 1], techniques combined [n = 2]), and α/β constants calculated by the logistic regression model. All statistical analyses were performed in SPSS Statistics version 22 (IBM Corp., Armonk, NY, USA) and visual representations using GraphPad Prism 6.07 software (GraphPad Software, La Jolla, CA, USA).
Results
For the total group of 45 patients, assessment of the histopathologic tumor type revealed adenocarcinoma in 38 (84%) patients, squamous cell carcinoma in 5 (11%) patients, and adenosquamous carcinoma in 2 (4%) patients. Patient- and treatment-related characteristics are shown in . The resection specimen showed good response (TRG 1-2) in 22 (49%) patients, of which 10 (22%) patients showed pCR.
DCE-MRI parameter AUCper 90th percentile (P90) showed a significant difference in separating pCR from no-pCR (p = .044, c-index = 0.72). An initial increase followed by a decrease was found when comparing the three time points. AUC P90 showed for pCR values of 34.0 ± 9.4 mmol·L−1s [mean ± SD], 36.8 ± 8.3 mmol·L−1s and 29.5 ± 13.9 mmol·L−1s for pre, per and post, respectively. Similarly, AUC P90 for no-pCR was 34.3 ± 9.5 mmol·L−1s, 48.9 ± 16.1 mmol·L−1s and 32.0 ± 9.6 mmol·L−1s, for pre, per and post, respectively. When comparing differences between scans with respect to the first time point, the most predictive value to separate pCR from no-pCR, was the relative increase in tumor AUC with a P90 ΔAUCper-pre of 10.6% ± 17.6% and 45.2% ± 41.5% for pCR and no-pCR, respectively (p = .028, c-index = 0.79) (). No significant differences were found for ΔAUC in predicting GR versus noGR ().
Figure 2. In (a) and (b) 90th percentile (P90) ΔAUCper-pre is presented as a function of response and in (c) and (d) 75th percentile (P75) ΔADCpost-pre. In (a, c) pathologic complete response (pCR) and no-pCR are differentiated while in (b, d) good response (GR) versus poor response is shown. Each dot represents a patient and the two institutes are indicated separately (UMCU in black/NKI in grey). The solid black line for each group represents the median. Threshold lines are indicated for which predictive values are calculated for separation based on response.
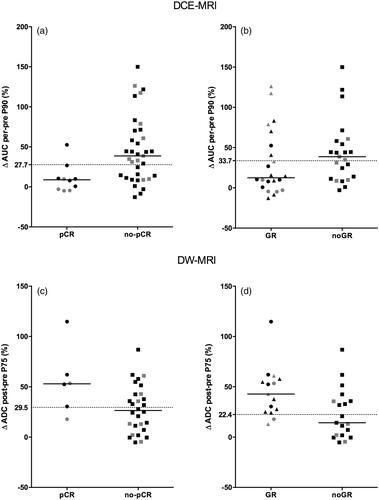
Table 3. Predictive values for both DW-MRI and DCE-MRI discriminating pCR versus no-pCR and GR versus noGR.
Quantitative quality assessment of the b800 maps for the three different time points resulted in spleen/lung image intensity ratio [mean ± SD] values of 5.9 ± 2.0, 5.0 ± 1.7 and 4.4 ± 1.7 for pre, per and post scans, respectively. A total of 24 out of 138 (17%) scans revealed a value below mean-SD, with a large overlap within the same patients for the three time points. This resulted in exclusion of 11 patients (AVL [n = 5] and UMCU [n = 6]), of which 7 GR and 4 noGR (, 3rd column). No direct relation was found between excluded patients and patient and treatment-related characteristics (e.g. TN-stage, tumor location). For the remaining 34 patients, analysis was performed on DW-MRI parameter ADC. Analysis of the three time points showed only a significant difference in separating GR from noGR for ADCper P90 (p = .040, c-index = 0.70) and ADCpost P90 (p = .040, c-index = 0.70). An increasing trend in ADC over time was found for both good and poor responders (median ADC for GR 1.87 ± 0.41*10−3 mm2/s [mean ± SD], 2.31 ± 0.37*10−3 mm2/s and 2.72 ± 0.62*10−3 mm2/s for pre, per and post, respectively, and for noGR 1.96 ± 0.32*10−3 mm2/s, 2.15 ± 0.37*10−3 mm2/s and 2.41 ± 0.51*10−3 mm2/s). Significant associations with response were found in ΔADC with respect to the first time point. ΔADCper-pre P90 resulted in a [mean ± SD] of 23.5% ± 20.5% and 9.8% ± 11.7% for GR and noGR, respectively (p = .035, c-index = 0.70). The most predictive parameter was ΔADCpost-pre P75 with [mean ± SD] of 45.0% ± 25.3% and 23.1% ± 25.2% for GR and noGR, respectively (p = .031, c-index = 0.75) (). Analysis of ΔADC in predicting pCR versus no-pCR did not show significant associations ().
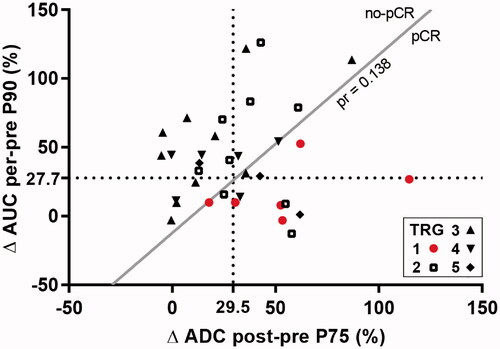
Multivariable logistic regression analysis, including patients for whom both DW-MRI and DCE-MRI were available (n = 34), revealed that these parameters were complementary in predicting pCR (c-index = 0.89). Predictive values of this model and the univariable analysis are presented in . The ΔAUCper-pre as function of ΔADCpost-pre is presented in in which threshold lines of both univariable models as well as the multivariable models are shown. The ROC-curves of the logistic regression models are shown in Supplementary Figure 1(a) for both GR and pCR, in which the chosen threshold for the complementary model predicting pCR is marked. Since percentile values are not commonly produced in analysis software, predictive values and ROC-curves are also presented for mean ΔAUCper-pre and ΔADCpost-pre in Supplementary Table 1 and Supplementary Figure 1(b). Slightly lower c-index and predictive values were reached, multivariable logistic regression showed no complementary value.
Figure 3. 90th percentile (P90) ΔAUCper-pre is plotted as function of 75th percentile (P75) ΔADCpost-pre. Each dot represents a patient and TRG scores are differentiated using different symbols, with pathologic complete response (pCR) highlighted in red. Equal thresholds from predicting pCR are indicated in dotted lines. The solid line represents the threshold line (separating pCR from no-pCR) from the multivariable logistic regression model, for which the probability equals 0.138.
Discussion
This multicenter prospective study demonstrates that DW-MRI and DCE-MRI provide complementary information for predicting response to nCRT in patients with esophageal cancer. Separate analysis of both DW-MRI and DCE-MRI showed trends in discriminating good from poor responders comparable to previously published work [Citation17,Citation18].
To our knowledge, this is the first study investigating the complementary value of DW-MRI and DCE-MRI for response prediction in patients with esophageal cancer. A previous published study assessed the independent value of intravoxel incoherent motion (IVIM) MRI and DCE-MRI in patients with esophageal cancer, but did not report a combined analysis [Citation25]. In other tumor sites multiple studies have reported superior descriptive accuracies of combined analyses compared to separate analyses [Citation26,Citation27].
Both DW-MRI and DCE-MRI showed significant associations with response when ADC and AUC were analyzed at separate time points. However, higher c-index values and significant associations with response were found for both modalities when differences between time points were analyzed, which is in correspondence with our previously published work and publications concerning other tumor sites [Citation17,Citation18,Citation28,Citation29]. Compared to predictive values found for 18F-FDG-PET(/CT) [Citation10,Citation11], combining DW-MRI and DCE-MRI reached higher predictive values for response prediction. In the DCE-MRI series, the most predictive parameter was the difference between the pre-scan and the scan acquired during nCRT. Analyses of DW-MRI series showed, in contrast to previous published work [Citation17], that differences between the post and baseline-scan had a higher predictive value than differences between baseline and per-scans.
Correct prediction of response during treatment may enable early modification of the treatment (i.e. nCRT intensification or discontinuation) while prediction of response using a post-treatment scan can guide the choice to omit surgery and possibly use a wait-and-see approach [Citation30,Citation31].
Combining both modalities increased predictive values and showed that they complement each other (). In this study, uni- and multivariable logistic regression models were used to predict response to nCRT in patients with esophageal cancer. To further optimize the prediction model, the addition of other modalities could be examined, as well as the use of other models (e.g. machine-learning methods) [Citation32,Citation33].
A different approach was chosen for delineation of the tumor compared to our previous work. To minimize inter-observer variability, the pre-scan was delineated using automatic-contouring software [Citation22], which was then transformed to the following time point. Adjustments for possible anatomical changes in esophageal circumference were made using both the ADC-map and anatomical T2-weighted images. This method is less user-dependent and more sensitive to detect quantitative differences within the tumor over time, because it includes the cranio-caudal length and circumference of the initial tumor on all MR scans. The delineation is thus not solely based on the high b800 signal intensity of each time point separately. This could explain why the ΔADCpost-pre was found to be more sensitive to response prediction compared to our previous study [Citation17]. Furthermore, in the current study the DCE-MRI parameter AUC resulted in higher predictive values compared to our previous results, what may be caused by the differences in delineation approaches between this study and our previous smaller DCE-study [Citation18].
In the determination of a threshold for separating responders from non-responders, a tradeoff is made between a preference for high specificity (proportion of poor responders well classified), high sensitivity (proportion of good responders well classified), high PPV or high NPV, depending on the purpose. The threshold can be changed to achieve, for example, a high NPV when the goal is to justify therapy discontinuation in poor responders.
Some limitations apply to this study. First, the reproducibility within patients of the researched parameters is unknown. However, the ADC calculation was validated using a diffusion phantom in both institutes (HPD, Boulder, CO, USA). Second, the exclusion of patients due to poor scan quality resulted in a relatively small sample size of the DW-MRI and multivariable logistic regression analyses, therefore, leading to limited clinical impact. Although poor scan quality was found to be patient dependent (i.e. the same patients showed poor scan quality at multiple time points), no relations were found between excluded patients and clinical parameters. After the current study, adjustments to the imaging protocol were made. Promising results were obtained with higher and more stable scan quality and less influence of the presence of breathing motion, which could have possibly influenced the predictive values found in this study. A multicenter prospective validation study in a large cohort of patients is currently underway, which should resolve the limitations in the current literature (ClinicalTrials.gov identifier NCT03474341). The current study justifies studying both modalities, since they showed to be of complementary value. Third, the timing of the second scan was based on our previously published work [Citation11,Citation17,Citation18]. However, a study that is currently being performed in our institute is assessing the optimal time point for response prediction during the course of nCRT, which could further improve the reported predictive values. The timing of surgery was intended to be 6–8 weeks after nCRT with a post-scan within two weeks prior to surgery. Due to, for example, logistic reasons this date varied. Variations in time between neoadjuvant therapy and surgery impact the observed pathologic response and could therefore influence our results [Citation34,Citation35].
In conclusion, our multicenter study shows that changes in both DW-MRI and DCE-MRI parameters during treatment are promising imaging markers for prediction of response to nCRT in patients with esophageal cancer. Furthermore, both modalities provide distinct predictive information about the tumor, resulting in increased accuracy when using a multiparametric response prediction model.
Supplemental Material
Download Zip (49.3 KB)Disclosure statement
No potential conflict of interest was reported by the authors.
None of the authors have financial or personal conflicts of interest to disclose.
References
- van Hagen P, Hulshof MCCM, van Lanschot JJB, et al. Preoperative chemoradiotherapy for esophageal or junctional cancer. N Engl J Med. 2012;366:2074–2084.
- Omloo JMT, Lagarde SM, Hulscher JBF, et al. Extended transthoracic resection compared with limited transhiatal resection for adenocarcinoma of the mid/distal esophagus: five-year survival of a randomized clinical trial. Ann Surg. 2007;246:992–1001.
- Torre LA, Bray F, Siegel RL, et al. Global cancer statistics, 2012. CA Cancer J Clin. 2015;65:87–108.
- Donahue JM, Nichols FC, Li Z, et al. Complete pathologic response after neoadjuvant chemoradiotherapy for esophageal cancer is associated with enhanced survival. Ann Thorac Surg. 2009;87:392–399.
- Chirieac LR, Swisher SG, Ajani JA, et al. Posttherapy pathologic stage predicts survival in patients with esophageal carcinoma receiving preoperative chemoradiation. Cancer. 2005;103:1347–1355.
- Berger AC, Farma J, Scott WJ, et al. Complete response to neoadjuvant chemoradiotherapy in esophageal carcinoma is associated with significantly improved survival. J Clin Oncol. 2005;23:4330–4337.
- Shapiro J, van Lanschot JJB, Hulshof MCCM, et al. Neoadjuvant chemoradiotherapy plus surgery versus surgery alone for oesophageal or junctional cancer (CROSS): long-term results of a randomised controlled trial. Lancet Oncol. 2015;16:1090–1098.
- Van Rossum PSN, Goense L, Meziani J, et al. Endoscopic biopsy and EUS for the detection of pathologic complete response after neoadjuvant chemoradiotherapy in esophageal cancer: a systematic review and meta-analysis. Gastrointest Endosc. 2016;83:866–879.
- Westerterp M, van Westreenen HL, Reitsma JB, et al. Esophageal cancer: CT, endoscopic US, and FDG PET for assessment of response to neoadjuvant therapy–systematic review. Radiology. 2005;236:841–851.
- Kwee R. Prediction of tumor response to neoadjuvant therapy in patients with esophageal cancer with Use of 18F FDG PET: a systematic review. Radiology. 2010;254:707–717.
- Chen Y, Pan X, Tong L, et al. Can 18F-fluorodeoxyglucose positron emission tomography predict responses to neoadjuvant therapy in oesophageal cancer patients? A meta-analysis. Nucl Med Commun. 2011;32:1005–1010.
- Koh D, Collins DJ. Diffusion-Weighted MRI in the Body: Applications and Challenges in Oncology. Am J Roentgenol. 2007;188:1622–1635.
- Padhani AR, Liu G, Koh DM, et al. Diffusion-weighted magnetic resonance imaging as a cancer biomarker: consensus and recommendations. Neoplasia. 2009;11:102–125.
- Thoeny HC, Ross BD. Predicting and monitoring cancer treatment response with diffusion-weighted MRI. J Magn Reson Imaging. 2010;32:2–16.
- Bakke KM, Hole KH, Dueland S, et al. Diffusion-weighted magnetic resonance imaging of rectal cancer: tumour volume and perfusion fraction predict chemoradiotherapy response and survival. Acta Oncol (Madr). 2017;56:813–818.
- Zahra MA, Hollingsworth KG, Sala E, et al. Dynamic contrast-enhanced MRI as a predictor of tumour response to radiotherapy. Lancet Oncol. 2007;8:63–74.
- van Rossum PSN, van Lier ALHMW, van Vulpen M, et al. Diffusion-weighted magnetic resonance imaging for the prediction of pathologic response to neoadjuvant chemoradiotherapy in esophageal cancer. Radiother Oncol. 2015;115:163–170.
- Heethuis SE, van Rossum PSN, Lips IM, et al. Dynamic contrast-enhanced MRI for treatment response assessment in patients with oesophageal cancer receiving neoadjuvant chemoradiotherapy. Radiother Oncol. 2016;120:128–135.
- Mandard A, Dalibard F, Mandard J. Pathologic assessment of tumor regression after preoperative chemoradiotherapy of esophageal carcinoma. Clinicopathologic correlations. Cancer. 1994;73:2680–2686.
- Jezzard P, Balaban RS. Correction for geometric distortion in echo planar images from B0 field variations. Magn Reson Med. 1995;34:65–73.
- Fram EK, Herfkens RJ, Johnson GA, et al. Rapid calculation of T1 using variable flip angle gradient refocused imaging. Magn Reson Imaging. 1987;5:201–208.
- Yushkevich PA, Piven J, Hazlett HC, et al. User-guided 3D active contour segmentation of anatomical structures: significantly improved efficiency and reliability. Neuroimage. 2006;31:1116–1128.
- Bol GH, Kotte ANTJ, van der Heide UA, et al. Simultaneous multi-modality ROI delineation in clinical practice. Comput Methods Programs Biomed. 2009;96:133–140.
- Akaike H. A new look at the statistical model identification. IEEE Trans Automat Contr. 1974;19:716–723.
- Lei J, Tian Y, Zhu S, et al. Preliminary study of IVIM-DWI and DCE-MRI in early diagnosis of esophageal cancer. Eur Rev Med Pharmacol Sci. 2015;19:3345–3350.
- Li X, Abramson RG, Arlinghaus LR, et al. Combined DCE-MRI and DW-MRI for predicting breast cancer pathological response after the first cycle of neoadjuvant chemotherapy. Invest Radiol. 2015;50:195–204.
- Chawla S, Kim S. Pretreatment diffusion-weighted and dynamic contrast-enhanced MRI for prediction of local treatment response in squamous cell carcinomas of the head and neck. AJR Am J Roentgenol. 2013;200:35–43.
- Intven M, Monninkhof EM, Reerink O, et al. Combined T2w volumetry, DW-MRI and DCE-MRI for response assessment after neo-adjuvant chemoradiation in locally advanced rectal cancer. Acta Oncol. 2015;54:1729–1736.
- Weiss E, Ford JC, Olsen KM, et al. Apparent diffusion coefficient (ADC) change on repeated diffusion-weighted magnetic resonance imaging during radiochemotherapy for non-small cell lung cancer: a pilot study. Lung Cancer. 2016;96:113–119.
- Habr-Gama A, Perez RO, Nadalin W, et al. Operative versus nonoperative treatment for stage 0 distal rectal cancer following chemoradiation therapy: long-term results. Ann Surg. 2004;240:711–717-8.
- Maas M, Beets-Tan RGH, Lambregts DMJ, et al. Wait-and-see policy for clinical complete responders after chemoradiation for rectal cancer. J Clin Oncol. 2011; 29:4633–4640.
- El Naqa I, Bradley JD, Lindsay PE, et al. Predicting radiotherapy outcomes using statistical learning techniques. Phys Med Biol. 2009;54:S9–S30.
- Oermann EK, Rubinsteyn A, Ding D, et al. Using a machine learning approach to predict outcomes after radiosurgery for cerebral arteriovenous malformations. Sci Rep. 2016;6:21161.
- Shapiro J, Van Hagen P, Lingsma HF, et al. Prolonged time to surgery after neoadjuvant chemoradiotherapy increases histopathological response without affecting survival in patients with esophageal or junctional cancer. Ann Surg. 2014;260:807–814.
- van der Werf LR, Dikken JL, van der Willik EM, et al. Time interval between neoadjuvant chemoradiotherapy and surgery for oesophageal or junctional cancer: a nationwide study. Eur J Cancer. 2018;91:76–85.