
 ?Mathematical formulae have been encoded as MathML and are displayed in this HTML version using MathJax in order to improve their display. Uncheck the box to turn MathJax off. This feature requires Javascript. Click on a formula to zoom.
Abstract
Background
Temporal lobe necrosis (TLN) is a potential late effect after radiotherapy for skull base head and neck cancer (HNC). Several photon-derived dose constraints and normal tissue complication probability (NTCP) models have been proposed, however variation in relative biological effectiveness (RBE) may challenge the applicability of these dose constraints and models in proton therapy. The purpose of this study was therefore to investigate the influence of RBE variations on risk estimates of TLN after Intensity-Modulated Proton Therapy for HNC.
Material and Methods
Seventy-five temporal lobes from 45 previously treated patients were included in the analysis. Sixteen temporal lobes had radiation associated Magnetic Resonance image changes (TLIC) suspected to be early signs of TLN. Fixed (RWDFix) and variable RBE-weighed doses (RWDVar) were calculated using RBE = 1.1 and two RBE models, respectively. RWDFix and RWDVar for temporal lobes were compared using Friedman’s test. Based on RWDFix, six NTCP models were fitted and internally validated through bootstrapping. Estimated probabilities from RWDFix and RWDVar were compared using paired Wilcoxon test. Seven dose constraints were evaluated separately for RWDFix and RWDVar by calculating the observed proportion of TLIC in temporal lobes meeting the specific dose constraints.
Results
RWDVar were significantly higher than RWDFix (p < 0.01). NTCP model performance was good (AUC:0.79-0.84). The median difference in estimated probability between RWDFix and RWDVar ranged between 5.3% and 20.0% points (p < 0.01), with V60GyRBE and DMax at the smallest and largest differences, respectively. The proportion of TLIC was higher for RWDFix (4.0%–13.1%) versus RWDVar (1.3%–5.3%). For V65GyRBE ≤ 0.03 cc the proportion of TLIC was less than 5% for both RWDFix and RWDVar.
Conclusion
NTCP estimates were significantly influenced by RBE variations. Dmax as model predictor resulted in the largest deviations in risk estimates between RWDFix and RWDVar. V65GyRBE ≤ 0.03 cc was the most consistent dose constraint for RWDFix and RWDVar.
Background
The favorable physical properties of protons offer the ability to generate proton treatment plans with low entrance doses, high target volume conformity and a rapid dose fall-off beyond the target volume. This enables a reduction of delivered normal tissue doses and a potential clinical benefit over photon radiotherapy in terms of a lower risk of certain radiation induced side effects. The absorbed doses from protons are considered to be more biologically effective than absorbed doses from photons. The relationship between protons and photons is described by the proton relative biological effectiveness (RBE), which is defined as the ratio of doses required by photons and protons that result in the same level of biological effect. Although the current clinical practice is to use a constant RBE of 1.1 to calculate the RBE-weighted doses (RWD) [Citation1,Citation2], it is well recognized that the proton RBE varies with fraction dose, Linear Energy Transfer (LET), biological endpoint and tissue (α/β) and other factors [Citation2,Citation3]. The ‘true’ RBE is therefore variable and the delivered biological dose distribution could deviate substantially from what was planned assuming a fixed RBE of 1.1. Several proton RBE models that take into account the RBE dependency on dose per fraction, LET and tissue α/β have been proposed [Citation4–8]. When applying RBE models for calculation of variable RWD (RWDVar), simulation studies have demonstrated both increased biologically dose in critical organs and reduced target doses compared to fixed RWD (RWDFix) [Citation9–11].
Temporal lobe necrosis (TLN) is a potential radiation associated late effect which may occur in patients treated for head and neck cancer at the skull base. Commonly the diagnosis of TLN is based on characteristic image changes on Magnetic Resonance Images (MRIs) and graded according to severity of patient symptoms [Citation12]. Radiation-associated brain image changes and brain necrosis has been described in a number of publications and numerous dose volume predictors and dose constraints for reducing risk of cerebral and TLN have been suggested [Citation13–28]. To implement Normal Tissue Complication Probability (NTCP) models and dose constraints derived from different treatment techniques, different patient cohorts and/or modeling approaches without any form of validation, could in worst case result in clinical misjudgment of the risk of toxicity. In proton therapy, this is further challenged by the uncertainty and variability in proton RBE. The specific aims of the current study were therefore to (a) investigate the effect of RBE variations on NTCP estimates of TLN in skull base HNC previously treated with IMPT, and (b) to evaluate and compare the applicability of previously proposed dose constraints for limiting risk of TLN according to fixed and variable RBE weighted doses.
Material and methods
Patient data and endpoint definition
The patient data consisted of treatment plans from 45 patients selected from a database of 127 patients previously treated with passive scattering and/or pencil beam scanning proton therapy for HNC at the skull base [Citation13]. In order to be included in the current analysis, the following criteria had to be met; treatment with Intensity Modulated Proton Therapy (IMPT), minimum prescribed dose of 60 GyRBE (RBE = 1.1), a minimum follow-up time of 24 months with at least one post-treatment MRI of ≥ 6 months from completion of IMPT. For all patients, the follow-up MRIs had routinely been reviewed for temporal lobe image changes (TLIC) assumed to be associated with TLN. The MRI findings were evaluated according to previously published recommendations for MRI-based diagnosis of radiation necrosis. The criteria included contrast-enhanced lesions located in previously irradiated regions visible on T1-weighted MRI sequences, and hyperintensity/edema visible on T2-weighted MRI sequences [Citation29]. The initial diagnosis was verified through a second review of the MRIs and the MRI reports by two board certified radiation oncologists (GBG and SJF), whereas the clinical grading was based on a retrospective review of the patients’ electronic medical records using the Common Terminology Criteria for Adverse Events (CTCAE 4.03) (Supplementary Table I) [Citation12]. Asymptomatic TLIC is scored as Grade 1 according to CTCAE 4.03, and may further be considered as early signs of radiation associated TLN and lesions may evolve over time [Citation29]. The initial TLIC was therefore used as endpoint for the NTCP model fitting and evaluation of the dose constraints associated with TLN.
Treatment
The IMPT treatment plans were based on noncontrast CT scans acquired with the patients immobilized in supine position using a 5-point thermoplastic mask. The CTV definitions were consensus-based. The temporal lobes were retrospectively contoured on the planning CT scans (guided by rigidly registered T1-weighted and T2-weighed MRI sequences when available) according to previously published guidelines [Citation30]. Typically, beam arrangements consisted of one posterior beam and two lateral anterior oblique beams for bilateral neck treatments, and two lateral anterior and posterior oblique beams for unilateral treatments. Simultaneously integrated boost strategy was applied for all IMPT plans with multiple dose levels. All treatment plans were generated in the Eclipse treatment planning system (Varian Medical Systems, Palo Alto, CA, USA).
Calculation of RBE-weighted doses
The patients’ treatment plans and the corresponding planning CT were exported to an in-house developed Monte Carlo system [Citation31–33] for accurate calculations of dose and dose-averaged LET (LETd). The calculation of LETd was performed using a step-by-step approach previously described by Cortes-Giraldo and Carabe (method 3) [Citation34] and where LETd was calculated from pre-generated tables for stopping power from GEANT4 [Citation35]. The RWDVar was calculated using two different RBE models; the RBE model from McNamara et al. [Citation6] and the RBE model from Wedenberg et al. [Citation7]. Both the RBE models are based on the linear quadratic model and RBE is estimated based on the two functions RBEmax and RBEmin, which respectively describes extreme RBE at low and high doses (Supplementary material B). Both models take the LETd, the tissue-specific parameter α/β for x-rays and dose as input variables. For calculation of the RWDVar, an α/β of 2.0 Gy was used for the temporal lobes [Citation36], whereas the RBE model parameter values were taken from the original publications.
Selection of dose volume predictors and dose constraints
Dose volume predictors from previously published NTCP models for TLN were selected for evaluation according to fixed and variable RBE-weighted doses [Citation16,Citation25,Citation37]. Dose volume constraints for 5% risk were those either previously recommended by international consensus guidelines or derived from the selected NTCP models (i.e., the estimated TD5/5 from the original paper). Four of the dose constraints were proposed by international consensus guidelines including the Quantitative Analysis of Normal Tissue Effects in the Clinic (QUANTEC) [Citation17], the International Consensus Guideline on Dose Prioritization and Acceptance Criteria for Radiotherapy Planning for Nasopharyngeal Carcinoma and the European Particle Therapy Network Consensus [Citation38]. The dose volume predictors and dose constraints are displayed in . The V70Gy ≤ 0.03 cc was evaluated only for patients with T3–T4 tumors and diseases with skull base and/or intracranial involvement. All dose constraints were evaluated according to temporal lobe doses.
Table 1. NTCP model predictors and dose constraints from the literature.
Statistical analysis and dose response modeling
Fixed and variable RBE-weighted doses for the temporal lobes were summarized using descriptive statistics and compared using Related Samples Friedman's two-way analysis of variance by ranks (Friedman’s test).
To investigate the influence of RBE variations on the estimated probability of temporal lobe necrosis, RWDFix was used as input doses in NTCP model fitting with Dmax, D0.5 cc, D1cc, D2cc, V60GyRBE and V65GyRBE as predictor variables. The NTCP model fitting was performed using univariate logistic regression analysis with robust estimation of standard errors to account for within-patient correlations of the temporal lobes. Bootstrapping (n = 1000) was applied for internal model validation. Models were evaluated and compared using Nagelkerke’s R2, Brier score, Area Under the Receiver Operating Characteristic Curve (AUC) and Calibration intercept and slope. For each of the models, the probability of temporal lobe necrosis was estimated for RWDFix, RWDMcN and RWDWed using the formula
(1)
(1)
(2)
(2)
where β0 and β1 are the model coefficients and x is the predictor variable. The differences in the estimated probabilities between RWDFix, RWDMcN and RWDWed were compared using two-sided paired Wilcoxon signed-rank test.
The applicability of the proposed dose constraints was evaluated by calculating the observed proportion of TLIC in temporal lobes with doses meeting the specific dose constraints associated with a 5% risk of temporal lobe necrosis. This was done separately for RWDFix, RWDMcN and RWDWed. For all statistical tests, p-values < 0.05 were considered significant. Bonferroni corrections were applied to adjust for multiple comparisons. All analyses were performed in R version 4.0.2 [Citation39]. Regression analysis and validation were performed using the package rms version 6.1-0 [Citation40].
Results
Patient characteristics are displayed in . Three of the patients had bilateral temporal lobe image changes. After excluding the contralateral temporal lobes from patients with unilateral treatments, 75 temporal lobes, of which 16 with verified radiation associated image changes, were included in the analysis. Patient and TLIC outcomes for this cohort has previously been described [Citation13].
Table 2. Patient characteristics for those with (n = 13) and without (n = 32) image changes on the follow-up MRIs.
Comparison of fixed and RBE-weighted doses
An example of the dose distribution for RWDFix, RWDMcN and RWDWed is displayed in . The summary statistics of selected dose variables for the entire cohort are displayed in c) and according to TLIC status in Supplementary Table II. Overall, both RWDMcN and RWDWed was significantly higher than RWDFix (p < 0.01). The differences in median values between RWDFix and RWDVar were typically in the range of 4 to 6 GyRBE for the high-dose indices with exception of DMax, where the difference exceeded 8 GyRBE. There were only small and insignificant differences between RWDMcN and RWDWed, we therefore subsequently present only the results for RWDMcN. The median differences between RWDMcN and RWDFix in Dmax and D0.5 cc to the temporal lobes were 8.4 GyRBE (95% CI: 7.6−9.5 GyRBE) and 5.2 GyRBE (95% CI: 4.5–6.1 GyRBE), respectively, whereas the difference in temporal lobe Dmean between RWDMcN and RWDFix was 1.1 GyRBE (95% CI: 1.0–1.3 GyRBE) (). Similarly, the volume-dose indices were higher for the RWDVar compared to RWDFix. The median difference between RWDMcN and RWDFix for V40 GyRBE and V70 GyRBE to the temporal lobe were 1.4 cc (95% CI: 1.2–1.6 cc) and 0.7 cc (95% CI: 0.4–1.2 cc), respectively ().
Figure 1. (a) Example of fixed and variable RBE weighted dose distributions. Note the high dose area in the contoured image change (red line) in the RWDVar dose distributions. (b–c) boxplots of selected dose volume indices for the temporal lobes. RWDFix: dose distribution calculated using a constant RBE of 1.1, RWDMcN: dose distribution calculated using the RBE model from McNamara et al. [Citation6], RWDWed: dose distribution calculated using the RBE model from Wedenberg et al. [Citation7]. CTV 70: prescribed dose 70 GyRBE (RBE = 1.1).
![Figure 1. (a) Example of fixed and variable RBE weighted dose distributions. Note the high dose area in the contoured image change (red line) in the RWDVar dose distributions. (b–c) boxplots of selected dose volume indices for the temporal lobes. RWDFix: dose distribution calculated using a constant RBE of 1.1, RWDMcN: dose distribution calculated using the RBE model from McNamara et al. [Citation6], RWDWed: dose distribution calculated using the RBE model from Wedenberg et al. [Citation7]. CTV 70: prescribed dose 70 GyRBE (RBE = 1.1).](/cms/asset/cc0a5697-cc60-435a-9b22-5fa36512308e/ionc_a_1979248_f0001_c.jpg)
The effect of RBE variations on NTCP
Of the six NTCP models, the model with D0.5 cc as predictor had the best discrimination and calibration, however all model predictors were significantly associated with TLIC and all had good discriminative ability with corrected AUCs ranging from 0.785 to 0.838. The odds ratios, p-values and the result from the bootstrap validation of the models are displayed in Supplementary Table III. For all the NTCP models, the estimated probabilities based on RWDMcN and RWDWed were approximately similar, however significantly higher than the estimated probability from RWDFix (all p < 0.01). Compared to RWDFix, the median increase in the estimated probabilities for RWDMcN and RWDWed were less than 10 percentage point for the majority of models and ranged between 5.3 and 8.1 percentage points for RWDMcN and between 5.3 and 8.0 percentage points for RWDWed. For the model with DMax, however, the increase was 19.4 and 20.0 percentage points for RWDMcN and RWDWed, respectively (/Supplementary Figure 1).
Figure 2. Scatter plot showing the difference in estimated probabilities between RWDFix and RWDVar.

Evaluation of dose constraints according to fixed and variable RBE-weighted doses
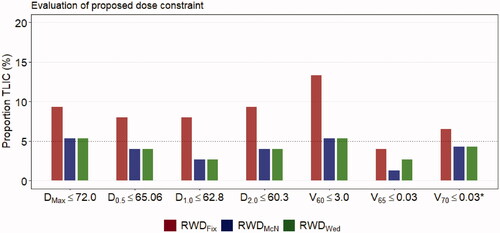
In general, when dose constraints were met, the observed proportion of TLIC was higher for RWDFix than RWDMcN and RWDWed. For RWDFix, the observed proportion of TLIC ranged between 4.0% and 13.1%, with the highest proportion of TLIC for V60GyRBE ≤ 3.0 cc. For RWDVar, the observed proportion of TLIC ranged between 1.3% and 5.3%. For V65GyRBE ≤ 0.03 cc the proportion of TLIC was less than 5% for both RWDFix, RWDMcN and RWDWed ().
Figure 3. (a) Evaluation of the different dose constraints according to RWDFix, RWDMcN and RWDWed. Barplot of observed proportion of TLIC when the different dose constraints were met. *Dose constraint only evaluated for patients with T3–T4 disease and with skull base/intra cranial involvement. The dotted horizontal line represents the 5% level of observed TLIC in the data set. Dose and volumes in GyRBE and cc, respectively.
Discussion
Although the variability in proton RBE is well recognized, a fixed RBE of 1.1 is standardly used in clinical practice. This practice is rationalized with the arguments that RBE models have significant uncertainties and lack validation in in-vivo studies and for clinical outcomes [Citation2]. In the current study, we used treatment plans and outcome data from patients treated with IMPT for HNC at the skull base in order to explore how variations in RBE may influence temporal lobe dose distributions and hence the assessment of risk of developing radiation-induced TLN. We found that temporal lobe doses were systematically higher when calculated using variable RBE models compared to uniform scaling of the physical dose by a factor of 1.1. We further found that the resulting increase in NTCP varied depending on dose volume variable used in the model. Moreover, for the majority of dose constraints evaluated in this study, the RWDFix in general underestimated risk, while the RWDVar were in line with the proposed dose thresholds.
Previous studies have addressed the potential effect of RBE variations in brain organs at risk (OARs) and reported comparable findings as in the current study. Yepes et al. [Citation41], evaluated the effect of RBE variations in IMPT treatment plans using three different RBE models. They showed that RBEMcN and RBEWed predicted approximately similar, but in generally higher RBE than 1.1 in critical organs (and hence increased RWDVar), whereas the increase in RBE predicted by the repair-misrepair-fixation (RMF) model was less pronounced. Giantsoudi et al. [Citation9] compared treatment plans from IMPT and passive scattering proton therapy (PSPT) and found that, although IMPT was superior to PSPT when evaluated according to RWDFix, increased maximum RWDVar of up to 6% in the brainstem was found for IMPT. Wedenberg et al. [Citation11] compared dose distributions from photons, fixed and variable RBE weighted doses in treatment plans from three patients with brain tumors. They found higher doses in critical OARs and higher estimated NTCP for RWDVar compared to RWDFix.
The use of dose constraints across modalities is generally subject to uncertainties, and although all the evaluated dose constraints could be considered applicable in terms of RWDvar, only V65GyRBE ≤ 0.03 cc was applicable for RWDfix. This could indicate that, for IMPT, dose constraints specified in terms of the RBE models used in the current study could be clinically applicable in evaluating IMPT plans safely in terms of protection of temporal lobes from TLIC. Such constraints may very well be achievable and considered at the time of plan optimization without compromising target dose. IMPT specific dose constraints for radiation induced brain toxicity are still generally lacking, however, based on analysis of a mixed patient cohort treated with IMPT and/or PSPT for skull base HNC, our group recently suggested that brain volume receiving 67 GyRBE (RBE = 1.1) should be ≤ 0.17 cc to limit risk of toxicity [Citation13]. From treatments with PSPT alone, MacDonald et al. [Citation19] reported a 15% risk of TLN if V70GyRBE to the temporal lobes exceed 1.7 cc.
In recent years, there has been a growing awareness of the potential of NTCP models as useful tools for plan evaluation and patient selection between different treatment modalities [Citation42]. Our results suggest that the selection of dose volume predictor may not be straightforward in NTCP model fitting for proton therapy. Despite good performance and discriminative ability in the model with DMax as predictor (AUC = 0.833), the deviations in risk estimates were more than twice as large as with any of the other dose volume predictors. Although DMax previously has been suggested as predictor in NTCP models and is commonly used as dose constraints for treatment plan optimization- and evaluation, a different dose volume variable with lower predictive performance may in fact be preferable.
The RBE models from McNamara et al. [Citation6] and Wedenberg et al. [Citation7] have similarities in certain model assumptions and are partly based on analysis of the same data, which may explain the small differences in the estimated biological doses between the two. Further, Rørvik et al. [Citation43] have previously showed that RWDvar vary greatly depending on RBE models used for dose calculations, mainly due to differences in model assumptions and data used for RBE model fitting. They found that low α/β combined with elevated LET lead to the largest variations in biological dose, typically corresponding to late responding tissue at the distal edge of the target like in the current study. Therefore, in addition to the small cohort size and retrospective design, we consider the limited number of RBE models used in the analyses as the main limitation of this study. In future studies, including a wide range of different models and α/β values could better quantify the uncertainties in the assessment of risk of toxicity due to RBE variations.
In conclusion, we found systematically higher biologically effective temporal lobe doses with variable RBE models compared to doses scaled by 1.1. For the majority of dose constraints evaluated in this study, the RWDFix in general underestimated risk, while the RWDVar were in line with the proposed dose threshold associated with risk of temporal lobe necrosis. Dose volume predictors with near-maximum doses (D0.5–D2cc) were less influenced by RBE variations than Dmax. RBE variations may cause large uncertainties in assessment of risk of radiation induced toxicity. The result from the current study indicates that including RWDVar as part of IMPT treatment plan evaluation may provide valuable clinical information in terms of temporal lobe protection and should be prospectively studied and validated.
Supplemental Material
Download MS Word (1.1 MB)Disclosure statement
Engeseth has nothing to disclose. Hysing has nothing to disclose. Yepes has nothing to disclose. Pettersen has nothing to disclose. Mohan has nothing to disclose. Fuller reports grants from National Institutes of Health, grants, personal fees, nonfinancial support and other from Elekta AB, personal fees from American Association of Physicists in Medicine, personal fees from Oregon Health & Science University, outside the submitted work. Stokkevåg has nothing to disclose. Wu has nothing to disclose. Zhang has nothing to disclose. Dr. Frank reports grants from Hitachi, personal fees from Varian, grants from Eli Lilly, personal fees from Boston Scientific, outside the submitted work. Dr Gunn has nothing to disclose.
Additional information
Funding
References
- International Commission on Radiation Units and Measurements. Report 78: prescribing, recording and reporting Proton-Beam therapy. Oxford: International Commission on Radiation Units and Measurements; 2007.
- Paganetti H, Blakely E, Carabe-Fernandez A, et al. Report of the AAPM TG-256 on the relative biological effectiveness of proton beams in radiation therapy. Med Phys. 2019;46(3):e53–e78.
- Paganetti H. Relative biological effectiveness (RBE) values for proton beam therapy. Variations as a function of biological endpoint, dose, and linear energy transfer. Phys Med Biol. 2014;59(22):R419–R472.
- Carabe A, Moteabbed M, Depauw N, et al. Range uncertainty in proton therapy due to variable biological effectiveness. Phys Med Biol. 2012;57(5):1159–1172.
- Carabe-Fernandez A, Dale RG, Jones B. The incorporation of the concept of minimum RBE (RbEmin) into the linear-quadratic model and the potential for improved radiobiological analysis of high-LET treatments. Int J Radiat Biol. 2007;83(1):27–39.
- McNamara AL, Schuemann J, Paganetti H. A phenomenological relative biological effectiveness (RBE) model for proton therapy based on all published in vitro cell survival data. Phys Med Biol. 2015;60(21):8399–8416.
- Wedenberg M, Lind BK, Hardemark B. A model for the relative biological effectiveness of protons: the tissue specific parameter alpha/beta of photons is a predictor for the sensitivity to LET changes. Acta Oncol. 2013;52(3):580–588.
- Wilkens JJ, Oelfke U. A phenomenological model for the relative biological effectiveness in therapeutic proton beams. Phys Med Biol. 2004;49(13):2811–2825.
- Giantsoudi D, Adams J, MacDonald S, et al. Can differences in linear energy transfer and thus relative biological effectiveness compromise the dosimetric advantage of intensity-modulated proton therapy as compared to passively scattered proton therapy? Acta Oncol. 2018;57(9):1259–1264.
- Oden J, Eriksson K, Toma-Dasu I. Incorporation of relative biological effectiveness uncertainties into proton plan robustness evaluation. Acta Oncol. 2017;56(6):769–778.
- Wedenberg M, Toma-Dasu I. Disregarding RBE variation in treatment plan comparison may lead to bias in favor of proton plans. Med Phys. 2014;41(9):091706.
- NHI. NCI Common Terminology Criteria for Adverse Events (CTCAE): National Cancer Institute; 2010. Available from: https://evs.nci.nih.gov/ftp1/CTCAE/CTCAE_4.03/CTCAE_4.03_2010-06-14_QuickReference_5x7.pdf.
- Engeseth GM, Stieb S, Mohamed ASR, et al. Outcomes and patterns of radiation associated brain image changes after proton therapy for head and neck skull base cancers. Radiother Oncol. 2020;151:119–125.
- Huang J, Kong FF, Oei RW, et al. Dosimetric predictors of temporal lobe injury after intensity-modulated radiotherapy for T4 nasopharyngeal carcinoma: a competing risk study. Radiat Oncol. 2019;14(1):31.
- Kitpanit S, Lee A, Pitter KL, et al. Temporal lobe necrosis in head and neck cancer patients after proton therapy to the skull base. Int J Part Ther. 2020;6(4):17–28.
- Kong C, Zhu XZ, Lee TF, et al. LASSO-based NTCP model for radiation-induced temporal lobe injury developing after intensity-modulated radiotherapy of nasopharyngeal carcinoma. Sci Rep. 2016;6:26378.
- Lawrence YR, Li XA, el Naqa I, et al. Radiation dose-volume effects in the brain. Int J Radiat Oncol Biol Phys. 2010;76(3):S20–S27.
- Lee AW, Ng WT, Pan JJ, et al. International guideline on dose prioritization and acceptance criteria in radiation therapy planning for nasopharyngeal carcinoma. Int J Radiat Oncol Biol Phys. 2019;105(3):567–580.
- McDonald MW, Linton OR, Calley CS. Dose-volume relationships associated with temporal lobe radiation necrosis after skull base proton beam therapy. Int J Radiat Oncol Biol Phys. 2015;91(2):261–267.
- Niyazi M, Niemierko A, Paganetti H, et al. Volumetric and actuarial analysis of brain necrosis in proton therapy using a novel mixture cure model. Radiother Oncol. 2020;142:154–161.
- Su SF, Huang SM, Han F, et al. Analysis of dosimetric factors associated with temporal lobe necrosis (TLN) in patients with nasopharyngeal carcinoma (NPC) after intensity modulated radiotherapy. Radiat Oncol. 2013;8(1):17.
- Su SF, Huang Y, Xiao WW, et al. Clinical and dosimetric characteristics of temporal lobe injury following intensity modulated radiotherapy of nasopharyngeal carcinoma. Radiother Oncol. 2012;104(3):312–316.
- Sun Y, Zhou GQ, Qi ZY, et al. Radiation-induced temporal lobe injury after intensity modulated radiotherapy in nasopharyngeal carcinoma patients: a dose-volume-outcome analysis. BMC Cancer. 2013;13:397.
- Wang J, Miao Y, Ou X, et al. Development and validation of a model for temporal lobe necrosis for nasopharyngeal carcinoma patients with intensity modulated radiation therapy. Radiat Oncol. 2019;14(1):42.
- Wen D-W, Lin L, Mao Y-P, et al. Normal tissue complication probability (NTCP) models for predicting temporal lobe injury after intensity-modulated radiotherapy in nasopharyngeal carcinoma: a large registry-based retrospective study from China. Radiother Oncol. 2021;157:99–105.
- Zeng L, Huang SM, Tian YM, et al. Normal tissue complication probability model for radiation-induced temporal lobe injury after intensity-modulated radiation therapy for nasopharyngeal carcinoma. Radiology. 2015;276(1):243–249.
- Zhou GQ, Yu XL, Chen M, et al. Radiation-induced temporal lobe injury for nasopharyngeal carcinoma: a comparison of intensity-modulated radiotherapy and conventional two-dimensional radiotherapy. PloS One. 2013;8(7):e67488.
- Zhou X, Ou X, Xu T, et al. Effect of dosimetric factors on occurrence and volume of temporal lobe necrosis following intensity modulated radiation therapy for nasopharyngeal carcinoma: a case-control study. Int J Radiat Oncol Biol Phys. 2014;90(2):261–269.
- Wang YX, King AD, Zhou H, et al. Evolution of radiation-induced brain injury: MR imaging-based study. Radiology. 2010;254(1):210–218.
- Sun Y, Yu X-L, Luo W, et al. Recommendation for a method and atlas of organs at risk in nasopharyngeal carcinoma patients receiving intensity-modulated radiotherapy. Radiother Oncol. 2014;110(3):390–397.
- Yepes P, Randeniya S, Taddei PJ, et al. A Track-Repeating algorithm for fast Monte Carlo dose calculations of proton radiotherapy. Nucl Technol. 2009;168(3):736–740.
- Yepes PP, Eley JG, Liu A, et al. Validation of a track repeating algorithm for intensity modulated proton therapy: clinical cases study. Phys Med Biol. 2016;61(7):2633–2645.
- Yepes PP, Mirkovic D, Taddei PJ. A GPU implementation of a track-repeating algorithm for proton radiotherapy dose calculations. Phys Med Biol. 2010;55(23):7107–7120.
- Cortes-Giraldo MA, Carabe A. A critical study of different monte carlo scoring methods of dose average linear-energy-transfer maps calculated in voxelized geometries irradiated with clinical proton beams. Phys Med Biol. 2015;60(7):2645–2669.
- Agostinelli S, Allison J, Amako K, et al. Geant4—a simulation toolkit. Nucl Instrum Methods Phys Res, Sect A. 2003;506(3):250–303.
- Frese MC, Wilkens JJ, Huber PE, et al. Application of constant vs. variable relative biological effectiveness in treatment planning of intensity-modulated proton therapy. Int J Radiat Oncol Biol Phys. 2011;79(1):80–88.
- Feng M, Huang Y, Fan X, et al. Prognostic variables for temporal lobe injury after intensity modulated-radiotherapy of nasopharyngeal carcinoma. Cancer Med. 2018;7(3):557–564.
- Lambrecht M, Eekers DBP, Alapetite C, work package 1 of the taskforce “European Particle Therapy Network” of ESTRO, et al. Radiation dose constraints for organs at risk in neuro-oncology; the european particle therapy network consensus. Radiother Oncol. 2018;128(1):26–36.
- Team RC. R: a language and environment for statistical computing vienna. Austria: R Foundation for Statistical Computing; 2020. Available from: https://www.R-project.org/.
- Harrell FEJ. rms: Regression Modeling Strategies. R package version 6.1-0 2020. Available from: https://CRAN.R-project.org/package=rms.
- Yepes P, Adair A, Frank SJ, et al. Fixed-versus variable-RBE computations for intensity modulated proton therapy. Adv Radiat Oncol. 2018;4(1):156–167.
- Widder J, van der Schaaf A, Lambin P, et al. The quest for evidence for proton therapy: Model-Based approach and precision medicine. Int J Radiat Oncol Biol Phys. 2016;95(1):30–36.
- Rørvik E, Fjaera LF, Dahle TJ, et al. Exploration and application of phenomenological RBE models for proton therapy. Phys Med Biol. 2018;63(18):185013.