
Abstract
Objective: This study aimed to explore the association of matrix metalloproteinases (MMPs) and tissue inhibitors of metalloproteinases (TIMPs) with cancer progression and prognosis in head and neck squamous cell carcinoma (HNSCC).
Methods: Differentially expressed genes (DEGs) were identified by LIMMA package using R software. The correlation between the expression levels of MMPs and TIMPs in HNSCC cancer samples and adjacent normal tissue samples was performed using Pearson correlation analysis. The Kruskal-Wallis test (H-test) was used to determine the association between the expression level of MMPs/TIMPs and HNSCC clinical stage. The survival result was expressed as a KM curve, and the log-rank test was used for statistical analysis. Lasso regression and multivariate Cox regression analyses were used to examine whether the gene signature based on MMPs and TIMPs was an independent prognostic factor in patients with HNSCC.
Results: Among the top 10 most up-regulated genes in HNSCC cancer tissues when compared with normal tissues, six genes belonged to the MMPs. Spearman correlation analysis revealed that only MMP11 and MMP23B were positively correlated with tumor stage. Survival analysis showed that patients with a high expression of MMP14, MMP20, TIMP1, and TIMP4 had a worse prognosis than low expression patients. Additionally, a novel five-gene (MMP3, MMP17, MMP19, MMP24, and TIMP1) signature was constructed and significantly associated with prognosis as an independent prognostic signature.
Conclusions: Our data show that the accuracy of a single gene of MMP or TIMP as predictors of progression and prognosis of HNSCC is limited, although some studies have proposed that MMPs act as driving factors for cancer progression. The prediction performance of the five-gene signature prediction model was much better than that of the gene signatures based on every single gene in prognosis prediction.
Introduction
Head and neck squamous cell carcinoma (HNSCC) is the sixth most common malignancy worldwide, with approximately 890,000 new cases and 450,000 deaths reported per year [Citation1]. Despite significant advances in the clinical treatment of HNSCC, the prognosis of patients with HNSCC has not significantly improved, and the 5-year survival rate in patients with HNSCC has remained at 50% for several decades [Citation2]. The absence of simple and effective diagnostic indicators and recognizable early symptoms are major causes of mortality. Approximately one of three patients with HNSCC are diagnosed at an advanced stage [Citation3,Citation4]. The 5-year survival rate in patients diagnosed with early-stage HNSCC is approximately 80%, whereas that in patients diagnosed with advanced-stage HNSCC is <20% [Citation5,Citation6]. Thus, it is critical to identify reliable diagnostic and prognostic biomarkers for HNSCC diagnosis at an early stage. Biomarkers of prognostic factors and risk stratification are important for defining treatment strategies, comparing the outcome of therapeutic trials and predicting survival from diagnosis. With advances in genomic and transcriptome sequencing technologies, an increasing number of prognostic genes associated with tumor progression or poor prognosis have been identified. Screening of differentially expressed genes (DEGs) between tumor tissues and adjacent normal tissues is one of the first and foremost steps to identify potential prognostic genes. An analysis of the mRNA expression data from The Cancer Genome Atlas (TCGA) database revealed that among the 10 most highly upregulated genes in HNSCC samples compared with matched normal tissues, six genes belonged to matrix metalloproteinases (MMPs), namely, MMP1, MMP11, MMP9, MMP10, MMP3, and MMP12. Therefore, we speculate that the MMP family may play an important and unique role in the occurrence and progression of HNSCC. Several studies have reported the role of single or multiple MMPs in HNSCC [Citation7–10]. However, to the best of our knowledge, no study has reported the expression patterns and prognostic significance of all MMPs in HNSCC. Moreover, due to the small sample size in previous studies, the expression patterns and prognostic value of MMPs in HNSCC are limited and controversial.
MMPs are a family member of calcium- and zinc-dependent endopeptidases involved in extracellular matrix (ECM) proteins, including collagen, fibronectin, laminin, elastin, and proteoglycans [Citation11,Citation12]. Because of their ability to degrade the ECM, MMPs are elevated in several human patient tumor samples, including ovarian cancer [Citation13,Citation14], prostate cancer [Citation15], and breast cancer [Citation16], and MMP levels are positively correlated with cancer progression. To date, 24 members of the MMP family have been identified in humans, as summarized in Figure S1. Of note, the terms MMP4, MMP5, MMP6, MMP18, and MMP22 are not used in humans because they correspond to MMP17, MMP24, MMP25, MMP19, and MMP27, respectively. In addition, there are two equivalent forms of MMP23 (MMP23A and MMP23B) in humans that are encoded by two distinct genes, and MMP23A is a pseudogene [Citation17]. According to their structure and substrate specificities, MMP gene family can be classified into subgroups of collagenases (−1, −8 and −13), stromelysins (−3, −10 and −11), gelatinases (−2 and −9), matrilysins (−7 and −26), membrane-type (-14, −15, −16, −17, −23, −24 and −25), and other MMPs (−12, −19, −20, −21, −27 and −28) [Citation18,Citation19]. Further, a corresponding family named tissue inhibitors of metalloproteinases (TIMPs), which include four members (TIMP1 to TIMP4), are natural inhibitors of MMPs [Citation20,Citation21]. ECM integrity and remodeling depend on the dynamic balance between remodeling enzymes (MMPs) and their inhibitors (TIMPs) [Citation22,Citation23]. Likewise, studies on the expression of TIMPs in HNSCC and their roles in prognosis are limited, and their results are controversial.
In this study, we utilized bioinformatics approaches to systematically investigate the expression patterns of every member of MMPs and TIMPs in HNSCC. We further explored the correlation between the expression levels of MMPs/TIMPs and the clinicopathological features and prognosis in HSNCC. Finally, Cox proportional hazards models were used to determine if gene expression variables of MMPs/TIMPs were predictive of the prognosis prediction model for patients with HNSCC.
Methods
Data source and pre-processing
The RNA-seq transcriptome data of patients with HNSCC and the corresponding clinical data were downloaded from the TCGA data portal (https://portal.gdc.cancer.gov/). The HNSCC dataset consisted of 500 tumor samples and 44 normal tissues as of 1 March 2021, which contain 43 matched tumor-normal sample pairs. RNA-sequencing data was normalized by transcript per million (TPM), and gene expression was calculated as log2 (TPM + 1). For all analyses, log2(TPM + 1) units were used. Time to event for overall survival (given in days) was defined as the time from diagnosis until the time of death, or until last contact if the patient was still alive.
Deg analysis and functional enrichment analysis
DEG analysis was applied with the ‘Limma’ package [Citation24] in R software on the TCGA HNSCC transcriptome file. Genes with |log2 fold change (FC)|≥1 and adjusted p < .05 were considered significant DEGs. To identify the biological processes and signaling pathways of DEGs, we performed an analysis of Gene Ontology (GO) and pathway enrichment using the Kyoto Encyclopedia of Genes and Genomes (KEGG) with the DAVID online tools (http://david.ncifcrf.gov/). GO items with FDR ≤ 0.001 and |log2Ratio|≥1 were identified as enriched GO items. Pathways with FDR ≤ 0.01 were defined as significantly enriched pathways. Protein-protein interactions (PPI) were analyzed using the Retrieval of Interacting Genes/Proteins (STRING) database (http://string-db.org), including known and predicted protein-protein systemic functions [Citation25].
Correlation analysis of gene expression of MMPs and TIMPs
The correlation between the expression levels of MMPs and TIMPs in HNSCC cancer samples and adjacent normal tissue samples was performed using Pearson correlation analysis. Statistical significance was set at p < .05. Principal component analysis (PCA) was performed based on the gene expression of MMPs and TIMPs in HNSCC and adjacent normal tissue samples.
Genomic alterations analysis of MMPs and TIMPs in HNSCC
The frequency of MMP and TIMP family gene alterations in HNSCC was obtained from cBioPortal (https://www.cbioportal.org/) [Citation26]. cBioPortal is an open web‐based database for exploring multidimensional cancer genomic information obtained from cancer samples. The OncoPrint schematic was constructed in cBioPortal (TCGA) to directly reflect all types of alterations, such as amplification, deep deletion, mRNA upregulation, and mRNA downregulation in each MMP and TIMP gene in patients with HNSCC. Additionally, Kaplan–Meier (KM) survival curves were drawn in cBioPortal to evaluate the influence of MMP and TIMP alterations on the overall and disease-free survival of the patients with HNSCC.
Association between gene expression levels and clinicopathological features of patients with HNSCC
The Kruskal–Wallis test (H-test) was used to determine the association between the expression level of MMPs/TIMPs and HNSCC clinical stage (p < .05). Spearman rank tests were used to assess the correlations between the expression levels of MMPs/TIMPs and the clinical stage of patients with HNSCC. The survival result was expressed as a KM curve, and the log-rank test was used for statistical analysis; the level of significance was set at p < .05.
Construction of the prognosis model
Lasso regression and multivariate Cox regression analyses were used to examine whether the gene signature based on MMPs and TIMPs was an independent prognostic factor in patients with HNSCC. Five hundred HNSCC samples obtained from TCGA were randomized as a training (n = 350) or validation (n = 150) cohort, (ratio, 7:3). In the first step, we used data of the training set and took the least absolute shrinkage and selection operator (LASSO) regression method to analyze the data. Lasso regression analysis with L1-penalty was performed using the ‘survival’ and ‘glmnet’ package [Citation27]. In the LASSO Cox regression algorithm, the best penalty parameter λ and corresponding coefficients were determined by 10-fold cross-validation based on the minimum criteria.
After the survival-associated genes were screened by LASSO regression analysis, multivariate Cox regression analysis was performed to establish a risk score. Based on multivariate Cox proportional regression analysis, the variables with p < .05 were used to establish a prognosis model. The risk score was calculated as follows: Risk Score = Exp (mRNA1) × β1 + Exp (mRNA2) × β2 +⋯+ Exp (mRNAn) × βn. Of note, Exp(i) is the expression value of gene I, and the expression level was calculated as log2 (TPM + 1).
The patients were divided into low- and high-risk groups based on their median risk score. Further, the R software package ‘timeROC’ was used to perform ROC analysis of the risk scores prognosis classification to analyze the classification efficiency of the prognosis predictions for 1 year, 3 years and 5 years.
Statistical analysis
All statistical analyses were performed using R version 4.0.5 (SPSS Inc., Chicago, IL, USA). Unless otherwise noted, a p-value of < .05 was considered statistically significant.
Results
Deg analysis between HNSCC tumor and adjacent normal tissues and functional enrichment analysis of DEGs
First, we performed DEG analyses between 43 HNSCC tumor samples and 43 corresponding normal tissues. A total of 2101 DEGs were identified, including 1535 upregulated genes and 566 downregulated genes. As shown in the volcano plot (), among the 10 most upregulated genes (CA9, COL10A1, MMP1, INHBA, MMP11, MMP9, ADAM12, MMP10, MMP3 and MMP12), six genes belonged to the MMPs family. All DEGs were visualized using a clustering heat map (), which showed a clear separation between HSNCC tumor tissues and adjacent normal tissues.
Figure 1. Differentially expressed gene (DEG) analysis between HNSCC tumor and adjacent normal tissues. (A) Volcano plot for the differential expressed genes; (B) the heatmap represents the mRNA expression levels of 2101 DEGs in 43 of HNSCC tumor tissue and 43 of adjacent normal tissues; (C) GO and (D) KEGG enrichment analysis results of 1535 up-regulated genes; (E) GO and (F) KEGG enrichment analysis results of 566 down-regulated genes.
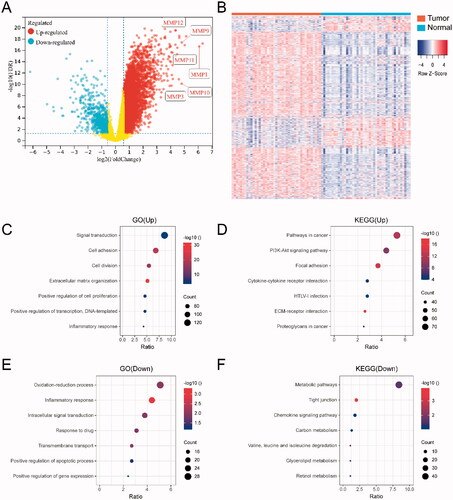
To gain further insight into the biological functions of the DEGs, we conducted GO functional enrichment and KEGG pathway analyses. Regarding the 1535 upregulated genes, GO analysis () showed that the most enriched terms were ‘Signal transduction’ and ‘Cell adhesion’. KEGG pathway analysis () showed that the upregulated genes were mainly involved in pathways associated with ‘Pathways in cancer’ and ‘PI3K-Akt signaling’. Regarding the 566 downregulated genes, GO analysis () showed that the most highly enriched GO terms were ‘Oxidation-reduction process’ and ‘Inflammatory response’. KEGG pathway analysis () showed that the downregulated genes were mainly involved in pathways associated with ‘Metabolic pathways’ and ‘Tight junction’.
Expression patterns of MMPs/TIMPs in HNSCC
To understand the expression patterns of MMPs and TIMPs in HNSCC, we assessed the mRNA expression levels of MMPs and TIMPs in 500 HNSCC cancer tissues compared to those in 44 adjacent normal tissues. As shown in and Table S1, the heat map showed that the expression levels of MMP1, MMP3, MMP9, MMP10, MMP11, MMP12, and MMP13 in tumor tissues were significantly higher than those in normal tissues. The expression levels of MMP2, MMP14, and MMP28 were differentially expressed in both tumor and normal tissues. In contrast, the expression levels of MMP8, MMP16, MMP20, MMP21, MMP8, MMP16, MMP20, MMP21, MMP23A, MMP23B, and MMP26 were low or undetectable in both tumor and normal tissues. Regarding TIMPs, the heat map indicated that the expression levels of TIMP1 and TIMP2 were differentially expressed in both tumor and normal tissues, the expression level of TIMP3 was low in both tumor and normal tissues, and the expression level of TIMP4 appeared to be weaker in tumor tissue than in normal tissue. As shown in Table S1, when FDR ≤ 0.05 and log2FC ≥ 1 (upregulated) or log2FC≤ −1 (downregulated) were set as thresholds for DEGs, the expression levels of 17 of 24 MMPs, except MMP7, MMP15, MMP21, MMP23A, MMP24, MMP26, and MMP27, were upregulated in HNSCC cancer tissues compared to those in adjacent normal tissues. The expression levels of MMP27 were significantly downregulated in tumor tissues compared to those in normal tissues. However, none of the TIMPs were upregulated in HNSCC cancer tissues. In contrast, the expression levels of TIMP4 were downregulated in HNSCC cancer tissues compared to those in adjacent tissues. The above results suggested that most MMPs and TIMPs were highly expressed in HNSCC tissues compared to normal tissues.
Figure 2. Expression patterns of MMPs/TIMPs in HNSCC. (A) The heatmap represents the mRNA expression levels of MMPs and TIMPs in 500 of HNSCC tumor tissue and 44 of adjacent normal tissues; correlations of expression of MMPs/TIMPs in (B) 500 of HNSCC tumor samples and (C) 44 of adjacent normal tissue samples; (D) the correlation of each gene combination of MMPs/TIMPs in HNSCC tumor samples and adjacent normal tissue samples; (E) principal component analysis of mRNA expression of MMPs/TIMPs in 500 of HNSCC tumor samples (orange circles) and 44 adjacent normal tissue samples (blue circles) showing clear separation of the groups.
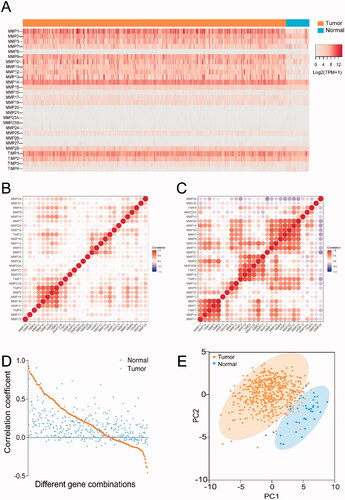
To further explore the expression features of MMPs/TIMPs in HNSCC, correlation analysis was performed to analyze the correlation of gene expression between each member of MMPs/TIMPs. Correlation analysis suggested that the gene expression correlation of each MMPs and TIMPs () was weaker in HNSCC samples than in normal samples (). In normal samples, 133 combinations with a positive correlation (r > 0.3, p < .05) and seven combinations with a negative correlation (r<−0.3, p < .05) were identified. The top three strongest correlations were MMP1–MMP3 (r = 0.9258), MMP3–TIMP1(r = 0.9200), and MMP7–MMP20 (r = 0.8926). However, only 52 combinations with a positive correlation (r > 0.3, p < .05) were identified in the HNSCC samples, and none of the combinations showed a negative correlation. The top three strongest correlations were MMP2–TIMP2 (r = 0.9054), MMP16-TIMP2 (r = 0.7621), and MMP14–TIMP2 (r = 0.73329). Moreover, for the same combination, the correlation in normal tissue was stronger than that in tumor tissues, as shown in . For example, the correlation coefficients of the combinations of MMP1–MMP2 in normal tissues and tumor tissues were 0.5043 and 0.2825, respectively. Similarly, the correlation coefficients of the combinations of MMP2-MMP3 in normal tissues and tumor tissues were 0.7339 and 0.1678, respectively. To the best of our knowledge, this is the first study to investigate this phenomenon.
Then, PCA was used to assess the differences in gene expression of MMPs and TIMPs between HNSCC and normal samples. The PCA plot () showed that cancer and normal samples were distinguishable based on differences in the expression levels of the MMPs/TIMPs, tumor tissues, and normal tissues were divided into two clusters. Taken together, the expression patterns of MMPs in cancer samples and normal samples were noticeably different in HNSCC.
Genomic alterations of MMPs/TIMPs in HNSCC
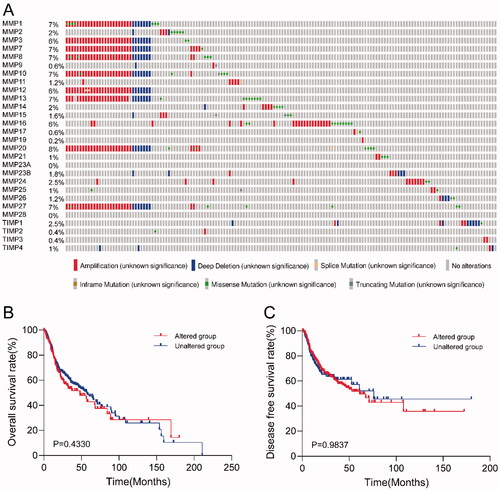
Genomic alterations of specific genes are associated with clinicopathological features and clinical outcomes in some cancer types. However, genomic alterations in MMP/TIMP genes in HNSCC have not been reported previously. Here, we analyzed the genomic alterations of every MMP/TIMP gene in 500 patients with HNSCC, including mutation, fusion, amplification, and deep deletion. As shown in , 31% (154/500) HNSCC samples harbored at least one MMP/TIMP gene alteration event, including mutation, amplification, or deep deletion. MMP20 had the highest genomic alteration frequency (8%). MMP1, MMP3, MMP7, MMP8, MMP13, and MMP27 also had a high frequency of genomic alterations. To explore whether genomic alterations of MMP/TIMP genes correlate with prognosis in patients with HNSCC, we assessed the correlation between genomic alterations and survival time. KM survival curves for overall survival () and disease-free survival () showed no significant correlation between gene alteration of MMPs/TIMPs and overall survival and disease-free survival in patients with HNSCC.
Figure 3. Genomic alteration analysis of MMPs/TIMPs in HNSCC using cBioPortal. (A) OncoPrint providing a visual summary of alteration across a set of 500 of HNSCC samples based on a query of the 28 of MMPs/TIMPs genes. Each row is taken as a gene, and each column is regarded as a sample. Bars of different colors represent different genomic alterations; (B) overall survival and (C) disease-free survival rates of the HNSCC patients with or without MMPs/TIMPs mutations. The red curves in the Kaplan–Meier plots include cases with gene alteration, and the blue curves include cases without gene alteration.
Association between the gene expression levels of MMPs/TIMPs and clinicopathological features of patients with HNSCC
After investigating the expression features of the MMP/TIMP gene family in HNSCC, we further explored the correlation between the gene expression levels of MMPs/TIMPs and clinicopathological features of patients with HNSCC. The association between the expression level of MMPs/TIMPs and the pathological clinical stage was analyzed. The expression levels of each MMP/TIMP in different pathological grades are shown in Figure S2. Only six genes, MMP11, MMP23A, MMP23B, MMP25, MMP27, and TIMP3, were differentially expressed in various clinical stages of HNSCC (Kruskal–Wallis test, p < .05). Spearman correlation analysis was performed to analyze the correlations between the expression of MMPs/TIMPs and tumor stage. The expression of only six genes was significantly associated with tumor stage (p < .05), including MMP1, MMP3, MMP11, MMP23B, MMP25, and MMP27. Among these, the increased expression levels of MMP11 and MMP23B was positively correlated with tumor stage, while the expression levels of MMP1, MMP3, MMP25, and MMP27 were negatively correlated with tumor stage.
Next, survival analysis was performed to investigate the effect of MMP/TIMP expression on patient overall survival probability using KM curves. Patients were classified into high-expression and low-expression groups according to the median value of each mRNA. The survival curves of only five genes (MMP14, MMP20, MMP25, TIMP1, and TIMP4) showed significant differences between the high-expression and low-expression groups (Figure S3). The overall survival of patients with high expression of MMP14, MMP20, TIMP1, and TIMP4 was significantly worse than that of patients with low expression of these MMPs. However, the overall survival of patients with low expression of MMP25 was significantly worse than that of patients with low expression of MMP25.
Construction of the prognostic risk prediction model based on the expression levels of MMPs/TIMPs
As shown in , based on the 10‑fold cross‑validation, the value 0.02 was chosen as the minimum criteria for λ. At the λ parameter, there were 14 genes (MMP1, MMP3, MMP11, MMP12, MMP14, MMP16, MMP17, MMP19, MMP20, MMP24, MMP26, TIMP1, TIMP2, and TIMP4) obtained with non‑zero coefficients, as shown in . These 14 genes were thus analyzed using multivariate Cox analysis to obtain each coefficient. As shown in Table S2, five candidate genes (MMP3, MMP17, MMP19, MMP24, and TIMP1) were found to meet the threshold of p < .05 and were used to construct the prognostic model. The risk score was calculated using the formula in ‘Methods’ section.
Figure 4. Construction of the prognostic risk prediction model based on the expression level of MMPs/TIMPs. (A) λ selection by 10-fold cross-validation. Continuous upright lines are partial likelihood deviance ± SE; dotted lines are depicted at the optimal values by minimum criteria (lambda.min, left vertical dotted line) and 1-SE criteria (lambda.1se, right vertical dotted line). The partial likelihood deviance with changing of log (λ) was plotted. The value was 0.02 chosen for λ by 10‑fold cross‑validation with the minimum criteria; (B) processes of LASSO Cox model fitting. Each curve represents a gene; (C) the distributions of the risk score and heatmap of eight mRNA expression profiles of HNSCC patients in training set, which are ranked by risk score; (D) Kaplan–Meier curve of overall survival probability for patients with HNSCC from training set divided into high- and low-risk groups based on the risk score of five-mRNA signature; (E) receiver operating characteristic curve (ROC) of the risk score for predicting 1-year, 3-year, and 5-year survival rate in training set; (F) Kaplan–Meier curve of overall survival probability for patients with HNSCC from validation set divided into high- and low-risk groups based on the risk score; (G) receiver operating characteristic curve (ROC) of the risk score for predicting 1-year, 3-year, and 5-year survival rate in validation set.
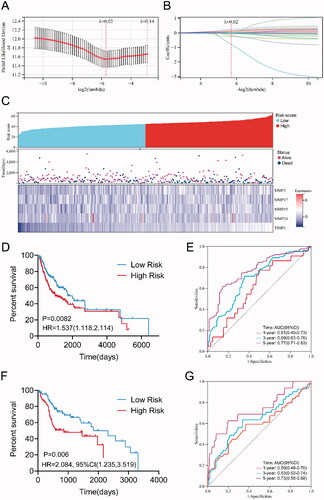
Patients with HNSCC in the training cohort (n = 350) were classified into high-risk and low-risk groups according to the median value of the risk score = 44.8852, as shown in . We then evaluated the survival in the high-risk and low-risk groups, as shown in and found that the survival time in the high-risk group was significantly shorter than that in the low-risk group (p = .0082, log-rank test). The ROC curve for predicting 5-year survival time was used to evaluate the predictive ability of our prognostic model, as shown in , and the area under the curve (AUC) value (AUC = 0.77) was >0.7, which is considered reliable and higher than the AUC for each univariate model (each MMP/TIMP gene, Figure S4). With regarding to the validation dataset, high risk group(n = 63) also showed significantly lower survival ration in comparison with the low risk group (n = 87) (p = .006, log-rank test), as shown in . Meanwhile, the AUC of 5-year ROC of validation dataset was 0.73. The results indicated that this predictive model based on the expression levels of the five-gene signature had a better predictive performance than that of every single gene.
Discussion
In the emerging era of precision medicine, it is critical to identify biomarkers that can robustly and reliably predict the disease course and outcome in patients with cancer. However, there is a lack of precise biomarkers for predicting prognosis in HNSCC, which is a heterogeneous group of malignancies caused by multiple distinct etiologies. To the best of our knowledge, our study is the first to report that six of the top 10 most upregulated genes belong to the MMP family (MMP1, MMP11, MMP9, MMP10, MMP3, and MMP12). Therefore, we speculated that the MMP family may play an important role in the development and progression of HNSCC. To investigate the role of MMPs/TIMPs in the progression of HNSCC, we first explored the expression profiles of MMPs/TIMPs in HNSCC and adjacent normal tissues. We found that 17 of 24 MMPs (except MMP7, MMP 15, MMP21, MMP23A, MMP24, MMP26, and MMP27) were upregulated in HNSCC cancer tissues compared with those in normal tissues. This finding is in good agreement with that of previous studies [Citation7,Citation28–31]. In a study by Ye et al. [Citation28] evaluating 53 primary HNSCC and 22 matching normal tissues, the expression levels of MMP1, MMP12, MMP10, MMP3, MMP7, MMP9, MMP11, and MMP13 were upregulated in HNSCC tissues compared to those in normal tissues. Moreover, Hauff et al. [Citation29] reported that multiple MMPs including MMP2/9 were found to be upregulated in the HNSCC tumor than matched normal tissue. In patients with human papilloma virus positive (HPV+) tumors, higher MMP2 and MMP14 expression correlates with worse 5-year survival. Furthermore, Stokes et al. [Citation30] investigated the expression profiling of MMPs and TIMPs in 83 HNSCC tumor tissues and 13 normal tissues and found that most MMPs were upregulated in HNSCC tumor tissues, both in the center and the invasive margin of the tumor, compared to those in normal tissues. They also reported that MMP27 was the only MMP with significantly decreased expression in HNSCC tumor tissues compared to that in adjacent tissues. Our results are consistent with this result.
Given the pleiotropic roles of MMPs in cancer transformation and metastasis, MMP inhibitors have attracted considerable clinical interest, and many MMP inhibitors have been designed over the past 30 years. However, none of the broad-spectrum inhibitors have exhibited significant therapeutic effects in previous human clinical trials [Citation32–36]. This is largely due to the fact that our understanding of MMP biology is limited. Although extensive evidence indicates that MMPs can promote cancer progression through ECM degradation [Citation37–41], increasing evidence indicates that the expression of certain MMPs provides a paradoxical protective effect in multiple stages of cancer progression [Citation42–47]. Research on MMPs and TIMPs has produced more complex findings. Chirco et al. [Citation48] found that TIMPs have multiple effects on cell proliferation, differentiation, angiogenesis, and survival during tumor progression through an MMP-independent mechanism. Moreover, studies have suggested that MMP inhibitors promote cancer progression instead of cancer inhibition [Citation33,Citation49–53].
In this study, we comprehensively analyzed the differential expression of MMPs/TIMPs in HNSCC tumor and adjacent normal tissues, the correlation between MMP/TIMP expression and clinicopathological stage, and the impact of MMP/TIMP mRNA expression on survival in patients with HNSCC. To provide more intuitive insight into the effect of MMPs/TIMPs on the clinical features of patients with HNSCC, a Sankey diagram () was constructed to summarize our main findings. Tumor-overexpressed genes are often associated with the development and progression of cancer and are correlated with poor prognosis. However, in our study, we found that although the expression of most MMPs was upregulated in tumor tissues, only MMP11 and MMP23B were significantly and positively correlated with pathological stage. For tumor lower expression genes, MMP27 and TIMP4, MMP27 expression was negatively correlated with clinical stage, but not with overall survival. However, TIMP4 expression was negatively correlated with overall survival, but not with clinical stage. Although MMP25 was highly expressed in tumor tissues compared to that in adjacent normal tissues, the expression of MMP25 was negatively associated with tumor grade, and high MMP25 expression predicted a good prognosis for patients with HNSCC. The above results indicated that the gene expression profiles of a single gene of MMPs/TIMPs may not be a good predictor of the progression and prognosis of HNSCC. The construction of the PPI network () revealed that the MMP and TIMP components form a complex interaction network. It has been suggested that TIMPs are coregulated with MMPs, and high MMP activity would induce high TIMP activity [Citation54]. TIMPs are also required for MMP activation; TIMP2 and MMP14 form an activation complex for MMP2 [Citation55]. The positive regulation of MMP activity are presumably more complicated [Citation56–59]. Nyberg et al. [Citation56] reported that various human cancer cells express tumor-associated trypsinogen-2, which can efficiently activate MMPs in vitro. Rather unexpectedly, Nieminen et al. [Citation57] indicated that Oral microbes, for example Treponema denticola (Td), are also participate in the regulation of MMPs activity. One of the key virulence factors of Td is a cell surface-bound chymotrypsin-like proteinase (CTLP), which was found to convert pro MMP-8 and −9 into their active forms. In addition, Td-CTLP was able to degrade the proteinase inhibitors TIMP-1, TIMP-2.
Figure 5. The summary of the effect of expression of MMPs/TIMPs on HNSCC progression. (A) Sankey diagram summarized the relation of each MMPs/TIMPs expression with HNSCC progression and prognosis; (B) protein–protein interaction network of 24 MMPs genes and 4 TIMPs.
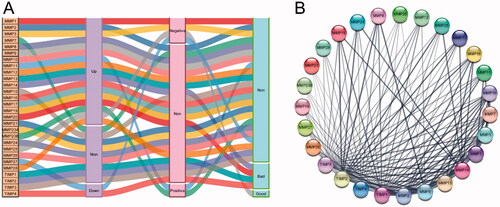
Overall, the physiological balance between degradation and deposition of the ECM is maintained by MMPs and TIMPs. The impaired balance between MMPs and TIMPs could result in the migration and invasion of cancer cells. Therefore, a single MMP or TIMP gene cannot accurately predict disease progression. Further studies are needed to decipher the influence of MMPs and TIMPs on the tumorigenesis and progression of HNSCC. In this study, we constructed an adequate risk assessment model based on the expression levels of five genes of MMPs/TIMPs, including MMP3, MMP17, MMP19, MMP24, and TIMP1. The five-gene signature displayed a good predictive value for overall survival in patients with HNSCC.
Conclusions
Collectively, our study presents a comprehensive analysis of the expression profile of MMPs/TIMPs and their implications for the progression and prognosis of HNSCC. Our results revealed that the correlation between the expression level of MMPs/TIMPs genes and the progression and prognosis in patients with HNSCC was not very significant. A five-gene signature (MMP3, MMP17, MMP19, MMP24, and TIMP1) was constructed using Lasso and multivariate Cox regression analyses. The prediction performance of the five-gene signature prediction model was much better than that of the gene signatures based on every single MMP/TIMP gene in prognosis prediction.
Supplemental Material
Download MS Word (18.9 KB)Supplemental Material
Download MS Word (1.4 MB)Acknowledgments
Mingyuan Zou, Chen Zhang and Yan Sun contributed equally to this work.
Disclosure statement
The authors declare that they have no competing interests.
Additional information
Funding
References
- Johnson DE, Burtness B, Leemans CR, et al. Head and neck squamous cell carcinoma. Nat Rev Dis Primers. 2020;6(1):92.
- Li Q, Li Y, Wang Y, et al. Oral administration of bifidobacterium breve promotes antitumor efficacy via dendritic cells-derived interleukin 12. Oncoimmunology. 2021;10(1):1868122.
- Hashim D, Genden E, Posner M, et al. Head and neck cancer prevention: from primary prevention to impact of clinicians on reducing burden. Ann Oncol. 2019;30(5):744–756.
- Jou A, Hess J. Epidemiology and molecular biology of head and neck cancer. Oncol Res Treat. 2017;40(6):328–332.
- Du E, Mazul AL, Farquhar D, et al. Long-term survival in head and neck cancer: impact of site, stage, smoking, and human papillomavirus status. Laryngoscope. 2019;129(11):2506–2513.
- Marur S, Forastiere AA. Head and neck squamous cell carcinoma: update on epidemiology, diagnosis, and treatment. Mayo Clin Proc. 2016;91(3):386–396.
- Bates AM, Gomez Hernandez MP, Lanzel EA, et al. Matrix metalloproteinase (mmp) and immunosuppressive biomarker profiles of seven head and neck squamous cell carcinoma (hnscc) cell lines. Transl Cancer Res. 2018;7(3):533–542.
- Iizuka S, Ishimaru N, Kudo Y. Matrix metalloproteinases: the gene expression signatures of head and neck cancer progression. Cancers (Basel). 2014;6(1):396–415.
- Stanciu AE, Zamfir-Chiru-Anton A, Stanciu MM, et al. Serum level of matrix metalloproteinase-9 in patients with head and neck squamous cell carcinoma. Clin Lab. 2016;62(8):1569–1574.
- Stanciu AE, Zamfir-Chiru-Anton A, Stanciu MM, et al. Imbalance between matrix metalloproteinases and tissue inhibitors of metalloproteinases promotes invasion and metastasis of head and neck squamous cell carcinoma. Clin Lab. 2017;63(10):1613–1620.
- Cabral-Pacheco GA, Garza-Veloz I, Castruita-De la Rosa C, et al. The roles of matrix metalloproteinases and their inhibitors in human diseases. Int J Mol Sci. 2020;21(24):9739.
- Laronha H, Caldeira J. Structure and function of human matrix metalloproteinases. Cells. 2020;9(5):1076.
- Carey P, Low E, Harper E, et al. Metalloproteinases in ovarian cancer. Int J Mol Sci. 2021;22(7):3403.
- Zou M, Du Y, Liu R, et al. Nanocarrier-delivered small interfering rna for chemoresistant ovarian cancer therapy. Wiley Interdiscip Rev RNA. 2021;12:e1648.
- Geng X, Chen C, Huang Y, et al. The prognostic value and potential mechanism of matrix metalloproteinases among prostate cancer. Int J Med Sci. 2020;17(11):1550–1560.
- Jiang H, Li H. Prognostic values of tumoral mmp2 and mmp9 overexpression in breast cancer: a systematic review and meta-analysis. BMC Cancer. 2021;21(1):149.
- Gonzalez-Avila G, Sommer B, Mendoza-Posada DA, et al. Matrix metalloproteinases participation in the metastatic process and their diagnostic and therapeutic applications in cancer. Crit Rev Oncol Hematol. 2019;137:57–83.
- Olejarz W, Lacheta D, Kubiak-Tomaszewska G. Matrix metalloproteinases as biomarkers of atherosclerotic plaque instability. Int J Mol Sci. 2020;21(11):3946.
- Riihila P, Nissinen L, Kahari VM. Matrix metalloproteinases in keratinocyte carcinomas. Exp Dermatol. 2021;30(1):50–61.
- Murphy G. Tissue inhibitors of metalloproteinases. Genome Biol. 2011;12(11):233.
- Bourboulia D, Stetler-Stevenson WG. Matrix metalloproteinases (mmps) and tissue inhibitors of metalloproteinases (timps): positive and negative regulators in tumor cell adhesion. Semin Cancer Biol. 2010;20(3):161–168.
- Salimi Sartakhti J, Manshaei MH, Sadeghi M. Mmp-timp interactions in cancer invasion: an evolutionary game-theoretical framework. J Theor Biol. 2017;412:17–26.
- Deng B, Ren JZ, Meng XQ, et al. Expression profiles of mmp-1 and timp-1 in lumbar intervertebral disc degeneration. Genet Mol Res. 2015;14(4):19080–19086.
- Diboun I, Wernisch L, Orengo CA, et al. Microarray analysis after rna amplification can detect pronounced differences in gene expression using limma. BMC Genomics. 2006;7(1):252.
- Szklarczyk D, Gable AL, Nastou KC, et al. The string database in 2021: customizable protein-protein networks, and functional characterization of user-uploaded gene/measurement sets. Nucleic Acids Res. 2021;49(D1):D605–D612.
- Gao J, Aksoy BA, Dogrusoz U, et al. Integrative analysis of complex cancer genomics and clinical profiles using the cbioportal. Sci Signal. 2013;6(269):pl1.
- Engebretsen S, Bohlin J. Statistical predictions with glmnet. Clin Epigenet. 2019;11(1):123.
- Ye H, Yu T, Temam S, et al. Transcriptomic dissection of tongue squamous cell carcinoma. BMC Genomics. 2008;9:69.
- Hauff SJ, Raju SC, Orosco RK, et al. Matrix-metalloproteinases in head and neck carcinoma-cancer genome atlas analysis and fluorescence imaging in mice. Otolaryngol Head Neck Surg. 2014;151(4):612–618.
- Stokes A, Joutsa J, Ala-Aho R, et al. Expression profiles and clinical correlations of degradome components in the tumor microenvironment of head and neck squamous cell carcinoma. Clin Cancer Res. 2010;16(7):2022–2035.
- Pyeon D, Newton MA, Lambert PF, et al. Fundamental differences in cell cycle deregulation in human papillomavirus-positive and human papillomavirus-negative head/neck and cervical cancers. Cancer Res. 2007;67(10):4605–4619.
- Milner JM, Cawston TE. Matrix metalloproteinase knockout studies and the potential use of matrix metalloproteinase inhibitors in the rheumatic diseases. Curr Drug Targets Inflamm Allergy. 2005;4(3):363–375.
- Coussens LM, Fingleton B, Matrisian LM. Matrix metalloproteinase inhibitors and cancer: trials and tribulations. Science. 2002;295(5564):2387–2392.
- Owyong M, Chou J, van den Bijgaart RJ, et al. Mmp9 modulates the metastatic Cascade and immune landscape for breast cancer anti-metastatic therapy. Life Sci Alliance. 2019;2(6):e201800226.
- Vandenbroucke RE, Libert C. Is there new hope for therapeutic matrix metalloproteinase inhibition?. Nat Rev Drug Discov. 2014;13(12):904–927.
- Hu J, Van den Steen PE, Sang QX, et al. Matrix metalloproteinase inhibitors as therapy for inflammatory and vascular diseases. Nat Rev Drug Discov. 2007;6(6):480–498.
- Eiro N, Cid S, Aguado N, et al. Mmp1 and mmp11 expression in peripheral blood mononuclear cells upon their interaction with breast cancer cells and fibroblasts. Int J Mol Sci. 2020; 22(1):371.
- Azevedo Martins JM, Rabelo-Santos SH, do Amaral Westin MC, et al. Tumoral and stromal expression of mmp-2, mmp-9, mmp-14, timp-1, timp-2, and vegf-a in cervical cancer patient survival: a competing risk analysis. BMC Cancer. 2020;20(1):660.
- Scheau C, Badarau IA, Costache R, et al. The role of matrix metalloproteinases in the epithelial-mesenchymal transition of hepatocellular carcinoma. Anal Cell Pathol (Amst). 2019;2019:9423907.
- Olivares-Urbano MA, Grinan-Lison C, Zurita M, et al. Matrix metalloproteases and timps as prognostic biomarkers in breast cancer patients treated with radiotherapy: a pilot study. J Cell Mol Med. 2020;24(1):139–148.
- Farina AR, Mackay AR. Gelatinase b/mmp-9 in tumour pathogenesis and progression. Cancers (Basel). 2014;6(1):240–296.
- Wang S, Jia J, Liu D, et al. Matrix metalloproteinase expressions play important role in prediction of ovarian cancer outcome. Sci Rep. 2019;9(1):11677.
- Amar S, Smith L, Fields GB. Matrix metalloproteinase collagenolysis in health and disease. Biochim Biophys Acta Mol Cell Res. 2017;1864(11 Pt A):1940–1951.
- Khamis ZI, Iczkowski KA, Man YG, et al. Evidence for a proapoptotic role of matrix metalloproteinase-26 in human prostate cancer cells and tissues. J Cancer. 2016;7(1):80–87.
- Kulic A, Dedic Plavetic N, Vrbanec J, et al. Low serum mmp-1 in breast cancer: a negative prognostic factor?. Biomarkers. 2012;17(5):416–421.
- Overall CM, Kleifeld O. Tumour microenvironment – opinion: validating matrix metalloproteinases as drug targets and anti-targets for cancer therapy. Nat Rev Cancer. 2006;6(3):227–239.
- Martin MD, Matrisian LM. The other side of mmps: protective roles in tumor progression. Cancer Metastasis Rev. 2007;26(3–4):717–724.
- Chirco R, Liu XW, Jung KK, et al. Novel functions of timps in cell signaling. Cancer Metastasis Rev. 2006;25(1):99–113.
- Fields GB. Mechanisms of action of novel drugs targeting angiogenesis-promoting matrix metalloproteinases. Front Immunol. 2019;10:1278.
- Habel AF, Ghali RM, Bouaziz H, et al. Common matrix metalloproteinase-2 gene variants and altered susceptibility to breast cancer and associated features in Tunisian women. Tumour Biol. 2019;41(4):1010428319845749.
- Cathcart J, Pulkoski-Gross A, Cao J. Targeting matrix metalloproteinases in cancer: bringing new life to old ideas. Genes Dis. 2015;2(1):26–34.
- Beeghly-Fadiel A, Lu W, Long JR, et al. Matrix metalloproteinase-2 polymorphisms and breast cancer susceptibility. Cancer Epidemiol Biomarkers Prev. 2009;18(6):1770–1776.
- Zucker S, Cao J, Chen WT. Critical appraisal of the use of matrix metalloproteinase inhibitors in cancer treatment. Oncogene. 2000;19(56):6642–6650.
- Offenberg H, Brunner N, Mansilla F, et al. Timp-1 expression in human colorectal cancer is associated with tgf-b1, loxl2, inhba1, tnf-aip6 and timp-2 transcript profiles. Mol Oncol. 2008;2(3):233–240.
- Butler GS, Butler MJ, Atkinson SJ, et al. The timp2 membrane type 1 metalloproteinase "receptor" regulates the concentration and efficient activation of progelatinase a. A kinetic study. J Biol Chem. 1998;273(2):871–880.
- Nyberg P, Moilanen M, Paju A, et al. Mmp-9 activation by tumor trypsin-2 enhances in vivo invasion of human tongue carcinoma cells. J Dent Res. 2002;81(12):831–835.
- Nieminen MT, Listyarifah D, Hagstrom J, et al. Treponema denticola chymotrypsin-like proteinase may contribute to orodigestive carcinogenesis through immunomodulation. Br J Cancer. 2018;118(3):428–434.
- Parnanen P, Sorsa T, Tervahartiala T, et al. Isolation, characterization and regulation of moonlighting proteases from candida glabrata cell wall. Microb Pathog. 2020;149:104547.
- Palosaari H, Pennington CJ, Larmas M, et al. Expression profile of matrix metalloproteinases (mmps) and tissue inhibitors of mmps in mature human odontoblasts and pulp tissue. Eur J Oral Sci. 2003;111(2):117–127.