
Abstract
Objective: We compare estimates of proportion of days covered (PDC) based on dispensation-only data versus linked prescription and dispensation information, and we analyse their differences in a real-world cohort of patients with osteoporosis.
Methods: Prospective cohort study. We compared four alternative measures of PDC, using dispensation-only data: a) with a fixed assessment interval; b) censoring the assessment interval at the moment of the last refill; and using linked prescription and dispensation data: c) considering a minimum prescription gap of three months to interpret interruption by the physician; and d) considering any prescription gap.
Results: The mean PDC at 12 months for new users was 63.1% using dispensation-only data and a fixed interval, 86.0% using dispensation-only data and a last-refill interval, 81% using linked dispensation and prescription data and censoring any period without prescription, and 78.3% when using linked prescription and dispensation data and censoring periods of at least 3 months. For experienced users, the figures were 80.0%, 88.9%, 83% and 81%, respectively. Overall, dispensation-based measures presented issues of patient misclassification.
Conclusions: Linked prescription and dispensation data allows for more precise PDC estimates than dispensation-only data, as both primary non-adherence and early non-adherence periods, and fully non-adherent patients, are all identified and accounted for.
Introduction
Medication non-adherence is one of the most important barriers to getting the best benefit from pharmaceutical treatments in the real world, and to the same extent as demonstrated in clinical trials. For instance, osteoporosis medications have shown efficacy for the prevention of fragility fracturesCitation1 but medication adherence in patients with osteoporosis has been found to be suboptimal in several studiesCitation2–5. Poor adherence has been documented across the spectrum of chronic diseaseCitation6–16 and is associated with adverse health outcomes and higher healthcare costsCitation5. Worldwide, the improvements in chronic medication initiation and adherence are at the cornerstone of policy interventions orientated towards maximizing the value of modern healthcare even if, at least to date, such interventions have usually shown mixed resultsCitation11.
In routine clinical practice, many factors may contribute to poor medication adherence including those related to patients, to physicians and to healthcare systemsCitation17,Citation18. The common belief that patients are solely responsible for taking their treatment is misleading and most often reflects a misunderstanding of how other factors affect people’s behaviour and their capacity to adhere to their treatmentCitation6. A better understanding of the relative contribution of patient and physician predictors of initiation, adherence and interruption of treatment can be useful for a better understanding of the complex phenomenon of non-adherence and for designing more effective interventions.
Real-world evidence on medication non-adherence is mainly based on information available in refill databases. Studies based on data which is routinely collected in the provision of care have been extremely useful for assessing adherence to and persistence with medication in patients with chronic diseases, and the impact of non-adherence and treatment interruption on clinical outcomesCitation7,Citation8. However, one common feature of those studies is that they lack information about physician prescription, and adherence estimates are calculated by using dispensation data captured from pharmacy claims. When it is not possible to link prescription and dispensation data at the individual level, it is difficult to ascertain the exact moment of initiation of therapy (essential for analysing primary non-adherence) and it is also impossible to discern whether a gap in adherence may be due to patient non-adherence or to an interruption (even if temporary) of prescription as decided by a doctor. In this sense, traditional adherence estimates based on refill claims data that are not linked to prescription data, which in fact are the most prevalent in the literature, should be interpreted with caution as therapy initiation and the attribution of adherence gaps will not be reliably addressed.
In the region of Valencia in Spain, the electronic health information systems include an advanced electronic prescription manager that allows a link to be made between every patient treated in the region, prescriptions issued by doctors and the refills dispensed at the pharmacy. In this way, it is possible to overcome the aforementioned limitations of dispensation-based estimators and to calculate more refined adherence measures. To what extent adjusting adherence estimates based solely on dispensations with prescription information impacts on the adherence estimates has, to the best of our knowledge, never been explored.
In this paper we compare traditional, dispensation-based estimates with estimates using linked prescription and dispensation information, and we illustrate and quantify their differences by estimating real-world, long-term medication secondary adherence in a cohort of patients aged 50 years and over in the region of Valencia.
Methods
Design
The prospective cohort comprised the patients of the ESOSVAL cohort (fully described elsewhereCitation19) with at least one physician prescription (to estimate secondary adherence with linked prescription and dispensation data) or one dispensation (to estimate secondary adherence with claims-only data) of an osteoporotic medication issued between June 2009 and June 2011.
Study setting
The study was conducted in the Valencia Health System (VHS), an extensive public hospital and primary healthcare centre network, which covers about 97% of the 5 million inhabitants of the Valencia region, located on the Mediterranean coast of Spain.
Population
Patients from the ESOSVAL cohort with at least one osteoporotic medication prescribed between June 2009 and June 2011 were included. The ESOSVAL cohort consists of 11,035 women and men aged 50 years and over attending 272 primary healthcare centres in the VHS for any health condition between November 2009 and September 2010. Subjects were recruited by opportunity sampling by around 600 general practitioners and primary care nurses collaborating in the ESOSVAL study following prospectively defined criteria.
We categorized patients into two groups: new users of osteoporotic treatments (when no previous dispensations or prescriptions for an osteoporotic drug were registered in the 6 months previous to the index date) and experienced users (all the rest).
Data sources
We combined data from the outpatient electronic medical record and the pharmaceutical management module of the electronic information systems of the VHS and a specific osteoporosis risk-monitoring sheet employed for the follow-up of the ESOSVAL cohort to create a database with sociodemographic and clinical characteristics and information on all physician prescriptions written and all prescriptions filled at the pharmacy for all patients studied. In the VHS, prescriptions and dispensations are linked at the individual level; treatments can be short or long term (maximum one year for chronic therapies which, for instance, would include 12 monthly prescriptions, with a window for refilling of 10 days for each prescription) and there is no monthly reimbursement limitation.
Covariates
Sociodemographic and clinical characteristics included age; sex; educational level; history of hip fracture in parents or siblings; personal history of any previous osteoporotic fracture; body mass index (BMI); falls in the last year (≥1 fall); 10 year risk of hip fracture estimated with the Fracture Risk Assessment Tool (FRAX)Citation20 and categorized into <3% and ≥3%; other secondary causes of osteoporosis; use of glucocorticoids; using the World Health Organization (WHO) osteoporosis classification criteria based on T-scores, bone mineral density results were classified as normal, osteopenia or osteoporosisCitation21; sedentarism; use of calcium and vitamin D supplementation; polypharmacy (defined as having 6 or more dispensations concomitantly) and pharmaceutical copayment (categorized as no copayment for pensioners and people without resources or a copayment of 40% for the active population).
Main outcome measures
The main outcome measure was the proportion of days covered (PDC) at 12 and 24 months. PDC is generically defined as the total number of days covered with medication on hand during a specified follow-up period divided by the number of days in the patient’s follow-up periodCitation22.
We provided four alternative PDC measures. We calculated PDC with dispensation-only data in two ways, as found predominantly in the literature: a) censoring patients only in the case of death or loss to follow-up due to disenrollment, where the assessment period (almost) coincides with the follow-up period (called the “fixed interval” specification in the present study) and b) censoring the assessment periods also at the moment of the last dispensation within the follow-up period (called the “last-refill interval” in the present study). We further calculated PDC by linking prescription and dispensation data. We calculated the prescription-adjusted PDC with two different operational definitions to consider treatment interruption periods decided by the physician: c) considering a minimum prescription gap of three months to adjust PDC (meaning that, when there is a gap of three months or longer in prescription, this period is censored and is not accounted for as patient non-adherence) and d) considering any prescription gap as physician interruption (meaning that, when there is any gap in prescription, this period is censored and excluded from the calculation of the estimator). lists the main definitions and acronyms used in this study, and provides illustrative examples of the calculation of PDC using the four alternative measures.
Figure 1. (a) Example of calculation of PDC using dispensation only data. PDC is calculated using either a fixed interval or a last-refill interval. (b) Example of calculation of PDC using linked dispensation and prescription data. PDC is calculated using either any gap or a three-month prescription gap.
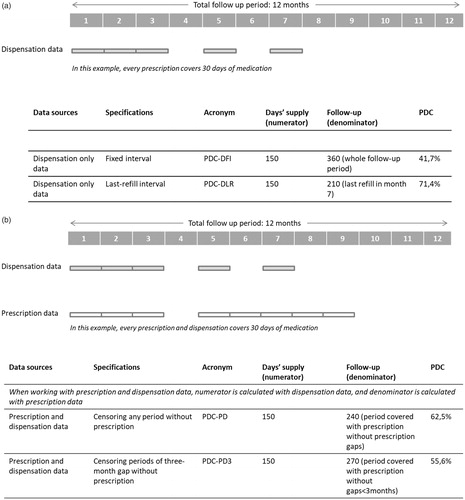
Table 1. Definitions used in this study.
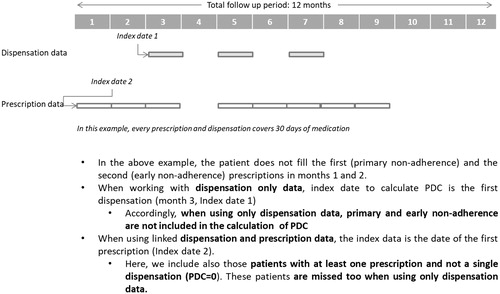
When using dispensation-only data the index date was defined as the first dispensation, while the first prescription was used as the index date when working with linked dispensation and prescription data. This also has implications with regard to PDC calculations (see ).
Figure 2. Differences between using dispensation only data or linked dispensation and prescription data with regard to the identification of the index date and patient inclusion for PDC calculation.
Days with available medication during the follow-up period were estimated through the medication regime defined by the physician and the number of pills per package (e.g. for a regime of one pill every 12 h and packages of 30 tablets, each dispensation will entail 15 days of medication available). Stockpiling was set to 90 days. PDC was summarized categorically using the widely accepted cut-off points of PDC <20% (non-adherent), 20% ≤ PDC <80% (partially adherent) and PDC ≥ 80% (adherent or fully adherent)Citation23.
Osteoporosis medications
The treatments for osteoporosis included were bisphosphonates (alendronate, risedronate, ibandronate), raloxifene, bazedoxifene, strontium ranelate and parathyroid hormone/teriparatide.
Statistical analysis
We first described baseline characteristics for the whole population and then stratified by new and experienced users. Categorical variables were expressed as proportions and compared using chi-square tests.
Second, we estimated the mean PDC for new and experienced users, as well as the percentage of patients categorized as adherent, partially adherent and non-adherent at 12 and 24 months, using four alternatives for PDC estimation (see ). All analyses were conducted using STATA v13 software.
Ethics
All study subjects signed the informed consent granting researchers access to information contained in their medical record for the purposes of the study. All information was handled according to Spanish laws on confidentiality and patients’ rights. The ESOSVAL study protocol was reviewed and approved by the Committee for Ethics and Clinical Trials of the Centre for Public Health Research and the Public Health General Directorate of the Valencia Government (decision 27 March 2009, protocol modification approval 4 October 2012).
Results
Cohort characteristics
We identified 2260 patients from the ESOSVAL cohort who were prescribed an osteoporotic medication between June 2009 and June 2011; 712 (31.5%) were new users and 1548 (68.5%) were experienced users (see ). For calculations based on dispensation information only, 696 new users and 1517 experienced users were considered (missing patients are those who did not fill any of their prescriptions).
Table 2. Baseline characteristics of the ESOSVAL cohort.
Adherence to osteoporosis medications
The mean PDC at 12 months for new users was 63.1% when using dispensation-only data and a fixed interval, 86.0% when using dispensation-only data and a last-refill interval, 81.0% using linked dispensation and prescription data censoring any period without prescriptions, and 78.3% when using linked prescription and dispensation data but censoring when prescription gaps were 3 months or longer. For experienced users, the figures were 80.0%, 88.9%, 83.0% and 81.0%, respectively. At 24 months, PDC slightly decreased using all four calculation methods for both new and experienced users (see and ).
Table 3. Mean PDC and categorical PDC at 12 months using dispensation-only data and using linked prescription and dispensation data.
Table 4 Mean PDC and categorical PDC at 24 months using dispensation-only data and using linked prescription and dispensation data.
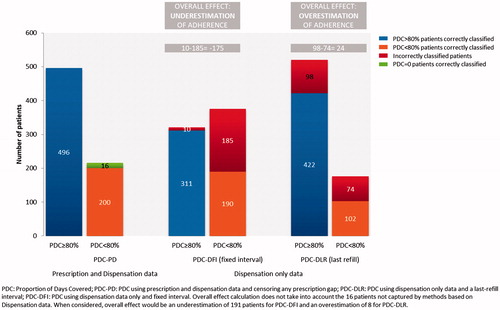
At 12 months, the percentage of non-adherent patients among new users (PDC < 20%) was 18.2% using dispensation-only data and a fixed interval, and 1.3% using dispensation-only data and a last-refill interval, and 6% when using linked prescription and dispensation data, irrespective of the gap specification. The percentage of fully adherent patients at one year for new users (PDC ≥ 80%) was 46.1% when using dispensation-only data and a fixed interval and 75.3% when the assessment period was censored at the last refill. When using linked prescription and dispensation data, PDC ≥ 80% was achieved by 65% of patients when censoring gaps in prescription equal to or longer than 3 months, and by 69.7% when censoring any gap in prescription. In experienced users, a larger proportion of patients were fully adherent irrespective of calculation methods, and similar differences in magnitude as with new users were observed among the four approaches used to estimate PDC (see ). Overall, PDC-DFI underestimated patient adherence and PDC-DLR overestimated patient adherence with respect to PDC-PD. Patient misclassification using dispensation-only data versus using linked prescription and dispensation data is shown in .
Figure 3. Patient misclassification in our cohort using dispensation data only versus using prescription and dispensation data.
Discussion
In the light of our findings, using linked prescription and dispensation data allows for a more accurate estimation of the PDC versus using dispensation data only. When prescription information is available and it is possible to link every prescription individually with every dispensation, the definition of the index date as the first prescription is more accurate than in dispensation-based studies, where the index date is usually the date of the first dispensation. In this way, the estimate is more precise as primary non-adherence and early non-adherence periods, and fully non-adherent patients (those who are prescribed in the period of assessment but do not fill any prescription) are identified and accounted for in PDC calculations (primary non-adherence in our PDC-PD cohort of new users was 6.5%). This may have important implications not only with regard to the accuracy of estimators, but for the design of interventions aimed at improving adherence and outcomes. In this way, it is possible to target high-risk patients and high-risk periods of non-adherence. Finally, an additional and important element of accuracy associated to the linkage of prescription and dispensation is the ability to censor periods without prescription for the estimation of PDC. Here, the attribution of gaps in days’ supply to patients’ non-adherence, as happens when using dispensation-only information, is imprecise, as those periods are in fact days not covered by prescription.
In our cohort of the general population of men and women aged 50 and over, we found that PDC figures based on linked prescription and dispensation data sat in the middle of those obtained from dispensation-based measures. When using dispensation-only data, differences between estimators are in turn explained by noticeable differences in the effective assessment period. When the effective period for the measurement of the PDC is censored at the time of the last refill, the effective assessment period is shortened, and thus PDC is overestimated compared to when the assessment period is a fixed interval. In fact, we could argue that this particular PDC estimator is inadequate (in the same way that some studies incorrectly censor periods in the presence of persistence gaps). On the other hand, the difference between PDC-DFI (56.6%) and PDC-PD (79%) in the case of new users shows the most noticeable numerical difference between estimators at 12 months, and reflects that, in the absence of prescription information, dispensation-based estimators using a fixed-interval period for secondary adherence assessment underestimate PDC in new users, where a phenomenon of gaps in prescription – that cannot be captured by means of dispensation information – is occurring (Appendix 1). It is commonplace in the literature related to medication adherence that naïve users tend to be less adherent to pharmacotherapy than experienced users; in the light of our results, based on higher quality information than average, this general assumption should be called into question. It is worth noting that the proportion of experienced users was not altered depending on the calculation method used, thus this factor is not affecting estimators. Finally, PDC is around 80% in most of our estimates, but a significant proportion of patients (between 25 and 65%) still remain non-adherent or only partially adherent over 24 months. This last finding is consistent with the widely reported global picture of suboptimal adherence to osteoporosis medications found in the literature, where important differences in magnitude reported among studies also arise, some showing similar figures to those of the present studyCitation24–31.
This study has some limitations. First, our cohort was recruited by doctors that previously underwent a comprehensive, one-year long training programme in the clinical management of osteoporosis. In this sense, we may expect that our results represent high quality care occurring in the real world. This may partly explain the high values of secondary adherence to osteoporosis medications obtained in our study, although it would not affect the differences among assessment methods observed. Second, other measures of secondary adherence are used in the literature; however, PDC (or truncated MPR) is the most commonly used metric and thus more useful for comparative purposes. Third, we compare two methods of calculation of PDC based on dispensation information, while other variations can be found in the literature. For instance, some authors apply censoring when calculating PDC in the presence of persistence gaps, but we discarded these types of approaches as they are usually incorrect for adherence assessment purposes. Fourth, we did not examine the precise reasons for non-adherence, as for instance adverse effects, that may affect treatment continuation by both the physician and patient. Fifth, pharmacy claims data report only prescription filling, not actual medication use. Nevertheless, several studies have shown a high consistency between dispensation and patient consumptionCitation32,Citation33. Sixth, drugs dispensed at the hospital are not recorded in the database. Patients could be misclassified as non-adherent (non-persistent and low availability) during their hospital stay. Last, exposure/days’ supply misclassification may influence estimates of adherence, as shown in other contextsCitation34, although this is expected to be a minor issue in electronic dispensing systems. Despite the later limitations, retrospective cohort studies currently represent the gold standard for the estimation of real-world medication adherence.
In conclusion, we have shown that linking prescription and dispensation data allows for an accurate, refined estimation of secondary adherence versus using dispensation-only data. This offers a more complete and realistic view of real-world patient adherence, most notably in new users, where patterns of prescription interruption are quite frequent. Finally, interventions aimed at improving medication adherence may also benefit from a more accurate identification of patients at higher risk of non-adherence.
Transparency
Declaration of funding
The ESOSVAL research program is co-funded by the Instituto de Salud Carlos III (Grants PS09/02500, PI11/00238 and PI13/01721) from the Spanish Ministry of Health and the European Regional Development Fund, and by collaboration agreements established by FISABIO and the Valencia Department of Health with MSD Spain (2009–2012) and AMGEN S.A. (2010–2013), to conduct training and real-world research into musculoskeletal disorders and osteoporosis.
Author contributions
A.G., J.S., G.S. and S.P. were responsible for the study concept, design and, with I.H., for data acquisition. A.G. drafted the manuscript. I.H. prepared the database and carried out the main statistical analyses. All authors participated in the study design and interpretation of data, and contributed to the critical revision of the manuscript for important intellectual content. All authors agree to be accountable for all aspects of the manuscript.
Declaration of financial/other relationships
None of the sponsors played any role in the design of the ESOSVAL studies, the collection, analysis or interpretation of data, the writing of the manuscript or in the decision to submit it for publication. FISABIO has received research grants from various pharmaceutical companies (see funding of the ESOSVAL project). No potential conflict of interest was reported by the authors. CMRO peer reviewers on this manuscript have no relevant financial or other relationships to disclose.
Acknowledgements
The authors are grateful to all doctors and nurses at the Valencia Health Agency primary healthcare centres participating in the ESOSVAL study for their collaboration, and to the Valencia Ministry of Health for its enthusiastic and continued support of the ESOSVAL research projects.
References
- Siris ES, Selby PL, Saag KG, et al. Impact of osteoporosis treatment adherence on fracture rates in North America and Europe. Am J Med. 2009;122(Suppl):S3–S13.
- Imaz I, Zegarra P, González-Enríquez J, et al. Poor bisphosphonate adherence for treatment of osteoporosis increases fracture risk: systematic review and meta-analysis. Osteoporos Int. 2010;21:1943–1951.
- Rabenda V, Hiligsmann M, Reginster JY. Poor adherence to oral bisphosphonate treatment and its consequences: a review of the evidence. Expert Opin Pharmacother. 2009;10:2303–2315.
- García-Sempere A, Hurtado I, Sanfélix-Genovés J, et al. Primary and secondary non-adherence to osteoporotic medications after hip fracture in Spain. The PREV2FO population-based retrospective cohort study. Sci Rep. 2017;7:11784.
- Ross S, Samuels E, Gairy K, et al. A meta-analysis of osteoporotic fracture risk with medication nonadherence. Value Health. 2011;14:571–581.
- Caro JJ, Salas M, Speckman JL, et al. Persistence with treatment for hypertension in actual practice. CMAJ. 1999;160:31–37.
- Osterberg L, Blaschke T. Adherence to medication. N Engl J Med. 2005;353:487–497.
- Brookhart MA, Avorn J, Katz JN, et al. Gaps in treatment among users of osteoporosis medications: the dynamics of noncompliance. Am J Med. 2007;120:251–256.
- Solomon DH, Avorn J, Katz JN, et al. Compliance with osteoporosis medications. Arch Intern Med. 2005;165:2414–2419.
- Choudhry NK, Winkelmayer WC. Medication adherence after myocardial infarction: a long way left to go. J Gen Intern Med. 2008;23:216–218.
- Nieuwlaat R, Wilczynski N, Navarro T, et al. Interventions for enhancing medication adherence. Cochrane DB Syst Rev. 2014;20(11):CD000011.
- Brown MT, Bussell JK. Medication adherence: who cares? Mayo Clin Proc. 2011;86:304–314.
- Chan DC, Shrank WH, Cutler D, et al. Patient, physician, and payment predictors of statin adherence. Med Care. 2010;48:196–202.
- Sabaté E. Adherence to long-term therapies: evidence for action [Internet]. Geneva, Switzerland: World Health Organisation; 2003 [cited 2018 Nov 8]. Available from: http://whqlibdoc.who.int/publications/2003/9241545992.pdf
- Deshpande S, Quek RG, Forbes CA, et al. A systematic review to assess adherence and persistence with statins. Curr Med Res Opin. 2017;33:769–778.
- Corrao G, Monzio Compagnoni M, Franchi M, et al. Good adherence to therapy with statins reduces the risk of adverse clinical outcomes even among very elderly. Evidence from an Italian real-life investigation. Eur J Intern Med. 2018;47:25–31.
- Svedbom A, Hernlund E, Ivergård M, et al. EU Review Panel of IOF. Osteoporosis in the European Union: a compendium of country-specific reports. Arch Osteoporos. 2013;8:137.
- Hernlund E, Svedbom A, Ivergård M, et al. Osteoporosis in the European Union: medical management, epidemiology and economic burden. A report prepared in collaboration with the International Osteoporosis Foundation (IOF) and the European Federation of Pharmaceutical Industry Associations (EFPIA). Arch Osteoporos. 2013;8:136.
- Sanfélix-Genovés J, Sanfélix-Gimeno G, Peiró S, et al. Prevalence of osteoporotic fracture risk factors and antiosteoporotic treatments in the Valencia region, Spain. The baseline characteristics of the ESOSVAL cohort. Osteoporos Int. 2013;24:1045–1055.
- Kanis JA, Johnell O, Oden A, et al. FRAX and the assessment of fracture probability in men and women from the UK. Osteoporos Int. 2008;19:385–397.
- Qaseem A, Snow V, Shekelle P, et al. Clinical Efficacy Assessment Subcommittee of the American College of Physicians. Pharmacologic treatment of low bone density or osteoporosis to prevent fractures: a clinical practice guideline from the American College of Physicians. Ann Intern Med. 2008;149:404–415.
- Raebel MA, Schmittdiel J, Karter AJ, et al. Standardizing terminology and definitions of medication adherence and persistence in research employing electronic databases. Med Care. 2013;51:S11–S21.
- Karve S, Cleves MA, Helm M, et al. Good and poor adherence: optimal cut-point for adherence measures using administrative claims data. Curr Med Res Opin. 2009;25:2303–2310.
- Iglay K, Cao X, Mavros P, et al. Systematic literature review and meta-analysis of medication adherence with once-weekly versus once-daily therapy. Clin Ther. 2015;37:1813–1821.e1.
- Hiligsmann M, Salas M, Hughes DA, et al. Interventions to improve osteoporosis medication adherence and persistence: a systematic review and literature appraisal by the ISPOR Medication Adherence & Persistence Special Interest Group. Osteoporos Int. 2013;24:2907–2918.
- Gold DT, Trinh H, Safi W. Weekly versus monthly drug regimens: 1-year compliance and persistence with bisphosphonate therapy. Curr Med Res Opin. 2009;25:1831–1839.
- Netelenbos JC, Geusens PP, Ypma G, et al. Adherence and profile of non-persistence in patients treated for osteoporosis – a large-scale, long-term retrospective study in The Netherlands. Osteoporos Int. 2011;22:1537–1546.
- Cramer JA, Gold DT, Silverman SL, et al. A systematic review of persistence and compliance with bisphosphonates for osteoporosis. Osteoporos Int. 2007;18:1023–1031.
- Kothawala P, Badamgarav E, Ryu S, et al. Systematic review and meta-analysis of real-world adherence to drug therapy for osteoporosis. Mayo Clin Proc. 2007;82:1493–1501.
- Siris ES, Harris ST, Rosen CJ, et al. Adherence to bisphosphonate therapy and fracture rates in osteoporotic women: relationship to vertebral and nonvertebral fractures from 2 US claims databases. Mayo Clin Proc. 2006;81:1013–1022.
- McCombs JS, Thiebaud P, McLaughlin-Miley C, et al. Compliance with drug therapies for the treatment and prevention of osteoporosis. Maturitas. 2004;48:271–287.
- Steiner JF, Prochazka AV. The assessment of refill compliance using pharmacy records: methods, validity, and applications. J Clin Epidemiol. 1997;50:105–116.
- Grymonpre R, Cheang M, Fraser M, et al. Validity of a prescription claims database to estimate medication adherence in older persons. Med Care. 2006;44:471–477.
- Burden AM, Paterson JM, Gruneir A, et al. Adherence to osteoporosis pharmacotherapy is underestimated using days supply values in electronic pharmacy claims data. Pharmacoepidemiol Drug Saf. 2015;24:67–74.
Appendix 1. Periods of effective assessment when the follow-up is defined at 24 months using different PDC calculation methods.