
Abstract
Background
CYP3A4 and CYP3A5 are biologically potential genes responsible for prostate cancer.
Aim
We aimed to analyse the expression and association of CYP3A4 and CYP3A5 genes in prostate cancer.
Subjects and methods
Web-based bioinformatics tools were used to assess the association of CYP3A4 and CYP3A5 genes with prostate cancer risks. A case-control study of 210 prostate cancer cases and 207 controls was also approved to determine the allelic variants of the CYP3A4 gene- rs2740574 (CYP3A4*1B) and the variant of CYP3A5 gene-rs776746 (CYP3A5*3) using Polymerase Chain Reaction-Restriction Fragment Length Polymorphism (PCR-RFLP). The risk of prostate cancer was estimated as odds ratio (OR) and 95% confidence interval (CI) using unrestricted logistic regression models.
Results
Our in silico data confirmed that both CYP3A4 and CYP3A5 genes are significantly associated with higher prostate cancer risks. In the case of CYP3A4*1B polymorphism, the heterozygote (*1 A/*1B), mutant (*1B/*1B), and combined heterozygote plus mutant (*1A/*1B+*1B/*1B) genotypes showed 3.52-fold, 3.90-fold, and 3.67-fold increased risk of prostate cancer, respectively. In the case of CYP3A5*3 polymorphism, the heterozygote (*1/*3), mutant (*3/*3), and combined (*1/*3+*3/*3) genotypes were found to be significantly associated with 5.11-, 5.49-, and 5.28-fold greater risk of prostate cancer, respectively.
Conclusion
Our results indicate that CYP3A4*1B and CYP3A5*3 are significantly associated with increased prostate cancer risk.
Bioinformatics tools were used and concluded that the CYP3A4 and CYP3A5 genes were significantly associated with the development and progression of prostate cancer.
CYP3A4 and CYP3A5 polymorphisms were significantly associated with an increased risk of prostate cancer.
Polymerase Chain Reaction (PCR)–Restriction Fragment Length Polymorphism (RFLP) was used to estimate polymorphisms of prostate cancer progression in the Bangladeshi population.
KEY MESSAGES
Introduction
Prostate Cancer (PCa) is one of the most common forms of cancer globally. In 2020, there were an estimated 1,414,259 (7.3% of all sites) new cases and 375,304 (3.8% of all sites) deaths globally, which made PCa the most common identified cancer in 105 of 185 countries (Sung et al. Citation2021). Approximately 71.6% of cases occur in developed countries; however, 28.4% of cases occur in less developed countries (Jemal et al. Citation2011; Bray et al. Citation2018). PCa ranked as the second most common cancer and fifth leading cause of cancer death in men in 2020 and over half (112 out of 185) of countries in the world commonly identified cancer among men, particularly in the Americas, Northern and Western Europe, Australia, New Zealand, and extensively in Sub-Saharan Africa (Sung et al. Citation2021). The incidence rate of PCa differs with diverse mortality and morbidity around the world (Jemal et al. Citation2011; Bray and Kiemeney Citation2017; Bray et al. Citation2018). Although the highest frequencies of PCa were detected in African-American men in the United States (US) and Caribbean men of African origin (Bray et al. Citation2018), in contrast, the maximum disease-associated death rates have been found in less developed countries, including the Caribbean, Sub-Saharan Africa, and South America (Bray and Kiemeney Citation2017). It has been suggested that the presence of the CYP3A4*1B allele reduces the amount of CYP3A4 protein, resulting in reduced testosterone metabolism and, therefore, higher availability of testosterone converted to dihydrotestosterone, the most potent androgen affecting the growth and differentiation of prostate cells. CYP3A4 is involved in the oxidation of testosterone to 2β-, 6β-, or 15β-hydroxytestosterone (Rebbeck et al. Citation1998). Testosterone plays a key role in promoting prostate cell division. A family of the Cytochrome P-450 supergene called CYP3A4 protein is responsible for the metabolism of several hormones like deactivation of testosterone (Kedishvili Citation2016). It has been found that the CYP3A4 gene (A to G transition at position 2293 from the ATG start site) was associated with a more significant clinical grade and stage of prostate cancer in Caucasian men, particularly in late-aged men. A single nucleotide polymorphism (SNP) in the nifedipine-specific response element in the promoter of the CYP3A4 gene (alternatively termed g.-392AG, CYP3A4-V, CYP3A4*1B) has been reported. A germ-line variant in the 50 regulatory regions of the CYP3A4 gene that substitutes an alanine for a glycine at codon 293 has been associated with a 1.7- to 9.5-fold increase in risk for prostate cancer (Rebbeck et al. Citation1998). The CYP3A5*3 polymorphism reduced CYP3A5 mRNA content by 13-fold. It was found that CYP3A5 was exclusively localised in the basolateral prostate cells. This suggests that the prostate basolateral cells express high levels of CYP3A5, which dramatically reduces in tumoral tissue, which verifies an endogenous function of CYP3A5 associated to the metabolism of intra-prostatic androgens as well as cell growth, and that polymorphisms affecting CYP3A5 activity may result in altered prostate cancer risk and aggressiveness (Leskelä et al. Citation2007).
Reportedly, CYP3A4 is similar to CYP3A5 with respect to the sequence and substrate selectivity of both proteins (Kuehl et al. Citation2001). Nearly 84% of amino acid sequences and overlapping substrate specificities similarity have been found between CYP3A4 and CYP3A5 (Wrighton and Stevens Citation1992), however, the enzymatic properties of CYP3A4 and CYP3A5 were different, including substrate specificity and inhibition (Emoto and Iwasaki Citation2006). CYP3A single nucleotide polymorphisms (SNPs), principally CYP3A4*1B, are associated with prostate cancer risk and aggressiveness, suggesting that CYP3A enzymes may play a significant role in prostate cell growth (Bangsi et al. Citation2006).
We used TIMER2.0 (http://timer.cistrome.org/), which is a web-based server, to deliver more robust assessment of immune infiltration levels for The Cancer Genome Atlas (TCGA) or tumour profiles using six state-of-the-art algorithms. The TIMER2.0 web server contains four modules for examining the associations between immune infiltrates and genetic or clinical features, as well as four modules for exploring cancer-related associations in the TCGA cohorts (Li et al. Citation2020). The current study also used the GEPIA2 tool (Gene Expression Profiling Interactive Analysis), which provides fast and adaptable purposeful functional association with normal and cancer data. This tool specifically delivers the key interactive functions comprising differential expression analysis, profiling plotting, and correlation analysis (Tang et al. Citation2017). We analysed our target genes and assessed the expression and correlation analysis of both CYP3A4 and CYP3A5 genes with prostate cancer risk using the GEPIA2 online tool which is available at http://gepia2.cancer-pku.cn. Patient survival analysis was conducted by UALCAN tools (http://ualcan.path.uab.edu/) (Chandrashekar et al. Citation2017).
There is no such type of research concerning the genome-wide association of CYP3A4 and CYP3A5 genes carried out among the Bangladeshi population. Here we investigated the expression, correlation, and survival analysis of both CYP3A4 and CYP3A5 genes with PCa risks using the publicly available computational biology tools. We also propose the association of CYP3A4 and CYP3A5 SNPs with prostate cancer susceptibility in the Bangladeshi population. Therefore, this study aims to disclose the risk of prostate cancer associated with CYP3A4 and CYP3A5 polymorphisms in the male population of Bangladesh.
Subjects and methods
Correlation of gene expression with immune infiltration profile and analysis of gene expression with different TCGA cancer data
TIMER2.0 (http://timer.cistrome.org/) allows the visualisation of the immune infiltration levels for The Cancer Genome Atlas (TCGA), which provides comprehensive analysis and visualisation functions of tumour infiltrating immune cells. The Gene_DE module in TIMER2.0 allows the study of differential expression between tumour and adjacent normal tissues for any gene of interest across all TCGA tumours. There are many different types of cancer and normal data available in the TCGA cancer data set (Li et al. Citation2020).
Assessment of CYP3A4 and CYP3A5 genes expression level
The gene expression data cohort with Prostate Adeno Carcinoma (PRAD) was measured using the Gene Expression Profiling Interactive analysis (GEPIA2) online tool, a recently developed interactive database for analysing the gene expression data of TCGA. (http://gepia2.cancer-pku.cn) (Tang et al. Citation2017). The analysed data set contained a total of 644 samples, of which 492 were prostate cancer samples and 152 were normal samples.
Survival analysis
Survival analysis was performed based on the expression status of the CYP3A4 and CYP3A5 gene signature by a Kaplan–Meier (KM) survival plot and the Log-rank p values < 0.05 were considered statistically significant using the TCGA prostate cancer data cohort. The survival probability of prostate cancer patients was analysed using the survival of TCGA data conducted by the UALCAN (http://ualcan.path.uab.edu/) tool (Chandrashekar et al. Citation2017).
Study design and population
The study included 210 prostate cancer patients as cases and 207 healthy volunteers as the control and all were matched by age, sex, and smoking grade among the Bangladeshi population. Prostate cancer patient samples were collected from Ahsania Mission Cancer and General Hospital (AMCH), Dhaka Medical College Hospital (DMCH), National Institute of Cancer Research & Hospital (NICRH), Dhaka, Bangladesh. All prostate cancer cases have been confirmed by radical prostatectomy, transurethral resection of the prostate, or prostatic biopsy and histological examination. Many clinical features were noted, including Gleason classification, PSA and TNM staging, and many potentially vital factors, including age, smoking, height, weight, and BMI. The study protocol was accepted by the ethical committees of the Institutional and/or National Research Committee and the study was directed according to the announcement of Helsinki and its later amendments (World Medical Association Citation2013).
Venous blood sample collection and genomic DNA isolation
All volunteers, including both prostate cancer cases and healthy controls, were incorporated in the current study after appropriate counselling, justification, and explaining the purpose of the research, and taking their consent in the prescribed format and queries. Three millilitres (3 ml) of venous blood were taken from all prostate cancer cases and controls in a suitable sterile tube containing EDTA-Na2 and kept at −80 °C until DNA extraction. Then genomic DNA was isolated from blood samples of all subjects, both cases and controls, by following the reported method (Islam et al. Citation2013). Finally, the extracted genomic DNA’s purity was measured by spectrometric measurement of OD260/OD280 ratios within the range of 1.6–1.9.
PCR-RFLP for CYP3A4 and CYP3A5 genotyping
For genotyping of both genes, PCR-RFLP was used due to its affordability, easiness of use, and consistency. CYP3A4*1B and CYP3A5*3 were genotyped according to the well-stabilised method (Islam et al. Citation2013). The name of the restriction enzyme with its sites of digestion was tabulated in the case of CYP3A4*1B and CYP3A5*3 alleles (). The primers of both genes, PCR conditions, restriction enzymes (RE), and digested DNA fragments are listed (). Template DNA was considered as the genomic DNA isolated from whole blood. For this purpose, 25 μL of PCR reaction volume was prepared, having 1 μL of template genomic DNA (50–70 ng/μL), 5 μl of 5× GoTaq reaction buffer, 4 μL of MgCl2 (25 mM), 2 μL of dNTPs (2.5 mM), 1 μL of each primer (10 μM), 0.1 μL of GoTaq DNA polymerase (5 U/μL) (New England Biolabs, Promega Corporation), and 10.9 μL of nuclease-free water. PCR products were evaluated on a 2% agarose gel by staining with ethidium bromide for confirming the desired lengths. After completion of PCR amplification, 20 μL of PCR products were taken and kept at 37 °C overnight for digestion with almost 2 units of MboII and RsaI for CYP3A4*1B and CYP3A5*3, respectively, following the manufacturers’ standard protocol (Rais et al. Citation2006). Electrophoresis was done for restriction enzyme digested products for both CYP3A4 and CYP3A5 genes using 10% polyacrylamide gels in 1× TBE buffer. We again tested 10% of our total samples by casually selecting for the confirmation of our initial results by re-genotyping according to the similar PCR-RFLP method.
Figure 1. TIMER2.0 allows visualising the expression of CYP3A4 (A) and CYP3A5 (B) with different TCGA cancer data (tumour and adjacent normal tissues). The Gene_DE module in TIMER2.0 allows studying the differential expression between tumour and adjacent normal tissues for any gene of interest across all TCGA tumours. Distributions of gene expression levels are displayed using box plots. The statistical significance computed by the Wilcoxon test is annotated by the number of stars (p-value < 0.05; p-value < 0.01; p-value < 0.001). It can identify genes that are up-regulated or down-regulated in the tumours compared to normal tissues for each cancer type, as displayed in grey columns when normal data are available.
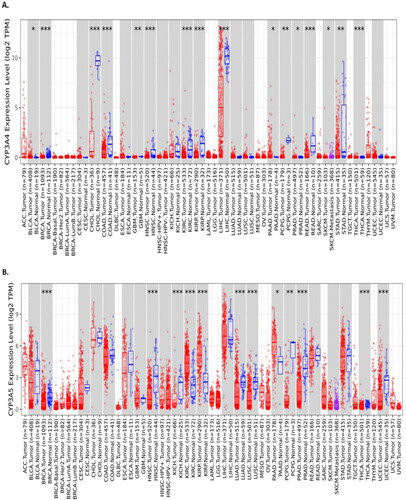
Figure 2. CYP3A4 and CYP3A5 expression with TCGA prostate cancer cases and controls was analysed using the GEPIA2 online tool. (A) CYP3A4 expression was not significantly expressed in prostate cancer risks with the total number of Prostate Adeno Carcinoma (PRAD) cases (n = 492) and control sample (n = 152) in TCGA datasets. (B) CYP3A5 expression was significantly expressed in prostate cancer risks with the total number of Prostate Adeno Carcinoma (PRAD) cases (n = 492) and control sample (n = 152) in TCGA datasets. (C) CYP3A4 and CYP3A5 expression were also positively correlated using Spearman correlation by plotting the Log2 of CYP3A4 transcript per million (TPN) versus Log2 of CYP3A5 transcript per million of TCGA prostate cancer datasets. The significance denoted by ns: not significant; * p-value < 0.05; ** p-value < 0.01; *** p-value < 0.001.
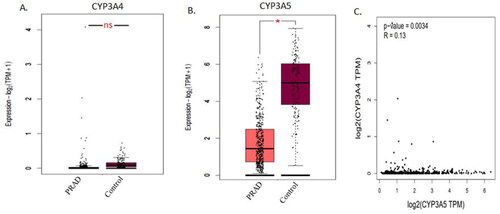
Table 1. Name of the restriction enzyme with its sites of digestion in the case of CYP3A4*1B and CYP3A5*3 alleles.
Table 2. Primers, PCR conditions, restriction enzymes (RE), and expected DNA fragments on digestion in the case of CYP3A4 and CYP3A5 genes.
Statistical analysis
Genotype and allelic incidences rates were stated as a percentage (%). The distributions of demographic data and genotype frequencies were compared among cases and controls using χ2-tests and two-sided unpaired t-tests. The genotype frequency distribution was also compared by using the χ2-test. Multiple logistic regression was considered to determine the odds ratio (OR) and their 95% of confidence intervals (CIs) by using the statistical software (SPSS, Inc., Chicago, IL), where the p-value < 0.05 was regarded as statistically significant.
Results
CYP3A4 and CYP3A5 genes expression with different TCGA cancer data
We analysed the expression of CYP3A4 and CYP3A5 genes with differential expression between tumour and adjacent normal tissues for any gene of interest across all TCGA tumours utilising the Gene_DE module in TIMER2.0 tool. The statistical significance calculated by the Wilcoxon test is noted by the number of stars (* p-value < 0.05; ** p-value < 0.01; *** p-value < 0.001). It can identify genes that are up-regulated or down-regulated in the tumours compared to normal tissues for each cancer type, as displayed in grey columns when normal data are available. After proper analysing, we found that both CYP3A4 and CYP3A5 genes expression was statistically significant with the development and progression of prostate cancer ( and ).
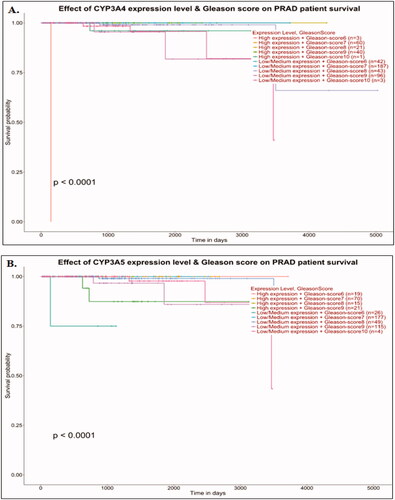
Figure 3. Survival analysis of prostate cancer patient’s datasets with CYP3A4 and CYP3A5 genes. Effects of CYP3A4 and CYP3A5 expression with Gleason score on Prostate Adenocarcinoma (PRAD) patient survival (A and B). Data were analysed using the UALCAN (http://ualcan.path.uab.edu/) tool on TCGA cancer datasets. The significance was denoted by ns: not significant; * p-value < 0.05; ** p-value < 0.01; *** p-value < 0.001.
CYP3A4 and CYP3A5 expression and correlation with prostate cancer
CYP3A4 and CYP3A5 gene expression was analysed using the GEPIA2 online tool and it was found that the CYP3A4 gene expression was not significantly expressed with prostate cancer progression in TCGA datasets (), though CYP3A4 gene expression was significantly associated with the development and progression of prostate cancer using TIMER2.0 tool (), whereas CYP3A5 gene expression was significantly expressed with prostate cancer progression in TCGA datasets (). CYP3A4 and CYP3A5 expression were also positively correlated in the prostate cancer TCGA dataset using Spearman’s correlation (p = 0.0034) (). We then checked the correlation between CYP3A4 and CYP3A5 genes in other common cancer types like breast invasive carcinoma (BRCA), colon adenocarcinoma (COAD), and pancreatic adenocarcinoma (PAAD), however, the CYP3A4 and CYP3A5 genes were not correlated in many other TCGA cancer datasets (Supplementary Figure S1).
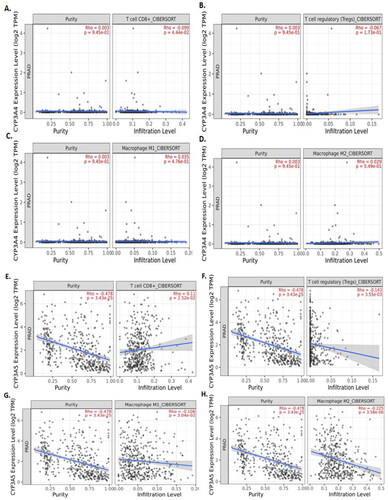
Figure 4. TIMER2.0 allows visualizing the expression with immune infiltration profile in prostate cancer. Scatter plot showed the spearman correlation in different immune cells. CYP3A4 (A, B, C and D) expression. CD8+ T cell (A) and regulatory T cell (B) showed a negative correlation whereas, M1 (C) and M2 (D) macrophages showed positive correlation with CYP3A4 expression in prostate cancer patient’s sequencing data. CYP3A5 (E, F, G and H) expression. CD8+ T cell (E) showed a positive correlation whereas regulatory T cell (F), M1 (G) and M2 (H) macrophages showed negative correlation with CYP3A5 expression in prostate cancer patient's sequencing data.
Clinical outcome of CYP3A4 and CYP3A5 genes with prostate cancer
Survival analysis of the TCGA prostate cancer data cohort was carried out using the Kaplan-Meier plot online tool. Survival probability of prostate cancer patients was analysed using the survival of TCGA datasets. The association of gene expression levels combined with clinical parameters on patient survival are illustrated in . Patients with high expression of CYP3A4 and Gleason score 7 (n = 60) had decreased survival probability compared to those with other groups () and the results were statistically significant (p < 0.0001). However, patients with low/medium expression of CYP3A5 and Gleason score 6 (n = 60) had decreased survival probability than those with other groups () and the results were statistically significant (p < 0.0001).
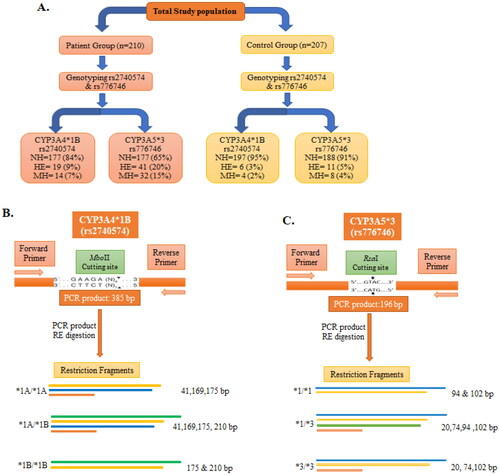
Figure 5. Schematic depiction of CYP3A4*1B and CYP3A5*3 genotypes with restriction sites of each enzyme and the resulting fragments. (A) Summary of different genotypes of CYP3A4*1B (rs2740574) and CYP3A5*3 (rs776746) with prostate cancer cases and control. (B) PCR products of CYP3A4*1B (rs2740574) with restriction site recognised by MboII restriction enzyme (RE) and the subsequent restriction fragment of CYP3A4 gene. (C) PCR product of CYP3A5*3 (rs776746) with restriction site recognised by RsaI restriction enzyme and subsequent restriction fragment of CYP3A5 gene. bp, Base pair; NH, normal homozygote; HE, heterozygote; MH, mutant homozygote.
Correlation of gene expression with immune infiltration profile in prostate cancer
The correlation of CYP3A4 and CYP3A5 genes expression with immune infiltration profile in prostate cancer was measured using the TIMER2.0 online tools. A scatter plot showed the Spearman’s correlation in different immune cells. CD8+ T cell () and regulatory T cell () showed a negative correlation, whereas M1 () and M2 () macrophages showed a positive correlation but were not statistically significantly correlated with CYP3A4 expression in prostate cancer patient’s sequencing data. CD8+ T cell () showed a positive correlation, whereas regulatory T cell (), M1 (), and M2 () macrophages showed a negative correlation with CYP3A5 expression in prostate cancer patient’s sequencing data.
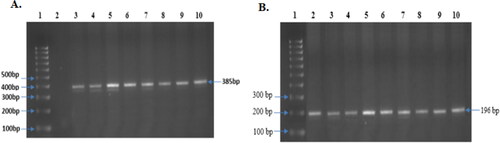
Figure 6. Obtained and observed PCR product of both CYP3A4*1B and CYP3A5*3. (A) PCR product of CYP3A4*1B: Representative images of all sample (385 bp) (Lane 3 to 10), Lane-1 contains Molecular ruler; Lane-2 contains blank. (B) PCR product of CYP3A5*3, Representative images of all sample (196 bp) (Lane 2 to 10), Lane-1 contains Molecular ruler.
Characteristics of prostate cancer cases and controls
This study recruited 210 prostate cancer cases and 207 healthy controls for both CYP3A4 and CYP3A5 gene analysis. The distributions of demographic characteristics and medical records were collected to see the physical conditions of both the cases and control groups ( and Supplementary Table S1). The average age of patients was 66 years (ranging from 63–75 years) and the average age for controls was 66 years (ranging from 62–74 years). We found that 67% of the incidence rate of prostate cancer remained among individuals of more than or equal to 65 years of age, whereas 33% of the incidence rate of prostate cancer remained in individuals less than 65 years of age. Several other associated factors, including age and smoking history of cases and controls, were compared for confirmation that the observed effects were solely due to the frequency of the genotype. There were no significant differences in the average age (p = 0.4761), weight (p = 0.5970), BMI (p = 0.1807), and smoking frequency (p = 0.4303) between the prostate cancer cases and controls.
Table 3. Distribution of demographic variables of the prostate cancer cases and controls.
The purity of the isolated genomic DNA was measured by spectrometer and calculated with OD260/OD280 ratios, which showed the range was within 1.6–1.9. The schematic drawing of the Polymerase Chain Reaction-Restriction Fragment Length Polymorphism (PCR-RFLP) of both CYP3A4 and CYP3A5 genes with restriction enzyme digestion sites and resulting restriction fragments are presented (). The PCR product of the CYP3A4 gene was 385 bp (), whereas that for the CYP3A5 gene was 196 bp (). After measuring the appropriate size of the PCR products, digestion by restriction enzyme was employed using MboII for CYP3A4 and RsaI for CYP3A5. The genotypes resulting from CYP3A4 were termed as normal homozygote (*1A/*1A; 175, 169, and 41 bp), heterozygote (*1 A/*1B: 210, 175, 169, and 41 bp), and variant homozygote, MH (*1B/*1B: 210 and 175 bp) (). The digested fragments of CYP3A5 were labelled as a normal homozygote, NH (*1/*1: 102, 74, and 20 bp), heterozygote, HE (*1/*3: 102, 94, 74, and 20 bp), and variant homozygote, MH (*3/*3: 102 and 94 bp) ().
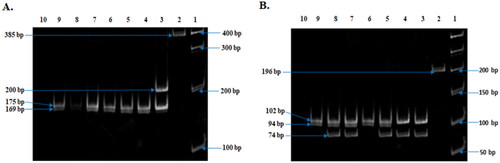
Figure 7. Observed Restriction Enzyme digested fragment of both CYP3A41B and CYP3A53. (A) Restriction Enzyme (MboII) digestion fragment of CYP3A41B. Representative images of all sample (Lanes 3–10) (10% Polyacrylamide gel). Lane 1, Molecular ruler; Lane 2, uncut PCR product (385 bp); Lane 3, 1B heterozygote (210, 175, 169, 41bp); Lanes 4–9, 1B Variant homozygote (175, 169, 41 bp) and Lane 10: H2O sample control. (B) Restriction Enzyme (RsaI) digestion fragment of CYP3A53. Representative images of all sample (Lanes 3–9) (10% Polyacrylamide gel). Lane 1, Molecular ruler; Lane 2, uncut PCR product (196 bp); Lanes 6 and 9, normal homozygote (94, 102 bp); Lanes 3 and 4, mutant homozygote (20, 74, 102); Lanes 5, 7, and 8, heterozygote (20, 74, 94, 102 bp) and Lane 10: H2O sample control.
Smoking grade
Among the smokers, 71% and 17% were current smokers and ex-smokers in the cases, whereas 74% and 14% were current smokers and ex-smokers in the control group, respectively. 7% and 5% were chewing tobacco and never smoking in cases, and 5% and 7% were chewing tobacco and never smoking in the control group, respectively. There were no statistically significant differences concerning cases and controls (p = 0.4303) regarding the current smoker, ex-smoker, never smokers, and chewing tobacco groups ( and Supplementary Table S2).
Impact of CYP3A4 polymorphism on prostate cancer risk
The relationship and impression of CYP3A4 have been investigated with prostate cancer vulnerability. Genotyping and distribution of allelic incidences of CYP3A4 have been examined and documented ( and and Supplementary Tables S1 and S2). The genotypes of CYP3A4 are presented in both prostate cancer cases and controls (). Compared with the wild type genotype, CYP3A4*1B-rs2740574 heterozygote, mutant homozygote, and combined heterozygote plus mutant variants have increased risk of prostate cancer (OR = 3.52, 95% CI = 1.38–9.02, p = 0.0086; OR = 3.90, 95% CI = 1.26–12.05, p = 0.0183; and OR = 3.67, 95% CI = 1.76–7.67, p = 0.0005, respectively). The distribution of the CYP3A4 genotypes were significantly dissimilar concerning the cases and controls [*1A/*1A, *1 A/*1B, and *1B/*1B], 84%, 9%, and 7% versus 95%, 3%, and 2%, respectively. Heterozygote (*1A/*1B) and Mutant Homozygote (*1B/*1B) genotypes have increased risk of prostate cancer of 3.52- and 3.90-times, respectively, compared with the wild type (*1A/*1A) genotype, whereas the *1A/*1B+*1B/*1B combined genotype has 3.67-times more prostate cancer risk compared with the wild type genotype. The obtained results are statistically significant (p < 0.05) ().
Table 4. Genotype frequencies of CYP3A4 and CYP3A5 gene polymorphisms in relation to prostate cancer cases and controls.
Table 5. Allele frequencies of CYP3A4 and CYP3A5 gene polymorphism in relation to prostate cancer cases and controls.
Allelic frequencies of CYP3A4 between the prostate cancer cases and controls and concerning prostate cancer risk are presented (). Wild type (*1A) and variant (*1B) allele subjects were found in 89% and 11% of prostate cancer cases, whereas in the controls they were found in 97% and 3%, respectively. *1B allele distribution was significantly higher in prostate cancer cases than controls. CYP3A4*1B alleles in different ethnic populations are presented (Supplementary Table S1). Variant (*1B) allele is shown to be significantly associated with a 3.60-fold higher risk of prostate cancer (OR = 3.60, 95% CI = 1.95–6.65, p = 0.0001) ().
Impact of CYP3A5 polymorphism on prostate cancer risk
The association of the CYP3A5 gene with prostate cancer risk has also been explored and investigated ( and and Supplementary Tables S1 and S2). The genotypes of CYP3A5 are presented in both prostate cancer cases and controls (). Compared with the wild type genotype, CYP3A5*3-rs776746 heterozygote, mutant homozygote, and combined heterozygote plus mutant variants are significantly associated with prostate cancer risk (OR = 5.11, 95% CI = 2.54–10.31, p = 0.0001; OR = 5.49, 95% CI = 2.45–12.28, p = 0.0001; and OR = 5.28, 95% CI = 2.65–10.50, p = 0.0001, respectively). CYP3A5*3 genotypes distribution was significantly dissimilar among the cases and controls (*1/*1, *1/*3, and *3/*3) 65%, 20%, and 15% versus 91%, 5%, and 4%, respectively. Heterozygote (*1/*3) and mutant homozygote (*3/*3) genotypes have increased the risk of prostate cancer by 5.11- and 5.49-times, respectively, compared with the wild type (*1/*1) genotype, whereas the *1/*3+*3/*3 combined genotype has 5.28-times more prostate cancer risk compared with wild the type genotype and that is statistically significant (p < 0.05) ().
The distribution of allele frequency of the CYP3A5 gene for both cases and controls was determined (), where the wild type (*1) and the mutant (*3) allele frequencies were found to be 75% and 25% for cases and 93% and 7% for controls, respectively. CYP3A5*3 alleles in different ethnic populations are presented (Supplementary Table S1). We found that variant (*3) alleles were significantly associated with a 4.78-fold greater prostate cancer risk (OR = 4.78, 95% CI = 3.05–7.48, p = 0.0001) ().
Discussion
We investigated the expression of CYP3A4 and CYP3A5 genes with clinical outcome and correlation using cancer genome atlas (TCGA) data. The approach employed here aims to explore genome-wide solid cancers to discover genetic correlations and associations between solid carcinomas at different levels relative to normal neighbouring tissues. Before recent times, many biologists did not implement data obtained using computational biology (or “in silico” methods). The rapid development of machine learning algorithms and bioinformatics tools has significantly increased the acceptance of these methods. The 3D (three dimensional) structures additionally provide great value for rational drug design. Furthermore, the exponential growth of biological sequences discovered in the post-genomic era and their effective use in drug discovery has led to the development of many sequence-based databases (Xu and Chou Citation2016). Rapid advances in RNA sequencing and structural bioinformatics have propelled pharmaceutical science into a remarkable revolution, in which computational biology is playing an increasing role in stimulating the development of new drug discovery (Chou Citation2015). For that reason, we used computational methods and bioinformatics tools in this study and evaluated the genetic association with prostate cancer development and progression. Our computational study suggested that both CYP3A4 and CYP3A5 genes expression and correlation between CYP3A4 and CYP3A5 genes were statistically significant with prostate cancer development, generation and progression. Our study also suggested that patients with high expression of CYP3A4 and Gleason score 7 had decreased survival probability than those with other groups, whereas patients with low/medium expression of CYP3A5 and Gleason score 6 had decreased survival probability than those with other groups in the TCGA prostate cancer data cohort.
There is much interest in prostate cancer because it is one of the predominant reasons for cancer-associated death in the Bangladeshi population, and the aim was to explore whether both CYP3A4*1B and CYP3A5*3 alleles are related with the development and the progression of prostate cancer. We then tested our collected prostate cancer patients and control sample and all the results were compared with the results of the control groups. We found that the mean age (p = 0.4761) and smoking status (p = 0.4303) were not significantly different among the cases and controls ().
Our results suggested that the genotype of CYP3A4*1B variants was significantly associated (p < 0.05) with prostate cancer risk compared with the normal homozygote genotype. The CYP3A4 genotyping distributions also differed significantly between the cases and controls (). We found comparable results in our study population with those from other studies among the Asian population (Kuehl et al. Citation2001; Van Schaik Citation2005; Sailaja et al. Citation2010). A significant association (p < 0.05) was found among the CYP3A4-AG and AG/GG genotypes with PCa among South African White men as well as Mixed Ancestry men (OR = 3.38 and 3.32, and OR = 3.74 and 3.63, respectively) (Fernandez et al. Citation2012). Several studies suggested that significant associations (p < 0.05) have been found between the variant and the incidence and severity of prostate cancer (Paris et al. Citation1999; Tayeb et al. Citation2002). The CYP3A4*1B variant was significantly associated with prostate cancer generation and progression among Caucasians (OR = 1.91; 95% CI = 1.02–3.57; p = 0.04) (Plummer et al. Citation2003), however, the CYP3A4*1B variant was also inversely associated with the probability of having prostate cancer among Caucasians (OR = 0.08; 95% CI = 0.01–0.49; p = 0.006) (Zeigler-Johnson et al. Citation2004). CYP3A4 is mainly responsible for the metabolic deactivation (hydroxylation) of testosterone. A study revealed that the distribution of CYP3A4*1B genotypes is not significantly different among cases and controls (OR = 1.191; 95% CI = 0.740–1.918, p = 0.470), and CYP3A4*1B polymorphism is not significantly associated with prostate cancer risk among the Portuguese population (Nogal et al. Citation2007). It was stated that the constant rise of CYP3A4 levels occurs in the presence of G carrier genotypes (Westlind et al. Citation1999; Spurdle et al. Citation2002). Nearly all studies had concluded a constant increase in expression associated with the CYP3A4*1B allele, ranging from 20–200% elevation above the consensus CYP3A4*1A (Zeigler-Johnson et al. Citation2004). It has been well noted that different patients have different responses to the same medication in different ways. The CYP3A4 gene plays a significant role in the metabolism of more than 60% of all drugs used in humans (Thummel et al. Citation1996). The association of CYP3A4*1B genotypes was 60% in an African population and 4% in a Caucasian population, however different rate patterns have been reported in Chinese and Japanese populations (Rebbeck et al. Citation1998; Walker et al. Citation1998; Paris et al. Citation1999).
Our study also suggested that the genotype of CYP3A5*3 was significantly associated (p < 0.05) with the prostate cancer risk. The CYP3A5*3 genotypes distribution were significantly different (p = 0.0001) between the cases and controls ( and ). The previous studies suggest that CYP3A5 genotypes were not associated with PCa or disease severity (Zeigler-Johnson et al. Citation2004). In support of this result, many authors concluded that the higher CYP3A5 prostatic expression suggests that CYP3A5 shows a related function in the prostate. However, the metabolism of the drug was not dependent on the prostate tissue and this function is essentially associated with the metabolism of prostatic endogenous CYP3A5 substrates, including androgens (Salameh et al. Citation2012). CYP3A5 has also been found in other tissues for its important endogenous function, which alters systolic blood pressure and pulse pressure, apparently by altering the glucocorticoid metabolism (Kreutz et al. Citation2005). The CYP3A5 polymorphism has been specially associated with a decreased risk of low-grade (p = 0.023) or localised (p = 0.044) prostate cancer (Zhenhua et al. Citation2005) and was not significantly associated (p < 0.05) with PCa among South African White and Mixed Ancestry men (Pedro Fernandez et al. Citation2012).
This study delivers some important recommendations that CYP3A4*1B and CYP3A5*3 are the risk factors for the progression of prostate cancer, suggesting CYP3A4*1B and CYP3A5*3 are significantly associated with elevated prostate cancer risk among the Bangladeshi population.
Ethical approval
The study was conducted by the Declaration of Helsinki and its later amendments, and the ethical committees of the respective hospitals also endorsed the study protocol (Ethical committee approval number is PCa-2016-54). Informed consent was taken from all individual participants involved in the study. Each volunteer (both patient and healthy controls) was informed about the research procedures, the purposes, and their freedom to withdraw from the study at any time before signing the consent form. The informed consent form was collected and stored.
Supplemental Material
Download PDF (203.7 KB)Acknowledgments
The authors are grateful to all the participants of this research and like to thank Professor Xuebiao Yao for his inspiration. The first author is the recipient of the Chinese Academy of Sciences and The World Academy of Sciences (CAS-TWAS) Presidents Fellowship Programme.
Disclosure statement
No potential conflict of interest was reported by the author(s).
Data availability statement
The data that support the findings of this study are available on request from the corresponding author.
Additional information
Funding
References
- Bangsi D, Zhou J, Sun Y, Patel NP, Darga LL, Heilbrun LK, Powell IJ, Severson RK, et al. 2006. Impact of a genetic variant in CYP3A4 on risk and clinical presentation of prostate cancer among white and African–American men. Urol Oncol. 24(1):21–27.
- Bellah F, Salam A, Billah SMS, Karim R. 2022. Genome-wide association study of CYP3A4 and CYP3A5 genes in relation to the risk of Prostate Cancer among Bangladeshi population. PREPRINT (Version 1) available at Research Square.
- Bray F, Kiemeney L. 2017. Epidemiology of prostate cancer in Europe: patterns, trends and determinants. In: Bolla M, van Poppel H, editors. Management of prostate cancer: a multidisciplinary approach. Berlin: Springer-Verlag; p. 1–11.
- Bray F, Ferlay J, Soerjomataram I, Siegel RL, Torre LA, Jemal A. 2018. Global Cancer Statistics 2018: GLOBOCAN estimates of incidence and mortality worldwide for 36 cancers in 185 countries. CA Cancer J Clin. 68(6):394–424.
- Chandrashekar DS, Bashel B, Balasubramanya SAH, Creighton CJ, Ponce-Rodriguez I, Chakravarthi BVSK, Varambally S. 2017. UALCAN: a portal for facilitating tumor subgroup gene expression and survival analyses. Neoplasia. 19(8):649–658.
- Chou KC. 2015. Impacts of bioinformatics to medicinal chemistry. Med Chem. 11(3):218–234.
- Emoto C, Iwasaki K. 2006. Enzymatic characteristics of CYP3A5 and CYP3A4: a comparison of in vitro kinetic and drug-drug interaction patterns. Xenobiotica. 36(2–3):219–233.
- Fernandez P, Zeigler-Johnson CM, Spangler E, van der Merwe A, Jalloh M, Gueye SM, Rebbeck TR. 2012. Androgen metabolism gene polymorphisms, associations with prostate cancer risk and pathological characteristics: a comparative analysis between South African and Senegalese men. Prostate Cancer. 2012:798634.
- Islam MS, Ahmed MU, Sayeed MSB, Maruf AA, Mostofa AGM, Hussain SMA, Kabir Y, Daly AK, et al. 2013. Lung cancer risk in relation to nicotinic acetylcholine receptor, CYP2A6 and CYP1A1 genotypes in the Bangladeshi population. Clin Chim Acta. 416:11–19.
- Jemal A, Bray F, Center MM, Ferlay J, Ward E, Forman D. 2011. Global cancer statistics. CA Cancer J Clin. 61(2):69–90.
- Kedishvili NY. 2016. Retinoic acid synthesis and degradation. In: The biochemistry of retinoid signaling II. Berlin: Springer; p. 127–161.
- Kreutz R, Zuurman M, Kain S, Bolbrinker J, de Jong PE, Navis G. 2005. The role of the cytochrome P450 3A5 enzyme for blood pressure regulation in the general Caucasian population. Pharmacogenet Genomics. 15(12):831–837.
- Kuehl P, Zhang J, Lin Y, Lamba J, Assem M, Schuetz J, Watkins PB, Daly A, et al. 2001. Sequence diversity in CYP3A promoters and characterization of the genetic basis of polymorphic CYP3A5 expression. Nat Genet. 27(4):383–391.
- Leskelä S, Honrado E, Montero-Conde C, Landa I, Cascón A, Letón R, Talavera P, Cózar JM, et al. 2007. Cytochrome P450 3A5 is highly expressed in normal prostate cells but absent in prostate cancer. Endocr Relat Cancer. 14(3):645–654.
- Li T, Fu J, Zeng Z, Cohen D, Li J, Chen Q, Li B, Liu XS. 2020. TIMER2.0 for analysis of tumor-infiltrating immune cells. Nucleic Acids Res. 48:W509–W514.
- Nogal A, Coelho A, Catarino R, Morais A, Lobo F, Medeiros R. 2007. The CYP3A4*1B polymorphism and prostate cancer susceptibility in a Portuguese population. Cancer Genet Cytogenet. 177(2):149–152.
- Paris PL, Kupelian PA, Hall JM, Williams TL, Levin H, Klein EA, Casey G, Witte JS. 1999. Association between a CYP3A4 genetic variant and clinical presentation in African-American prostate cancer patients. Cancer Epidemiol Biomark Prev. 8:901–905.
- Plummer SJ, Conti DV, Paris PL, Curran AP, Casey G, Witte JS. 2003. CYP3A4 and CYP3A4 genotypes, haplotypes, and risk of prostate cancer. Cancer Epidemiol Biomark Prev. 12:928–932.
- Rais N, Chawla YK, Kohli KK. 2006. CYP3A phenotypes and genotypes in North Indians. Eur J Clin Pharmacol. 62(6):417–422.
- Rebbeck TR, Jaffe JM, Walker AH, Wein AJ, Malkowicz SB. 1998. Modification of clinical presentation of prostate tumors by a novel genetic variantin CYP3A4. J Natl Cancer Inst. 90(16):1225–1229.
- Sailaja K, Rao DN, Rao DR, Vishnupriya S. 2010. Analysis of CYP3A5*3 and CYP3A5*6 gene polymorphisms in Indian chronic myeloid leukemia patients. Asian Pac J Cancer Prev. 11(3):781–784.
- Salameh G, Hadidi KA, Khateeb ME. 2012. Genetic polymorphisms of the CYP3A4, CYP3A5, CYP3A7 and CYP1A2 among the Jordanian population. Environ Toxicol Pharmacol. 34(1):23–33.
- Spurdle AB, Goodwin B, Hodgson E, Hopper JL, Chen X, Purdie DM, McCredie MR, Giles GG, et al. 2002. The CYP3A4*1B polymorphism has no functional significance and is not associated with risk of breast or ovarian cancer. Pharmacogenetics. 12:355–366.
- Sung H, Ferlay J, Siegel RL, Laversanne M, Soerjomataram I, Jemal A, Bray F. 2021. Global Cancer Statistics 2020: GLOBOCAN estimates of incidence and mortality worldwide for 36 cancers in 185 countries. CA Cancer J Clin. 71(3):209–249.
- Tang Z, Li C, Kang B, Gao G, Li C, Zhang Z. 2017. GEPIA: a web server for cancer and normal gene expression profiling and interactive analyses. Nucleic Acids Res. 45(W1):W98–W102.
- Tayeb MT, Clark C, Sharp L, Haites NE, Rooney PH, Murray GI, Payne SN, McLeod HL. 2002. CYP3A4CYP3A4 promoter variant is associated with prostate cancer risk in men with benign prostate hyperplasia. Oncol Rep. 9(3):653–655.
- Thummel KE, O’Shea D, Paine MF, Shen DD, Kunze KL, Perkins JD, Wilkinson GR. 1996. Oral first-pass elimination of midazolam involves both gastrointestinal and hepatic CYP3A-mediated metabolism. Clin Pharmacol Ther. 59(5):491–502.
- Van Schaik RH. 2005. Cancer treatment and pharmacogenetics of cytochrome P450 enzymes. Invest New Drugs. 23(6):513–522.
- Walker AH, Jaffe JM, Gunasegaram S, Cummings SA, Huang CS, Chern HD, Olopade OI, Weber BL, et al. 1998. Characterization of an allelic variant in the nifedipine-specific element of CYP3A4: ethnic distribution and implications for prostate cancer risk. Mutations in brief no. 191. Hum Mutat. 12(4):289.
- Westlind A, Löfberg L, Tindberg N, Andersson TB, Ingelman-Sundberg M. 1999. Interindividual differences in hepatic expression of CYP3A4: relationship to genetic polymorphism in the 5'-upstream regulatory region. Biochem Biophys Res Commun. 259(1):201–205.
- World Medical Association. 2013. World Medical Association Declaration of Helsinki: ethical principles for medical research involving human subjects. JAMA. 310(20):2191–2194.
- Wrighton SA, Stevens JC. 1992. The human hepatic cytochromes P450 involved in drug metabolism. Crit Rev Toxicol. 22(1):1–21.
- Xu Y, Chou KC. 2016. Recent progress in predicting posttranslational modification sites in proteins. Curr Top Med Chem. 16(6):591–603.
- Zeigler-Johnson C, Friebel T, Walker AH, Wang Y, Spangler E, Panossian S, Patacsil M, Aplenc R, et al. 2004. CYP3A4, CYP3A5, and CYP3A43 genotypes and haplotypes in the etiology and severity of prostate cancer. Cancer Res. 64(22):8461–8467.
- Zhenhua L, Tsuchiya N, Narita S, Inoue T, Horikawa Y, Kakinuma H, Kato T, Ogawa O, et al. 2005. CYP3A5 gene polymorphism and risk of prostate cancer in a Japanese population. Cancer Lett. 225(2):237–243.