
Abstract
Background: The study was conducted in a Dallas lead smelter community following an Environmental Protection Agency (EPA) Superfund Cleanup project. Lead smelters operated in the Dallas community since the mid-1930s.Aim: To test the hypothesis that cadmium (Cd) exposure is associated with chronic kidney disease (CKD) ≥ stage 3.Subjects and methods: Subjects were African American residents aged ≥19 to ≤ 89 years (n=835). CKD ≥ stage 3 was predicted by blood Cd concentration with covariates.Results: In logistic regression analysis, CKD ≥ stage 3 was predicted by age ≥ 50 years (OR = 4.41, p < 0.0001), Cd level (OR = 1.89, p < .05), hypertension (OR = 3.15, p < 0.03), decades living in the community (OR = 1.34, p < 0.003) and T2DM (OR = 2.51, p < 0.01). Meta-analysis of 11 studies of Cd and CKD ≥ stage 3 yielded an ORRANDOM of 1.40 (p < 0.0001). Chronic environmental Cd exposure is associated with CKD ≥ stage 3 in a Dallas lead smelter community controlling covariates.Conclusion: Public health implications include screening for heavy metals including Cd, cleanup efforts to remove Cd from the environment and treating CKD with newer renal-sparing medications (e.g., SGLT-2 inhibitors, GLP-1s).
1. Introduction
Heavy metals are well-known environmental toxins, some of which are associated with chronic kidney disease (CKD). With the rapid increase in industrialisation over the past 100 years, trace metals have become an increasingly important source of pollution (Khan et al. Citation2021). This has resulted in a dramatic and increasing human-induced mobilisation of trace metals into the biosphere. Near the end of the last century, it was estimated that each year 1,160,000 tons of lead, 120,000 tons of arsenic, 30,000 tons of cadmium, and 11,000 tons of mercury were added to the biosphere (Khan et al. Citation2021). Worldwide toxicity of these “new” trace metals now exceeds the toxicity of all radioactive and organic wastes generated yearly.
Cd environmental contamination results from rechargeable nickel-cadmium batteries, smelting, mining, household waste incineration, fossil fuel combustion, and phosphate-containing fertilisers (Elinder and Järup Citation1996). Diet is the most important source of cadmium in non-smokers because of soil or water contamination. Greater than 80% of dietary Cd comes from contaminated cereals, vegetables and potatoes (Olsson et al. Citation2002). Cd also enters the body via the lung in cigarette smokers and with occupational exposure. Cd concentrates in tobacco plants, where the soil to plant transfer rate is very high. Smokers have kidney [Cd] 2–3.5-fold higher than non-smokers (Nilsson et al. Citation1995; Satarug et al. Citation2002), The Agency for Toxic Substances and Disease Registry has estimated that more than 500,000 workers in the United States are occupationally exposed to Cd primarily from dust and airborne particles from smelter activity (Jaishankar et al. Citation2014).
Cd absorbed in the GI tract is transported via the portal system to liver, where it binds metallothionein (MT). The Cd mode of toxicity is through its action as a free ion that is tightly bound by MT, which acts as a detoxifying mechanism (Satarug Citation2018). Cd-MT complexes also form in lung. Cd-MT is released into the systemic circulation where it is taken up by proximal tubular cells. Given the long biological half-life of Cd in kidney, 7–45 years, it remains there for decades (Järup et al. Citation1983; Fransson Citation2014). The Cd-MT complex enters endosomes and lysosomes in proximal tubule where proteases degrade MT releasing free Cd into the cytoplasm. Toxicity at a cellular level results from generation of reactive oxygen species, interference with normal DNA repair mechanisms and induction of apoptosis (Järup and Åkesson Citation2009).
The most common and earliest presentation of Cd-associated kidney disease is proximal tubular damage most frequently manifested by an increase in urinary excretion of low molecular weight (LMW) proteins such as β2-microglobulin (Järup and Åkesson Citation2009). LMW proteinuria is the subject of the majority of studies examining renal Cd effects. More severe tubular injury can result in phosphate wasting, aminoaciduria, renal glycosuria, decreased concentrating ability, and hypercalciuria. Hypercalciuria may be responsible for the increased incidence of nephrolithiasis reported with occupational Cd exposure (Järup and Elinder Citation1993). Interstitial inflammation and fibrosis can lead to glomerular damage, reduction in glomerular filtration rate, end-stage kidney disease (ESKD) and increased mortality (Nishijo et al. Citation2017). However, the association of Cd with significant glomerular disease (CKD ≥ stage 3) is less well described with some studies detecting increased risk (Ferraro et al. Citation2010; Navas-Acien et al. Citation2009; Chung et al. Citation2014; Lin et al. Citation2014; Wu et al. Citation2019; Lee et al. Citation2020; Yuan et al. Citation2020). Two studies found no association of Cd with CKD (Sommar et al. Citation2013; Tsai et al. Citation2021), and still others found increased risk in subpopulations such as women (Myong et al. Citation2012) and those with diabetes mellitus or hypertension (Kim et al. Citation2015). Knowledge gaps in the association of Cd exposure and CKD include: timing and magnitude of exposure, longitudinal data, ascertainment of exposure, CKD definition, and appropriate statistical methods. CKD definitions based upon laboratory eGFR values were not always used in prior studies, and attention must be given to appropriate treatment of chemical concentrations (eg transform to log10 values) (Moody et al. Citation2018, p. xxx). The present investigation provides known individual level exposures at a known time, and years of residence in the community (ie length of exposure). The final gap in Cd studies is lack of longitudinal studies. Unfortunately, a cross-sectional study that includes only one visit cannot address the need for serial data.
We previously reported an association of chronic environmental and occupational lead exposure with worsening kidney function in a group of African American residents in Dallas, Texas, exposed to lead smelters (Reilly et al. Citation2018). The smelters, which reprocessed Pb batteries, contaminated the environment with lead and Cd. Subsequently, we also reported an association between type II diabetes mellitus (T2DM) and Cd exposure in this same population (Little et al. Citation2020). In the present manuscript, we extend our previous studies and examine the relationship between Cd exposure and CKD ≥ stage 3. We also performed a meta-analysis of published literature examining the association between Cd and CKD ≥ stage 3.
2. Subjects and methods
The present study was evaluated by the Institutional Review Board at University of Texas Southwestern Medical Centre, Dallas, Texas and approved (IRB#0902-495, 4 September 2002) The study adheres to the Declaration of Helsinki.
2.1. Study population
Three lead smelters opened in 1934 in West Dallas (RSR). The first one was established in 1934. Two other lead smelters began operation near each other in East Dallas in the 1940s, in Cadillac Heights. Environmental lead was a known public health hazard in the mid-1960s. The City of Dallas Health Department began operating lead clinics for walk-in testing and conducted health surveys. Several lead remediation projects were done between 1970 and 1992, including soil removal. Blood lead levels in adults and children decreased only after the smelters closed. Smelting lead from slag and batteries released dust particle clouds over these communities. The West Dallas smelter was several blocks south of one of the city’s largest public housing developments. The last smelter closed in 1990. The West Dallas lead smelter area was designated an US Environmental Protection Agency (EPA) Superfund Site. The Superfund cleanup included topsoil removal from the area and renovation or demolition of old or dilapidated housing. New public housing was built in the old smelter communities after environmental remediation.
2.2. Study design
The study population is a convenience sample made up of African Americans living in postal codes where the smelters operated (1946–1984). In the total sample there were seven whites, 46 Hispanics, and three “Other race” individuals. They were excluded because there was such a small number, and excluding them achieved high homogeneity of ethnicity of individuals included. Participants were recruited through town hall meetings and public service media announcements in the media (radio, television and newspapers). People living in the following zip codes were included in the study sample: 75203, 75208, 75211, 75212, 75215, 75216, and 75247. The vast majority were from the West Dallas smelter community. Physical examinations and clinical laboratory tests were conducted. Inclusion criteria were having valid values listed for age, sex, creatinine and race, for eGFR calculation; BMI, blood pressure, HbA1c, GGT concentration, tobacco smoking status, heavy metal levels (Cd, Pb, Ar, Hg) and lived in a smelter area zip code. Eight hundred and seventy-five individuals met these criteria. Of 875 individuals who met inclusion criteria, 55 were male smelter-working residents and 820 were non-smelter working residents. Fourteen female smelter-working residents were excluded because of missing values. Hypertension (blood pressure ≥140/90 mmHg) was dummy coded (0,1) for regression analysis. Smoking was coded current smoker (one-half pack per day of cigarettes or more =1) or non-smoker (value =0). T2DM was defined with an HbA1c value of 6.5%, as recommended by the American Diabetes Association (American Diabetes Association Citation2020). T2DM (HbA1c ≥6.5%) was dummy coded (0, 1) for regression analysis. BMI was analysed as a continuous variable because all individuals in the study were obese (BMI >30).
2.3. Estimated glomerular filtration rate (eGFR)
Estimated glomerular filtration rate (eGFR) was calculated using the MDRD (Modification of Diet in Renal Disease) equation for African Americans: male eGFR = 186 × serum creatinine−1.154×age−0.203×1.21 and female eGFR = 186 × serum creatinine−1.154×age−0.203×1.21 × 0.742 (Levey et al. Citation1999). The MDRD equation was used to allow comparison results to previous studies that also used this equation. Due to rightward skewing, blood Cd level was log10 transformed (>1.0) and is the usual transform for chemical concentrations.
2.4. Analytical techniques
Logistic regression was used to analyse demographics and heavy metal exposure to prediction of CKD ≥ stage 3 status. A systematic literature review was done. Meta-analysis of studies that met inclusion criteria (reported primary data, sample sizes, Cd blood or urine levels, method of Cd level determination, and a generally recognised endpoint for CKD ≥ stage 3) was also conducted. For inclusion, a study included a recognised endpoint, eGFR ≤60 ml/min/1.73m2 (CKD ≥ Stage 3), which was calculated using either the MDRD or CKD-EPI (Chronic Kidney Disease Epidemiology Collaboration) equations, dialysis or renal transplantation.
The dependence of CKD ≥ stage 3 (0,1) on independent variables was analysed with logistic regression with the null hypothesis that CKD ≥ stage 3 is not dependent on exposure to Cd or other metals. The regression model was: CKD ≥ stage 3 (0,1) = age >50 years (0,1) + sex: male (0,1) + smelter worker (0,1) + log10 (blood Cd level) + log10 (blood arsenic level) + log10 (blood mercury level) + log10 (blood lead level) + duration of residence (decades) + T2DM (0,1) + hypertension (0,1) + T2DM (0,1) + smoking tobacco (0,1) + abnormal gamma-glutamyl-transpeptidase (GGT) (0,1), where 0 = No, 1 = Yes. Software SAS (v.9.1, SAS Institute, Cary, NC, USA) and IBM SPSS (v.27, IBM, Chicago, IL, USA) were used for data analysis. Arsenic was ultimately dropped from the analysis because it caused multicollinearity.
2.5. Meta-analysis
Meta-analysis using Comprehensive Meta-Analysis, Version 3 (Biostat, Englewood, NJ, USA) was done. Of the studies that reported CKD and cadmium exposure (n = 125), we included only those published studies in which individual exposures were documented and analysed (n = 11, see ). Studies that used an ecological approach (see ) were excluded because there is no documentation of an individual’s exposure. Such studies are confounded by the ecological fallacy (ie associating group characteristics to individuals without individual level data) (Schwartz Citation1994). Studies were also excluded from the meta-analysis for non-standard reporting of renal function (Haswell-Elkins et al. Citation2008), different CKD measures (Mason et al. Citation1988; Boonprasert et al. Citation2018), estimated Cd intake based on dietary intake without quantifying Cd in the food (Thomas et al. Citation2014; Shi et al. Citation2018; Wang et al. Citation2021), and risk based on estimated exposure but no actual measurement of Cd concentration (Hellström et al. Citation2001).
Table 3. Selected studies examining the relationship between Cd and CKD ≥ stage 3/ESKD (exposure based on blood or urine [Cd] [A] and dietary surveys or proximity to battery plants (ie ecological fallacy) [B]).
3. Results
3.1. Entire study population
The baseline characteristics of the study sample are shown in subdivided by the presence or absence of CKD ≥ stage 3. In the entire study population, the results of binary logistic regression are shown in . Cd increased the odds of CKD ≥ stage 3 by 1.89-fold, and lead (Pb) by 1.13-fold. Age over 50 years increased the odds of CKD ≥ stage 3 by 4.41-fold. Each decade a person lived in the smelter community increased the odds of CKD ≥ stage 3 by 1.34. Hypertension increased the chances of CKD ≥ stage 3 by 3.15-fold, and having T2DM increased likelihood by 2.51-fold. Smoking was protective from developing CKD ≥ stage 3 with an OR =0.26 (95% CI: 0.11–0.62, p < .002).
Table 1. Baseline characteristics for total sample and subgroups.
Table 2. Binary logistic regression of CKD Stage≥ 3 and covariates on Cd.
3.2. Age <50 years
Among those less than 50 years old (), Cd was associated with a non-significant 2.27-fold increase in CKD ≥ stage 3. The effect of lead (Pb) was not significant and small (OR =1.02). Hypertension increased the odds of CKD ≥ stage 3 by 8.82-fold (p < .05).
3.3. Age ≥50 years
Individuals 50 years and older, Cd () had a significantly increased odds of CKD ≥ stage 3 (OR =2.13, p < .05), as did Pb (OR =1.14, p < .01). Being resident in the community significantly (p < .004) increased the odds of CKD ≥ stage 3 by 1.38-fold for each decade of residence. T2DM had an increased risk of CKD ≥ stage 3 (OR =2.58, p < .02).
3.4. Meta-analysis
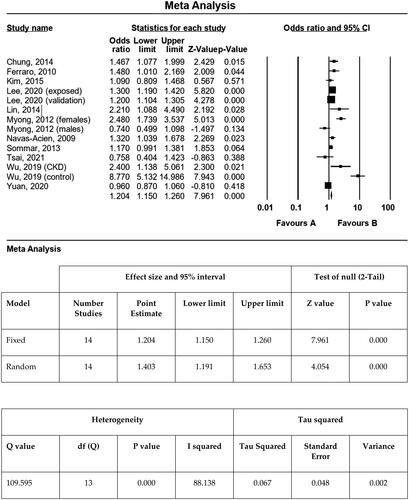
Meta-analysis of 11 studies (see ), shown in , selected for data quality and measures of CKD found an ORFIXED of 1.20 (95% CI: 1.15–1.26, p < .0001). Several studies were excluded for data quality or measurement reporting issues. The fixed effects OR (ORFIXED =1.20) was lower than the random effects (ORRANDOM = 1.40; 95% CI: 1.19–1.65, p < .001) (). ORRANDOM is the correct estimate because the sample studies analysed were drawn from populations that differ from one another in ways that could affect the treatment effect and the analysis had high heterogeneity (ie different environmental sources and concentrations of Cd, ethnic differences, etc.). Q indicated the presence of high heterogeneity (Q = 109.6, p < .0001), and I2 measures showed substantial heterogeneity (I2 = 88.1%); tau (standard deviation) = 0.26 and tau2 (variance) = 0.07 indicated a moderately high degree of true variance in the meta-analysis (0.26 and 0.07, respectively). Notably, heterogeneity is expected in meta-analysis, but extent of heterogeneity is important. In summary, Cd is associated with an increased odds for CKD ≥ stage 3 in the regression analysis of the Dallas smelter community (OR = 1.89, 95% CI: 1.02–3.49), which is not significantly higher than the meta-analysis of select published studies (OR = 1.20, 95% CI: 1.15–1.26) that reported individual Cd toxicology exposure levels.
Figure 1. Meta-analysis of cadmium and chronic kidney disease (CKD).
4. Discussion
Cd exposure increased the odds of CKD ≥ stage 3 by 1.89-fold. Covariates’ risk was increased by age >50 years (OR =4.41), decades lived in the smelter community (OR = 1.34), T2DM (OR = 2.15) and hypertension (OR = 3.15), smoking tobacco (OR = 0.26), and Pb exposure (OR = 1.13).
4.1. Age
In our study age ≥50 years increased risk of Cd-related CKD ≥ stage 3 by 4.41-fold, a common finding in other cross-sectional studies that examined the effect of age (Navas-Acien et al. Citation2009; Ferraro et al. Citation2010; Myong et al. Citation2012; Chung et al. Citation2014). In the OSCAR study evaluating the relationship between low level Cd exposure and early kidney damage the prevalence of proteinuria increased with age (Järup et al. Citation2000), and renal tubular damage occurred at lower total body Cd burdens than previously thought (urinary Cd concentration 1.0 nmol/mol creatinine). Cd exerts toxic effects on the kidney at low doses with no apparent threshold. A Cd risk assessment was carried out in relation to the background risk of CKD (Ginsberg Citation2012). Ginsberg used data from ten studies to determine the extra risk of CKD over baseline in women of two specific ages (47.8 and 75 years). At a daily Cd intake of 1.0 µg/kg/day (World Health Organisation tolerable intake level) in a 47.8 year-old woman there was a 25% increased risk of CKD. At a ten-fold lower intake (Agency for Toxic Substances and Disease Registry chronic minimum risk level) at age 47.8 years, there was a 2.7% increased risk and 3.4% at age 75. The Cd-induced effect was more pronounced with increasing age (10.5 cases per 1000 at age 75 vs. 1.5 cases per 1000 at age 30). The authors postulated that this was due to a decline in functional reserve and reduced homeostatic mechanisms. Taken together all of these studies show that age increases the risk of Cd-induced glomerular and tubular injury.
4.2. Diabetes mellitus
We found that diabetes mellitus increased the risk of Cd-associated CKD ≥ stage 3 by 2.51-fold. In other cross-sectional studies that examined this variable two studies detected an association (Lin et al. Citation2014; Kim et al. Citation2015) and two did not (Navas-Acien et al. Citation2009; Chung et al. Citation2014). The two most common causes of CKD are diabetes mellitus (DM) and hypertension. Others and we have shown an association between Cd exposure and T2DM (Little et al. Citation2020). Interestingly, not only does Cd potentiate diabetes-induced kidney injury but diabetics are also at increased risk for Cd-induced kidney damage (Buchet et al. Citation1990; Akesson et al. Citation2005). Cd exposure increased the risk of diabetic nephropathy (microalbuminuria) in Swedish women (Barregard et al. Citation2014), and Aboriginal and Torres Strait Islander Australians (Haswell-Elkins et al. Citation2008). Women may be more susceptible because they have higher total body Cd burdens for any given environmental exposure than men (Buchet et al. Citation1990), perhaps because like Pb oral Cd absorption increases with decreasing iron stores.
4.3. Hypertension
We also found that hypertension was associated with a 3.15-fold increased risk of Cd-associated CKD ≥ stage 3. In four other cross-sectional studies that examined the effect of hypertension, three found an association (Navas-Acien et al. Citation2009; Lin et al. Citation2014; Kim et al. Citation2015) and one did not (Chung et al. Citation2014). In an analysis of the Korean National Health and Nutrition Examination Survey (KNHANES) a two-fold increase in blood Cd concentration was associated with a small but statistically significant increase in systolic, 3.2 mmHg in women and 3.87 mmHg in men, and diastolic blood pressure, 2.24 mmHg in women and 1.98 mmHg in men (40). A doubling in serum [Cd] increased the risk of hypertension 31.5% in men and 18.6% in women with long-term Cd exposure. In a group of Thai women, urinary 20-HETE levels were increased in those with hypertension compared to normotensives suggesting a possible pathophysiologic mechanism (Kim and Lee Citation2012). 20-HETE is involved in renal salt balance and blood pressure regulation.
4.4. Smoking
Of the risk factors examined in cross-sectional studies smoking was the one with the most inconsistent results. We found that smoking was protective, as did one other report (Myong et al. Citation2012); others found either no effect (Lin et al. Citation2014), an effect in former but not current smokers (Navas-Acien et al. Citation2009), or an association in smokers (Chung et al. Citation2014). The reasons for these disparate results are unclear. Perhaps if information were available about former or present smoker the result would be different. It is also possible smokers have lower life expectancy, and are underrepresented in the older (≥ 50 years) age group, which is the age range of the preponderance of individuals with CKD ≤ Stage 3.
4.5. Meta analysis
In a prior systematic review of the association of Cd and CKD in workers and the general population, the authors concluded that a meta-analysis could not be conducted due to a lack of information about methods used, risk of bias and heterogeneity (Byber et al. Citation2017). Only one previously published meta-analysis has examined heavy metal exposure and CKD risk (Jalili et al. Citation2021). Cd exposure was associated with proteinuria (OR =1.25; 95% CI: 1.04–1.49, p = .02). A statistically significant association was not detected between Cd exposure and decreased eGFR (OR =1.09; 95% CI: 0.98–1.20, p = .10). Subgroup analysis showed that older adults (age >65 years), those with hypertension, and African Americans were at increased risk. Our meta-analysis of select published studies () differs in that we only included studies that used a standard definition of CKD, based on the MDRD or CKD-EPI equations (), and not different cut-off values (Hwangbo et al. Citation2011, p. 45), the Cockcroft Gault equation (Kaewnate et al. Citation2012) or percentiles of eGFR (Kim and Lee Citation2012). One of their included studies does not appear to include any data on eGFR (Wang et al. Citation2016). We included two additional recently reported studies (Lee et al. Citation2020; Tsai et al. Citation2021), for a total of 11 reports that contained sufficient information for a meta-analysis, with an estimated ORFIXED of 1.20 (95% CI: 1.15–1.26, p < .0001). This indicates Cd exposure increases ORFIXED of 1.20 (95% CI: 1.15–1.26, p < .0001) of CKD ≥ stage 3 by approximately 20%.
4.6. Possible mechanisms
Based on observations in both humans and animals it is biologically plausible that environmental or occupational Cd exposure could result in CKD. LMW proteinuria, an indicator of proximal tubular damage, is the most common Cd-related renal disorder in humans and is a good indicator of renal dysfunction in moderate to severe chronic Cd exposure. In a small series of patients from Japan, there was an inverse association between LMW proteinuria and creatinine clearance (Nogawa Citation1984). A similar association was also noted in solderers in Sweden (Järup et al. Citation1995). Tubular proteinuria increases with both higher urinary Cd concentration and increasing age (Mason et al. Citation1988; Shi et al. Citation2018). Chronic tubulointerstitial injury can result in a secondary decline in GFR. In addition, Cd exposure may also cause direct glomerular injury. When human glomerular endothelial cells are exposed to Cd in vivo, the permeability of the monolayer is increased (Li et al. Citation2016). This hyperpermeability is the result of the dislocation of adherens junction proteins β-catenin and VE-cadherin, as well as activation of the p38 MAPK (mitogen activated protein kinase) signalling pathway. When mesangial cells are exposed to Cd, cell death is initiated through apoptotic and apoptotic-like mechanisms that can be caspase dependent or independent (Li et al. Citation2016). Taken together these findings indicate that Cd exposure can result in both tubular and glomerular injury, which can act to reduce GFR.
5. Limitations
The major limitation of this study is the sample size of those with CKD ≥3, 51/857 (6%). The second limitation is the sample of convenience strategy. A third limitation is the inclusion of only African Americans, which ultimately strengthened the analysis by making the sample homogenous with respect to race. The novelty of the analysis is the extensive testing of study subjects included, and knowledge at the individual level of whether or not the participants worked at the smelters, how long and where they lived in the smelter community, and extensive medicinal chemistry evaluation in various test panels (CBC, heavy metals, lipid, renal, liver) for each individual. Our current data analysis includes follow-up data collected a decade after the Superfund Cleanup.
6. Environmental cadmium exposure and public health implications
Public health implications of environmental Cd exposure include medical, sociodemographic and economic factors. Obviously, the overarching public intervention is to remove the environmental sources of Cd exposure. In the present study, Pb screenings identified at risk individuals, targeted environmental interventions (eg Pb paint removal), but no sustainable reduction in blood Pb was achieved. The EPA Superfund project removed top soil and the City replaced public housing, which did reduce blood Pb levels. Cadmium screenings were incidental and part of the heavy metal panel.
In reference to specific health effects in the present study, renal function screening in Cd exposed populations should have allowed monitoring and possible interventions when CKD Stage 3B was reached, but Cd was not part of the initial Pb screenings in the 1970–1980s. Broadening indications for SGLT-2 inhibitor and GLP-1 families of antihyperglycemic drugs include therapy for CKD (Chen et al. Citation2022; Yau et al. Citation2022). These drugs have apparent potential for treating impaired renal function, but those who need treatment must be identified, hence the role of screening programs in areas at high risk of Cd exposure.
Sociodemographic and economic public health aspects of the present study in chronological order of the West Dallas smelter communities include: screenings for Pb in the early 1970s, as international warnings about Cd toxicity were emerging. The smelters in West Dallas were first established in the 1930s. In the 1940s–1950s, communities grew up around the smelters as employees and their families established neighbourhoods, before Pb and Cd toxicity were known. The City of Dallas built public housing in the area in the 1940s and 1950s to meet the need to housing. It took 20 years to launch an EPA Superfund cleanup after the first studies indicated deleterious effects from Cd and Pb exposure. Ultimately, Cd and Pb levels were decreased to safe levels.
The public health aspect of this anecdote is the sequence of events. Toxicity abatement and prevention in high-risk populations must consider the history of how neighbourhoods came to be sited in high-risk areas. The push-pull demographic factors drew people to the neighbourhoods for economic reasons (employment), and the City responded to housing demand 20 years before Pb and Cd toxicity were known. The EPA Superfund cleanup 40+ years later improved the safety profiles of public housing, elementary, middle and high schools that were sited within blocks of the smelters. In summary, among historically environmentally exposed Pb and Cd exposed populations, more rapid cleanups would prevent harm to many people. Health screenings should be conducted routinely to document high-risk areas and efficacious remediation.
7. Conclusions
In conclusion, Cd increases the risk of CKD ≥ stage 3 in a Dallas Superfund site lead smelter community. Meta-analysis of 11 studies supports the increased risk, and this association is biologically plausible. Collectively, the available data supports an increased risk of 30–89% of CKD ≥ stage 3 associated with Cd. Subgroups of patients may be particularly vulnerable such as the elderly, and those with diabetics and/or hypertensives.
Acknowledgements
Dr. Robert Reilly made huge contributions to this manuscript and should be the lead author. He made the decision to leave academia and requested that he not be an author. However, we acknowledge his contributions to this manuscript and the renal health of generations of US Veterans. We wish him all the best.
Disclosure statement
No potential conflict of interest was reported by the author(s).
Data availability statement
Data sharing is not available as this is protected by stipulations in the IRB.
Additional information
Funding
References
- Akesson A, Lundh T, Vahter M, Bjellerup P, Lidfeldt J, Nerbrand C, Samsioe G, Strömberg U, Skerfving S. 2005. Tubular and glomerular kidney effects in Swedish women with low environmental cadmium exposure. Environ Health Perspect. 113(11):1627–1631. doi: 10.1289/ehp.8033.
- American Diabetes Association. 2020. Glycemic targets and standards of medical care in diabetes-2020. Diabetes Care. 43(Suppl 1):S66–S76.
- Anupama YJ, Kiran SK, Hegde SN. 2019. Heavy metals and pesticides in chronic kidney disease–results from a matched case–control study from a rural population in Shivamogga district in South India. Indian J Nephrol. 29(6):402–409. doi: 10.4103/ijn.IJN_325_18.
- Barregard L, Bergstrom G, Fagerberg B. 2014. Cadmium, type 2 diabetes, and kidney damage in a cohort of middle-aged women. Environ Res. 135:311–316. doi: 10.1016/j.envres.2014.09.017.
- Boonprasert K, Vesey DA, Gobe GC, Ruenweerayut R, Johnson DW, Na-Bangchang K, Satarug S. 2018. Is renal tubular cadmium toxicity clinically relevant? Clin Kidney J. 11(5):681–687. doi: 10.1093/ckj/sfx153.
- Buchet JP, Lauwerys R, Roels H, Bernard A, Bruaux P, Claeys F, Ducoffre G, de Plaen P, Staessen J, Amery A, et al. 1990. Renal effects of cadmium body burden of the general population. Lancet. 336(8717):699–702. doi: 10.1016/0140-6736(90)92201-r.
- Byber K, Lison D, Verougstraete V, Dressel H, Hotz P. 2017. Cadmium or cadmium compounds and chronic kidney disease in workers and the general population: a systematic review. Crit Rev Toxicol. 47 (10):902–903. doi: 10.1080/10408444.2017.1375899.
- Chen J-J, Wu C-Y, Jenq C-C, Lee T-H, Tsai C-Y, Tu H-T, Huang Y-T, Yen C-L, Yen T-H, Chen Y-C, et al. 2022. Association of glucagon-like peptide-1 receptor agonist vs dipeptidyl peptidase-4 inhibitor use with mortality among patients with type 2 diabetes and advanced chronic kidney disease. JAMA Netw Open. 5(3):e221169-e221169. doi: 10.1001/jamanetworkopen.2022.1169.
- Chung S, Chung JH, Kim SJ, Koh ES, Yoon HE, Park CW, Chang YS, Shin SJ. 2014. Blood lead and cadmium levels and renal function in Korean adults. Clin Exp Nephrol. 18 (5):735–736. doi: 10.1007/s10157-014-0959-0.
- Elinder C-G, Järup L. 1996. Cadmium exposure and health risks: recent findings. Ambio. 25:370–373.
- Ferraro PM, Costanzi S, Naticchia A, Sturniolo A, Gambaro G. 2010. Low level exposure to cadmium increases the risk of chronic kidney disease: analysis of the NHANES. BMC Public Health. 10:304. doi: 10.1186/1471-2458-10-304.
- Fransson MN, Barregard L, Sallsten G, Akerstrom M, Johanson G. 2014. Physiologically-based toxicokinetic model for cadmium using Markov-Chain Monte Carlo analysis of concentrations in blood, urine, and kidney cortex from living kidney donors. Toxicol Sci. 141(2):365–376. doi: 10.1093/toxsci/kfu129.
- Ginsberg GL. 2012. Cadmium risk assessment in relation to background risk of chronic kidney disease. J Toxicol Environ Health A. 75(7):374–390. doi: 10.1080/15287394.2012.670895.
- Haswell-Elkins M, Satarug S, ‘O’Rourke P, Moore M, Ng J, McGrath V, Walmby M. 2008. Striking association between urinary cadmium level and albuminuria among Torres Strait Islander people with diabetes. Environ Res. 106(3):379–383. doi: 10.1016/j.envres.2007.10.004.
- Hellström L, Elinder CG, Dahlberg B, Lundberg M, Järup L, Persson B, Axelson O. 2001. Cadmium exposure and end-stage renal disease. Am J Kidney Dis. 38(5):1001–1008. doi: 10.1053/ajkd.2001.28589.
- Hwangbo Y, Weaver VM, Tellez-Plaza M, Guallar E, Lee B-K, Navas-Acien A. 2011. Blood cadmium and estimated glomerular filtration rate in Korean adults. Environ Health Perspect 119(12):1800–1805. doi: 10.1289/ehp.1003054.
- Jaishankar M, Tseten T, Anbalagan N, Mathew BB, Beeregowda KN. 2014. Toxicity, mechanism and health effects of some heavy metals. Interdiscip Toxicol. 7(2):60–72. doi: 10.2478/intox-2014-0009.
- Jalili C, Kazemi M, Cheng H, Mohammadi H, Babaei A, Taheri E, Moradi S. 2021. Associations between exposure to heavy metals and the risk of chronic kidney disease: a systematic review and meta-analysis. Crit Rev Toxicol. 51(2):165–182. doi: 10.1080/10408444.2021.1891196.
- Järup L, Åkesson A. 2009. Current status of cadmium as an environmental health problem. Toxicol Appl Pharmacol. 238(3):201–208. doi: 10.1016/j.taap.2009.04.020.
- Järup L, Elinder CG. 1993. Incidence of renal stones among cadmium exposed battery workers. Br J Ind Med. 50(7):598–602.
- Järup L, Hellström L, Alfvén T, Carlsson MD, Grubb A, Persson B, Pettersson C, Spång G, Schütz A, Elinder CG. 2000. Low level exposure to cadmium and early kidney damage: the OSCAR study. Occup Environ Med. 57(10):668–672. doi: 10.1136/oem.57.10.668.
- Järup L, Persson B, Elinder CG. 1995. Decreased glomerular filtration rate in solderers exposed to cadmium. Occup Environ Med. 52(12):818–822. doi: 10.1136/oem.52.12.818.
- Järup L, Rogenfelt A, Elinder CG, Nogawa K, Kjellström T. 1983. Biological half-time of cadmium in the blood of workers after cessation of exposure. Scand J Work Environ Health. 9(4):327–331. doi: 10.5271/sjweh.2404.
- Kaewnate Y, Niyomtam S, Tangvarasittichai O, Meemark S, Pingmuangkaew P, Tangvarasittichai S. 2012. Association of elevated urinary cadmium with urinary stone, hypercalciuria and renal tubular dysfunction in the population of cadmium-contaminated area. Bull Environ Contam Toxicol. 89(6):1120–1124. doi: 10.1007/s00128-012-0856-8.
- Khan S, Naushad M, Lima EC, Zhang S, Shaheen SM, Rinklebe J. 2021. Global soil pollution by toxic elements: current status and future perspectives on the risk assessment and remediation strategies–a review. J Hazard Mater. 417:126039. doi: 10.1016/j.jhazmat.2021.126039.
- Kim NH, Hyun YY, Lee KB, Chang Y, Ryu S, Oh KH, Ahn C. 2015. Environmental heavy metal exposure and chronic kidney disease in the general population. J Korean Med Sci. 30(3):272–277. doi: 10.3346/jkms.2015.30.3.272.
- Kim Y, Lee B-K. 2012. Associations of blood lead, cadmium, and mercury with estimated glomerular filtration rate in the Korean general population: analysis of 2008-2010 Korean National Health and Nutrition Examination Survey data. Environ Res. 118:124–129. doi: 10.1016/j.envres.2012.06.003.
- Lee J, Oh S, Kang H, Kim S, Lee G, Li L, Kim CT, An JN, Oh YK, Lim CS, et al. 2020. Environment-wide association study of CKD. Clin J Am Soc Nephrol. 15(6):766–775. doi: 10.2215/CJN.06780619.
- Levey AS, Bosch JP, Lewis JB, Greene T, Rogers N, Roth D. 1999. A more accurate method to estimate glomerular filtration rate from serum creatinine: a new prediction equation. Ann Intern Med. 130(6):461–470. doi: 10.7326/0003-4819-130-6-199903160-00002.
- Li L, Dong F, Dongmei X, Du L, Yan S, Hu H, Lobe CG, Yi F, Kapron CM, Liu J. 2016. Short-term, low-dose cadmium exposure induces hyperpermeability in human renal glomerular endothelial cells. J Appl Toxicol. 36(2):257–265. doi: 10.1002/jat.3168.
- Lin YS, Ho WC, Caffrey JL, Sonawane B. 2014. Low serum zinc is associated with elevated risk of cadmium nephrotoxicity. Environ Res. 134:33–38. doi: 10.1016/j.envres.2014.06.013.
- Little BB, Reilly R, Walsh B, Vo GT. 2020. Cadmium is associated with type 2 diabetes in a superfund site lead smelter community in Dallas, Texas. Int J Environ Res Public Health. 17(2):4558. doi: 10.3390/ijerph17124558.
- Mason HJ, Davison AG, Wright AL, Guthrie CJ, Fayers PM, Venables KM, Smith NJ, Chettle DR, Franklin DM, Scott MC. 1988. Relations between liver cadmium, cumulative exposure, and renal function in cadmium alloy workers. Br J Ind Med. 45(12):793–802. doi: 10.1136/oem.45.12.793.
- Moody EC, Coca SG, Sanders AP. 2018. Toxic metals and chronic kidney disease: a systematic review of recent literature. Curr Environ Health Rep. 5(4):453–463. doi: 10.1007/s40572-018-0212-1.
- Myong JP, Kim HR, Baker D, Choi B. 2012. Blood cadmium and moderate-to-severe glomerular dysfunction in Korean adults: analysis of KNHANES 2005-2008 data. Int Arch Occup Environ Health. 85(8):885–893. doi: 10.1007/s00420-012-0737-9.
- Navas-Acien A, Tellez-Plaza M, Guallar E, Muntner P, Silbergeld E, Jaar B, Weaver V. 2009. Blood cadmium and lead and chronic kidney disease in US adults: a joint analysis. Am J Epidemiol. 170(9):1156–1164. doi: 10.1093/aje/kwp248.
- Nilsson U, Schutz A, Skerfving S, Mattsson S. 1995. Cadmium in kidneys in Swedes measured in vivo using X-ray fluorescence analysis. Int Arch Occup Environ Health. 67(6):405–411. doi: 10.1007/BF00381053.
- Nishijo M, Nakagawa H, Suwazono Y, Nogawa K, Kido T. 2017. Causes of death in patients with Itai-itai disease suffering from severe chronic cadmium poisoning: a nested case-control analysis of a follow-up study in Japan. BMJ Open. 7(7):e015694. doi: 10.1136/bmjopen-2016-015694.
- Nogawa K. 1984. Biologic indicators of cadmium nephrotoxicity in persons with low-level cadmium exposure. Environ Health Perspect. 54:163–169. doi: 10.1289/ehp.8454163.
- Olsson IM, Bensryd I, Lundh T, Ottosson H, Skerfving S, Oskarsson A. 2002. Cadmium in blood and urine - impact of sex, age, dietary intake, iron status, and former smoking-association of renal effects. Environ Health Perspect. 110(12):1185–1190. doi: 10.1289/ehp.021101185.
- Reilly R, Spalding S, Walsh B, Wainer J, Pickens S, Royster M, Villanacci J, Little BB. 2018. Chronic environmental and occupational lead exposure and kidney function among African Americans: Dallas Lead Project II. Int J Environ Res Public Health. 15(12):2875. doi: 10.3390/ijerph15122875.
- Satarug S. 2018. Dietary cadmium intake and its effects on kidneys. Toxics. 6(1):15. doi: 10.3390/toxics6010015.
- Satarug S, Baker JR, Reilly PEB, Moore MR, Williams DJ. 2002. Cadmium levels in the lung, liver, kidney cortex, and urine samples from Australians without occupational exposure to metals. Arch Environ Health. 57(1):69–77. doi: 10.1080/00039890209602919.
- Schwartz S. 1994. The fallacy of the ecological fallacy: the potential misuse of a concept and the consequences. Am J Public Health. 84(5):819–824. doi: 10.2105/ajph.84.5.819.
- Shi Z, Taylor AW, Riley M, Byles J, Liu J, Noakes M. 2018. Association between dietary patterns, cadmium intake and chronic kidney disease among adults. Clin Nutr. 37(1):276–284. doi: 10.1016/j.clnu.2016.12.025.
- Sommar JN, Svensson MK, Björ BM, Elmståhl SI, Hallmans G, Lundh T, Schön SMI, Skerfving S, Bergdahl IA. 2013. End-stage renal disease and low-level exposure to lead, cadmium and mercury; a population-based, prospective nested case-referent study in Sweden. Environ Health. 12:9. doi: 10.1186/1476-069X-12-9.
- Thomas LD, Elinder CG, Wolk A, Åkesson A. 2014. Dietary cadmium exposure and chronic kidney disease: a population-based prospective cohort study of men and women. Int J Hyg Environ Health. 217(7):720–725. doi: 10.1016/j.ijheh.2014.03.001.
- Tsai HJ, Hung CH, Wang CW, Tu HP, Li CH, Tsai CC, Lin WY, Chen SC, Kuo CH. 2021. Associations among heavy metals and proteinuria and chronic kidney disease. Diagnostics. 11(2):282. doi: 10.3390/diagnostics11020282.
- Wang X, Cui W, Wang M, Liang Y, Zhu G, Jin T, Chen X. 2021. The association between life-time dietary cadmium intake from rice and chronic kidney disease. Ecotoxicol Environ Saf. 211:111933. doi: 10.1016/j.ecoenv.2021.111933.
- Wang X, Wang Y, Feng L, Tong Y, Chen Z, Ying S, Chen T, Li T, Xia H, Jiang Z, et al. 2016. Application of the benchmark dose (BMD) method to identify thresholds of cadmium-induced renal effects in non-polluted areas in China. PLoS One. 11(8):e0161240. doi: 10.1371/journal.pone.0161240.
- Wu CY, Wong CS, Chung CJ, Wu MY, Huang YL, Ao PL, Lin YF, Lin YC, Shiue HS, Su CT, et al. 2019. The association between plasma selenium and chronic kidney disease related to lead, cadmium and arsenic exposure in a Taiwanese population. J Hazard Mater. 375:224–232. doi: 10.1016/j.jhazmat.2019.04.082.
- Yau K, Dharia A, Alrowiyti I, Cherney DZ. 2022. Prescribing SGLT2 inhibitors in patients with chronic kidney disease: expanding indications and practical considerations. Kidney Int Rep. 7(7):1463–1476. doi: 10.1016/j.ekir.2022.04.094.
- Yuan TH, Ke DY, Wang JE, Chan CC. 2020. Associations between renal functions and exposure of arsenic and polycyclic aromatic hydrocarbon in adults living near a petrochemical complex. Environ Pollut. 256:113457. doi: 10.1016/j.envpol.2019.113457.