
Abstract
Background
The high prevalence of underweight in young women has become a serious health problem in Japan. When and how young women reach a low body mass index (BMI) has not been clarified.
Aim
To clarify the characteristics of BMI standard deviation scores (BMI SDS) trajectory of young Japanese women with underweight.
Subjects and methods
A total of 601 Japanese female university students aged 20 years were classified into underweight and healthy weight groups. Their school health check-up data were available from the ages of 6 to 20 years. We evaluated the estimated mean values of BMI SDS at each age and differences in BMI SDS (ΔBMI SDS) from 6 years to each age using a mixed-effects model and compared between the two groups at each age.
Results
In the underweight group, the BMI SDS at every age (−1.67 to −0.91) and the ΔBMI SDS after 16 years of age (−0.76 to −0.38) were significantly lower than those in the healthy weight group (−0.41 to −0.13, −0.07 to 0.04), respectively.
Conclusion
Young Japanese women with underweight have at least two characteristics of BMI SDS trajectory: being constitutionally underweight and shifting their weight status from baseline towards underweight in their late teens.
Keywords:
Introduction
Underweight in women has become a serious health problem in Japan. According to the latest data published by the World Health Organisation (WHO Citation2016), the prevalence of underweight (body mass index [BMI] < 18.5 kg/m2) was 9.7% among women in Japan. This percentage was at the same level as that in most African countries and was higher than that of Western countries (1–3%) and other Asian countries, such as China, South Korea, and Singapore (6–8%).
The prevalence of underweight has become much higher in young women than in middle-aged and older women. The latest National Health and Nutrition Survey (MHLW 2019) found that the prevalence of underweight in women in their 20s, 40s, and 70s was 20.7%, 12.9%, and 9.7%, respectively. The prevalence of underweight in women in their 20s has increased from 13.1% in 1980 to approximately 20% in the 2000s (MHLW 2017). Underweight prevalence in women started to increase during or after the rapid economic growth in Japan. The spread of social media, brought by socioeconomic change, influenced Japanese culture and led to the idealisation of slim women, such as fashion models of European descent (Sugawara et al. Citation2009).
According to previous studies, some women with underweight have had health disorders, which might result from a thin-fat phenotype rather than underweight BMI per se. The disorders could be divided into two types: health disorders of themselves and adverse perinatal outcomes. The former include osteoporosis (Tanaka et al. Citation2013) and type 2 diabetes mellitus (Tatsumi et al. Citation2012) after middle age. Furthermore, Sato et al. (Citation2021) recently reported that women with underweight had impaired glucose tolerance, even in their 20s. The adverse perinatal outcomes include low birthweight, small for gestational age, and preterm birth; maternal pre-pregnancy underweight is associated with these outcomes (Han et al. Citation2011; Enomoto et al. Citation2016; Goldstein et al. Citation2017; Nakanishi et al. Citation2022). Given the facts, the Japanese government has taken measures against the increase in the percentage of young women with underweight (MHLW 2000); however, its prevalence remains high.
We hypothesise that preventing women from becoming underweight during childhood could be an effective approach. However, studies on underweight are limited, and such prevention strategies have not been established, to the best of our knowledge. Understanding when and how young women reach a low BMI must be the first step to devising intervention methods. In this study, we conducted a longitudinal retrospective analysis of BMI standard deviation scores (BMI SDS) in participants from the ages of 6–20 years to clarify the characteristics of BMI SDS trajectory of young Japanese women with underweight.
Subjects and methods
The subjects were 845 Japanese female students in the third year of a private university (20 years old) between 2015 and 2019. The university has campuses in Tokyo and Kanagawa as well as affiliated schools such as elementary schools, junior high schools, and high schools. The participants enrolled in either of the two affiliated junior high schools, continued to either of the two high schools, and then advanced to the university. We were provided with school health check-up data from the first grade of elementary school (6 years old) to the third grade of university (20 years old). In Japan, school health check-ups are usually conducted from April to June, the beginning of the school year. We extracted the measurements of height and weight from the provided data and selected 613 women whose data at both 6 and 20 years of age were available because the data of these two ages were critical for this analysis (described below). A total of 536 women had 15 datasets; the other 77 had 9–14 datasets. This study was approved by the Ethics Review Subcommittee of the Keio University Research Ethics Committee (Hiyoshi campus) [approval number 22-010]. When the subjects entered the affiliated schools, we informed them about the study by the documents distributed to them and their parents. They had the right to opt out of the study. If they wanted, they needed to submit the opt out consents to us. Six women opted out; their data were not collected.
The height and weight of each student (wearing lightweight clothing) were measured by trained nurses or school nurses. In this study, we postulated that each measurement was conducted on the 1st of April of the year because some of the dates of measurement were not recorded. BMI was calculated as weight in kilograms divided by height in metres squared. We transformed BMI, height, and weight into standard deviation scores (SDS) using the LMS method (Cole and Green Citation1992). The assumption of this method is that the data can be transformed into a normal distribution by Box-Cox transformation. The SDS for some parameters, described as X, was calculated as {(X/M)L−1}/(L × S). The values of L (skewness), M (median), and S (coefficient of variation) were available in 2000 Japanese age- and sex-specific references (Kato et al. Citation2011; Isojima et al. Citation2016) as recommended by the Japanese Society for Paediatric Endocrinology. The reference was set at every monthly age for BMI and at every 6 months of age for height and weight, up to 210 months old (17.5 years old). We evaluated the age of our subjects on the 1st of April of the year in years and months and calculated the SDS at the age of 17.5 years or older, substituting the values of L, M, and S for 17.5 years based on the findings that Japanese women’s BMI stayed almost flat from their late teens to twenties (Sugawara et al. Citation2009). In the same way, we calculated the SDS of BMI cut-off of adult underweight, 18.5 kg/m2 (WHO Expert Consultation Citation2004), as −1.09 standard deviations (SD) and that of adult overweight, 25.0 kg/m2 (WHO Expert Consultation Citation2004), as 1.27 SD.
According to the BMI SDS at the age of 20 years, we classified the subjects into two weight status groups: underweight (< −1.09 SD, n = 117) and healthy weight (−1.09 to 1.27 SD, n = 484) groups (). Twelve women with overweight (≥ 1.27 SD) at the age of 20 years were excluded from the analysis because we established the women with healthy weight at the age of 20 years as the control group in this analysis. shows the medians and ranges of BMI, height, and weight of the 601 subjects for analysis.
Figure 1. Classification of the subjects.
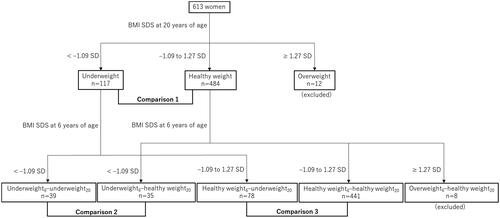
Table 1. Medians and ranges of BMI, height, and weight of the subjects.
Tracking BMI, height, and weight SDS
We evaluated the estimated mean BMI, height, and weight SDS at each age (between 6 and 20 years) in the underweight and healthy weight groups (see Statistical Analysis). Each parameter of the underweight group was compared to that of the healthy weight group at each age (, comparison 1).
Tracking differences in BMI SDS (ΔBMI SDS) from 6 years of age
We analysed the ΔBMI SDS from 6 years to each age to clarify the differences between the two groups. We established the BMI SDS at the age of 6 years as the baseline because it was the youngest age analysed in this study. When we describe BMI SDS at the age of “N” years as “BMI SDSN,” ΔBMI SDS from the age of 6 years to “N” years (ΔBMI SDS6–N) is calculated as “BMI SDSN minus BMI SDS6”. We evaluated the estimated mean ΔBMI SDS6–N (N = 7–20) in the underweight and healthy weight groups, respectively. We compared the ΔBMI SDS between the two groups at each age (, comparison 1).
Subgroup analysis
We analysed when and how subjects with the same weight status at baseline were separated into underweight and healthy weight groups by the age of 20 years. According to the BMI SDS at the age of 6 years in addition to that at 20 years, we classified the subjects into four subgroups (): the underweight6–underweight20 group (< −1.09 SD at both 6 and 20 years, n = 39), the underweight6–healthy weight20 group (< −1.09 SD at 6 years and −1.09 to 1.27 SD at 20 years, n = 35), the healthy weight6–underweight20 group (−1.09 to 1.27 SD at 6 years and < −1.09 SD at 20 years, n = 78), and the healthy weight6–healthy weight20 group (−1.09 to 1.27 SD at both 6 and 20 years, n = 441). Eight women with overweight (≥ 1.27 SD) at the age of 6 years were excluded because we established the women with healthy weight at the age of 6 years as the control group in this subgroup analysis.
We analysed the tracking of BMI SDS at each age (6–20 years) and ΔBMI SDS from 6 years to each age (7–20 years) in each of the four groups. We made two patterns of comparison: between the underweight6–underweight20 and the underweight6–healthy weight20 groups (, comparison 2) and between the healthy weight6–underweight20 and the healthy weight6–healthy weight20 groups (, comparison 3).
Statistical analysis
Analyses for BMI SDS, height SDS, weight SDS, and ΔBMI SDS were performed using a mixed-effects model for repeated measures (MMRM), with estimated mean values at each age analysed using a restricted maximum likelihood-based repeated measures approach in combination with the Newton–Raphson algorithm. The MMRM included group and age as fixed effects and subject as a random effect with a first-order autoregressive model. The Kenward–Roger degree of freedom was used to estimate the fixed effects. No imputation of missing data was performed. p values were adjusted for multiple hypothesis testing using Tukey’s test. All statistical analyses were performed using SAS (version 9.4; SAS Institute Inc.). Statistical significance was set at p < 0.05.
Results
Tracking BMI, height, and weight SDS
shows the tracking of the BMI SDS. The estimated mean BMI SDS was significantly lower at every age in the underweight group than that in the healthy weight group (adjusted p < 0.01).
Figure 2. Tracking BMI, height, and weight SDS. Open circles and dashed lines represent the healthy weight group. The solid circles and solid lines indicate the underweight group. The error bars represent 95% confidential intervals. (A) BMI SDS, (B) Height SDS, and (C) Weight SDS. BMI: body mass index; SDS: standard deviation score.
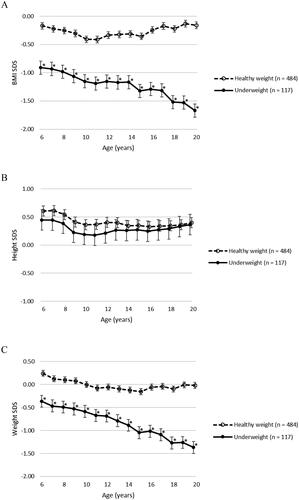
shows the tracking of the height SDS. There were no significant differences in the estimated mean height SDS at any age between the underweight and the healthy weight groups (adjusted p = 0.99–1.00).
shows the tracking of the weight SDS. The estimated mean weight SDS of the underweight group was significantly lower at every age than that in the healthy weight group (adjusted p < 0.01).
Tracking differences in BMI SDS (ΔBMI SDS) from 6 years of age
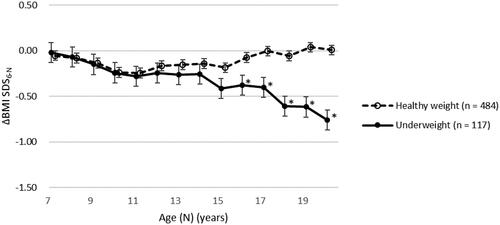
shows the tracking of the ΔBMI SDS from 6 years to each age. The estimated mean ΔBMI SDS6–N was significantly lower after 16 years of age in the underweight group than that in the healthy weight group (adjusted p < 0.01).
Figure 3. Tracking differences in BMI SDS (ΔBMI SDS) from 6 years of age. Open circles and dashed lines represent the healthy weight group. The solid circles and solid lines indicate the underweight group. The error bars represent 95% confidential intervals. BMI: body mass index; SDS: standard deviation score; ΔBMI SDS6–N: differences in body mass index standard deviation score from the age of 6 years to “N” years.
Subgroup analysis
shows the tracking of the BMI SDS in the subgroups. shows the comparison between the underweight6–underweight20 and underweight6–healthy weight20 groups. The estimated mean BMI SDS of the underweight6–underweight20 group was significantly lower after 13 years of age than that of underweight6–healthy weight20 group (adjusted p < 0.01).
Figure 4. Tracking BMI SDS in subgroups. (A) Comparison between the underweight6–underweight20 and underweight6–healthy weight20 groups. Solid squares and solid lines indicate the underweight6–underweight20 group. Solid squares and dashed lines indicate the underweight6–healthy weight20 group. The error bars represent 95% confidential intervals. (B) Comparison between the healthy weight6–underweight20 and healthy weight6–healthy weight20 groups. Open squares and solid lines show the healthy weight6–underweight20 group. Open squares and dashed lines show the healthy weight6–healthy weight20 group. The error bars represent 95% confidential intervals. BMI: body mass index; SDS: standard deviation score.
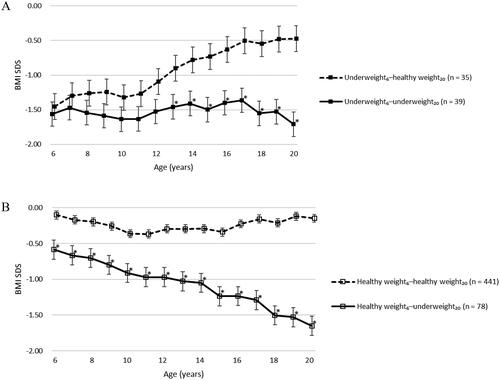
shows the comparison between the healthy weight6–underweight20 and healthy weight6–healthy weight20 groups. The estimated mean BMI SDS of the healthy weight6–underweight20 group was significantly lower at every age than that of the healthy weight6–healthy weight20 group (adjusted p < 0.01). The BMI SDS at 6 years of age was already significantly low in the healthy weight6–underweight20 group, even within the normal range.
shows the tracking of the ΔBMI SDS from 6 years to each age in the subgroups. shows the comparison between the underweight6–underweight20 and underweight6–healthy weight20 groups. The estimated mean ΔBMI SDS6–N of the underweight6–underweight20 group was significantly lower after 14 years of age than that of the underweight6–healthy weight20 group (adjusted p < 0.01).
Figure 5. Tracking differences in BMI SDS (ΔBMI SDS) from 6 years of age in subgroups. (A) Comparison between the underweight6–underweight20 and underweight6–healthy weight20 groups. Solid squares and solid lines indicate the underweight6–underweight20 group. Solid squares and dashed lines indicate the underweight6–healthy weight20 group. The error bars represent 95% confidential intervals. (B) Comparison between the healthy weight6–underweight20 and healthy weight6–healthy weight20 groups. Open squares and solid lines show the healthy weight6–underweight20 group. Open squares and dashed lines show the healthy weight6–healthy weight20 group. The error bars represent 95% confidential intervals. BMI: body mass index; SDS: standard deviation score; ΔBMI SDS6–N: differences in body mass index standard deviation score from the age of 6 years to “N” years.
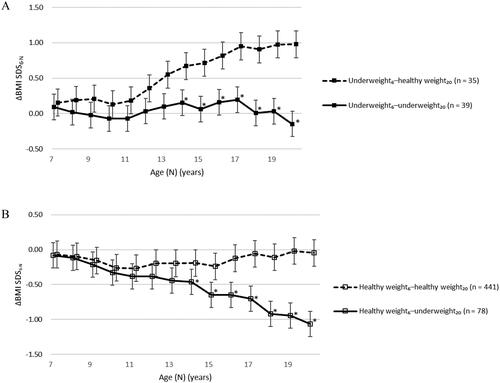
shows the comparison between the healthy weight6–underweight20 and healthy weight6–healthy weight20 groups. The estimated mean ΔBMI SDS6–N of the healthy weight6–underweight20 group was significantly lower after 14 years of age than that of the healthy weight6–healthy weight20 group (adjusted p < 0.01).
Discussion
This longitudinal retrospective analysis suggests that young Japanese women with underweight have at least two characteristics of BMI SDS trajectory. One is being constitutionally underweight; the other is shifting their weight status from baseline towards underweight in their late teens.
We found that the BMI SDS of the underweight group was consistently lower than that of the healthy weight group, from the ages of 6 to 20 years. Out of 117 women of the underweight group, 39 women (33.3%) remained underweight from 6 years of age; they correspond to “constitutional thinness” (Bailly et al. Citation2020). Lack of data before 6 years of age was one of the limitations in our study; however, a retrospective study (Kato et al. Citation2014) showed that 5-year-old Japanese girls with low body weight had lower weight and lower BMI at birth and at the age of 1.5 and 3.5 years. In addition, Takeuchi et al. (Citation2022) reported that young women with underweight were born with lower weights and remained slim from childhood to adulthood, based on only four measurement points. Accordingly, we speculated that some women with underweight may be constitutionally underweight.
Analysis of ΔBMI SDS from 6 years of age showed that the ΔBMI SDS of the underweight group was significantly lower after 16 years of age than that of the healthy weight group. To be specific, at these ages, while the ΔBMI SDS of the healthy weight group was almost zero, that of the underweight group was negative. This means that in women with underweight, the BMI SDS at the age of 16 years or older was lower than that at 6 years of age. Therefore, we speculated that some women with underweight may shift their weight status from baseline towards underweight in their late teens. Out of 117 women of the underweight group, 78 women (66.7%) had healthy weight at 6 years of age and became underweight by 20 years of age. Japanese national surveillance (Japan Society of School Health Citation2020) reported that 68.1% of junior high school girls (12–14 years old) and 81.2% of high school girls (15–17 years old) had a desire for being underweight, and 56.2% of high school girls had taken actions to lose weight. According to a study from the United Kingdom and Ireland (Petkova et al. Citation2019), the incidence of anorexia nervosa reaches a peak at the age of 15 years. If not diagnosed with anorexia nervosa, adolescents may tend to worry about their appearance and try to control their weight status intentionally. We speculated that shifting the weight status in the late teens may be an acquired event by intention. In addition, adolescents with underweight tend to have a decrease in their BMI at 13–17 years of age (Ge et al. Citation2011; De Wilde et al. Citation2018). Their study subjects included Dutch, Turkish, Moroccan, South Asian, and Japanese participants; some ethnic groups showed a similar trend of a decrease in BMI during adolescence as a contributing factor to low BMI as adults. Thus, our findings may be applicable to other ethnic groups and are not limited to the Japanese population.
The subgroup analysis provided further findings. Among 74 women with underweight at 6 years of age, 39 women maintained a BMI SDS at almost the same level as that at 6 years throughout and were underweight in adulthood, while the other 35 women showed a significantly higher BMI SDS after 13 years of age than the 39 women mentioned above and improved to a healthy weight. The pubertal growth spurt of Japanese girls is observed at approximately 11 years of age (Watanabe et al. Citation2015, Citation2017). Whether girls gained appropriate weight during puberty might cause a difference in adult weight status. Although the reason for this difference is unknown, there might be room for intervention at this point. In contrast, among 519 women with healthy weight at 6 years of age, 441 women remained healthy weight until adulthood. However, 78 women showed a significantly lower ΔBMI SDS after 14 years of age than the 441 women mentioned above, resulting in underweight. This was consistent with the results of the analysis of the entire population, as discussed above. Subgroup analysis indicated that in women who went from healthy weight to underweight, their BMI SDS at 6 years old was within the normal range but close to the lower threshold of −1.09 SD. Thus, girls with a BMI at 6 years of age that is closer to the lower threshold of the normal range might be more likely to have a lower BMI than baseline in their teenage years.
We should mention that some women with underweight had both of the two characteristics of BMI SDS trajectory: being constitutionally underweight and shifting their weight status from baseline towards underweight in their late teens. Of the group of underweight women at both 6 and 20 years of age, 22 women whose BMI SDS at 6–13 years of age remained low and stable (provisionally defined as fluctuation within ±0.5 SD from the average of BMI SDS during 6–13 years of age) were regarded as being constitutionally underweight, at least until their early teens. Among them, 5 women showed a lower BMI SDS than that of baseline in their late teens (data not shown). This might suggest that the two characteristics are not always independent.
Taken together, we propose that the characteristics of BMI SDS trajectory of young Japanese women with underweight depend on age. In terms of intervention for school-age girls, we should pay attention to girls with a low BMI at the age of 6 years because they tend to maintain a low BMI and become underweight, moreover, some of them may become underweight of higher severity. Appropriate weight gain during the pubertal period may lead to a healthy weight. We suggest that it may be effective to intervene to positively accept physical changes during puberty. Additionally, we should consider the observed lower BMI than that at 6 years of age in the late teens. In most cases, they appeared to intentionally lose weight, which highlights the need to educate teenagers more intensively about health disorders associated with underweight and the dangers of weight loss.
The Japanese government recognised the increase in underweight in young women as an important issue and aimed to decrease its prevalence as part of the National Health Promotion Movement in 2000 (MHLW 2000). Although it has been more than 20 years since this measure was adopted, the situation has not sufficiently improved. The high prevalence of underweight in young women is associated with the high frequency of low birthweight in infants (9.2% in 2020) (e-Stat 2020). This percentage was higher than that in 35 countries, members of the Organisation for Economic Co-operation and Development (OECD) (5–7%) (Erasun et al. Citation2021). Low-birth-weight infants have been reported to be at risk for type 2 diabetes mellitus, hypertension, and cardiovascular disease in adulthood (Knop et al. Citation2018). Moreover, striking findings have been reported regarding impaired glucose tolerance in young women with underweight; Sato et al. (Citation2021) reported that they had impaired glucose tolerance more frequently than normal weight women. Even though they were in their twenties, both impaired early-phase insulin secretion and adipose tissue insulin resistance were observed in young women with underweight to a level equivalent to that in middle-aged people with overweight. This suggests that prevention of underweight is important before women reach their 20s. Our findings and suggestions regarding interventions for school-aged girls could serve as breakthroughs.
This study had several limitations. First, the study participants were single university students. Although they were from a limited population, the prevalence of underweight among them (19.1%) was not high compared with that of the Japanese general population of women in their 20s (19.8–22.3%) (MHLW 2015, 2016, 2017, 2018, 2019). In addition, our participants were almost comparable with the Japanese general populations of school-aged girls in the heights and weights (MEXT Citation2015, Citation2016, Citation2017, Citation2018, Citation2019). Therefore, our findings can be generalised to young Japanese women, although they cannot be representative of the general population. Second, we may have overestimated all of the BMI SDS values because the dates of the health check-ups for some of the subjects were unclear. In Japan, schools are required to conduct health check-ups from April to June annually. We assumed that each BMI value was obtained on the 1st of April of the year in this study. This assumption causes errors of up to three months in the evaluation of the ages, resulting in an overestimation of BMI SDS by 0.11 SD. However, schools usually conduct health check-ups in April. The errors in age and BMI SDS for the majority of the subjects are within one month and 0.04 SD, respectively. In any case, the overestimation has little effect on the results. Additionally, we did not collect information about dietary intake, exercise, or health disorders associated with being underweight. Doing so in a future study may help identify reasons for the differences between the underweight and healthy weight groups.
In conclusion, we found that young Japanese women with underweight have at least two characteristics of BMI SDS trajectory: being constitutionally underweight and shifting their weight status from baseline towards underweight in their late teens. To decrease the prevalence of young women with underweight, we propose an intervention for girls who already have a low BMI at the age of 6 years and those who have a lower BMI than that at 6 years of age in the late teens.
Author contributions
YN designed the study, collected and analysed the data, and wrote the manuscript. MI advised in the study design. YS advised on statistical analyses. MI, YS, and TH conducted the critical reviews. All the authors have read and approved the manuscript.
Disclosure statement
YN, MI, and TH received Independent Medical Grants from Pfizer Inc.
Data availability statement
The participants of this study did not provide written consent for their data to be shared publicly; therefore, due to the sensitive nature of the research, supporting data is not available.
Additional information
Funding
References
- Bailly M, Germain N, Galusca B, Courteix D, Thivel D, Verney J. 2020. Definition and diagnosis of constitutional thinness: a systematic review. Br J Nutr. 124(6):1–10. doi:10.1017/S0007114520001440.
- Cole TJ, Green PJ. 1992. Smoothing reference centile curves: the LMS method and penalized likelihood. Stat Med. 11(10):1305–1319. doi:10.1002/sim.4780111005.
- De Wilde JA, Middelkoop B, Verkerk PH. 2018. Tracking of thinness and overweight in children of Dutch, Turkish, Moroccan and South Asian descent from 3 through 15 years of age: a historical cohort study. Int J Obes (Lond)). 42(6):1230–1238. doi:10.1038/s41366-018-0135-9.
- Enomoto K, Aoki S, Toma R, Fujiwara K, Sakamaki K, Hirahara F. 2016. Pregnancy outcomes based on pre-pregnancy body mass index in Japanese women. PLoS One. 11(6):e0157081. doi:10.1371/journal.pone.0157081.
- Erasun D, Alonso-Molero J, Gómez-Acebo I, Dierssen-Sotos T, Llorca J, Schneider J. 2021. Low birth weight trends in Organisation for Economic Co-operation and Development countries, 2000-2015: economic, health system and demographic conditionings. BMC Pregnancy Childbirth. 21(1):13. [accessed 2023 Feb 13]:[8 p.]. doi:10.1186/s12884-020-03484-9.
- e-Stat: Vital statistics. 2020. [accessed 2023 Feb 13]. https://www.e-stat.go.jp/dbview?sid=0003411615.
- Ge S, Kubota M, Nagai A, Mamemoto K, Kojima C. 2011. Retrospective individual tracking of body mass index in obese and thin adolescents back to childhood. Asia Pac J Clin Nutr. 20(3):432–437.
- Goldstein RF, Abell SK, Ranasinha S, Misso M, Boyle JA, Black MH, Li N, Hu G, Corrado F, Rode L, et al. 2017. Association of gestational weight gain with maternal and infant outcomes: a systematic review and meta-analysis. JAMA. 317(21):2207–2225. doi:10.1001/jama.2017.3635.
- Han Z, Mulla S, Beyene J, Liao G, McDonald SD. 2011. Maternal underweight and the risk of preterm birth and low birth weight: a systematic review and meta-analyses. Int J Epidemiol. 40(1):65–101. doi:10.1093/ije/dyq195.
- Isojima T, Kato N, Ito Y, Kanzaki S, Murata M. 2016. Growth standard charts for Japanese children with mean and standard deviation (SD) values based on the year 2000 national survey. Clin Pediatr Endocrinol. 25(2):71–76. doi:10.1297/cpe.25.71.
- Japan Society of School Health. 2020. Report of health status of students. Tokyo: SHOBI Printing Co., Ltd. p. 64–67.
- Kato N, Takimoto H, Sudo N. 2011. The cubic functions for spline smoothed L, S and M values for BMI reference data of Japanese children. Clin Pediatr Endocrinol. 20(2):47–49. doi:10.1297/cpe.20.47.
- Kato R, Kubota M, Higashiyama Y, Nagai A. 2014. Longitudinal study of thinness from birth to early childhood: the association with parental thinness. Acta Paediatr. 103(12):1285–1289. doi:10.1111/apa.12810.
- Knop MR, Geng T-T, Gorny AW, Ding R, Li C, Ley SH, Huang T. 2018. Birth weight and risk of type 2 diabetes mellitus, cardiovascular disease, and hypertension in adults: a meta-analysis of 7 646 267 participants from 135 studies. J Am Heart Assoc. 7(23):e008870.
- [MEXT] Ministry of Education. 2015. Culture, Sports, science and technology. Tokyo: School Health Statistics Research. [accessed 2023 Oct 17]. https://warp.ndl.go.jp/info:ndljp/pid/11293659/www.mext.go.jp/component/b_menu/other/__icsFiles/afieldfile/2016/03/28/1365988_03.pdf.
- [MEXT] Ministry of Education. 2016. Culture, sports, science and technology. Tokyo: School Health Statistics Research. [accessed 2023 Oct 17]. https://warp.ndl.go.jp/info:ndljp/pid/11293659/www.mext.go.jp/component/b_menu/other/__icsFiles/afieldfile/2017/03/27/1380548_03.pdf.
- [MEXT] Ministry of Education. 2017. Culture, sports, science and technology. Tokyo: School Health Statistics Research. [accessed 2023 Oct 17]. https://warp.ndl.go.jp/info:ndljp/pid/11293659/www.mext.go.jp/component/b_menu/other/__icsFiles/afieldfile/2018/03/26/1399281_03_1.pdf.
- [MEXT] Ministry of Education. 2018. Culture, sports, science and technology. Tokyo: School Health Statistics Research. [accessed 2023 Oct 17]. https://warp.ndl.go.jp/info:ndljp/pid/11293659/www.mext.go.jp/component/b_menu/other/__icsFiles/afieldfile/2019/03/25/1411703_03.pdf.
- [MEXT] Ministry of Education. 2019. Culture, sports, science and technology. Tokyo: School Health Statistics Research. [accessed 2023 Oct 17]. https://www.mext.go.jp/content/20200319-mxt_chousa01-20200319155353_1-3.pdf.
- [MHLW] Ministry of Health. 2015. Labour and welfare. Tokyo: National Health and Nutrition Survey. [accessed 2023 Feb 22]. https://www.mhlw.go.jp/bunya/kenkou/eiyou/dl/h27-houkoku.pdf.
- [MHLW] Ministry of Health. 2016. Labour and welfare. Tokyo: National Health and Nutrition Survey. [accessed 2023 Feb 22]. https://www.mhlw.go.jp/content/000681180.pdf.
- [MHLW] Ministry of Health. 2017. Labour and welfare. Tokyo: National Health and Nutrition Survey. [accessed 2023 Feb 22]. https://www.mhlw.go.jp/content/000681194.pdf.
- [MHLW] Ministry of Health. 2018. Labour and welfare. Tokyo: National Health and Nutrition Survey. [accessed 2023 Feb 22]. https://www.mhlw.go.jp/content/000681200.pdf.
- [MHLW] Ministry of Health. 2019. Labour and welfare. Tokyo: National Health and Nutrition Survey. [accessed 2023 Feb 22]. https://www.mhlw.go.jp/content/000710991.pdf.
- [MHLW] Ministry of Health. 2000. Labour and welfare. Tokyo: National Health Promotion Movement in the twenty first century. [accessed 2023 Feb 13]. https://www.mhlw.go.jp/www1/topics/kenko21_11/top.html.
- Nakanishi K, Saijo Y, Yoshioka E, Sato Y, Kato Y, Nagaya K, Takahashi S, Ito Y, Kobayashi S, Miyashita C, et al. 2022. Severity of low pre-pregnancy body mass index and perinatal outcomes: the Japan Environment and Children’s Study. BMC Pregnancy Childbirth. 22(1):121. [accessed 2023 Feb 13]:[10 p.]. doi:10.1186/s12884-022-04418-3.
- Petkova H, Simic M, Nicholls D, Ford T, Prina AM, Stuart R, Livingstone N, Kelly G, Macdonald G, Eisler I, et al. 2019. Incidence of anorexia nervosa in young people in the UK and Ireland: a national surveillance study. BMJ Open. 9(10):e027339. doi:10.1136/bmjopen-2018-027339.
- Sato M, Tamura Y, Nakagata T, Someya Y, Kaga H, Yamasaki N, Kiya M, Kadowaki S, Sugimoto D, Satoh H, et al. 2021. Prevalence and features of impaired glucose tolerance in young underweight Japanese women. J Clin Endocrinol Metab. 106(5):e2053–e2062. doi:10.1210/clinem/dgab052.
- Sugawara A, Saito K, Sato M, Kodama S, Sone H. 2009. Thinness in Japanese young women. Epidemiology. 20(3):464–465. doi:10.1097/EDE.0b013e31819ed4ed.
- Takeuchi M, Honda M, Tsuboi A, Minato-Inokawa S, Kurata M, Wu B, Kazumi T, Fukuo K. 2022. Weight trajectory since birth, current body composition, dietary intake, and glucose tolerance in young underweight Japanese women. Womens Health Rep (New Rochelle). 3(1):215–221. doi:10.1089/whr.2021.0127.
- Tanaka S, Kuroda T, Saito M, Shiraki M. 2013. Overweight/obesity and underweight are both risk factors for osteoporotic fractures at different sites in Japanese postmenopausal women. Osteoporos Int. 24(1):69–76. doi:10.1007/s00198-012-2209-1.
- Tatsumi Y, Ohno Y, Morimoto A, Nishigaki Y, Maejima F, Mizuno S, Watanabe S. 2012. U-shaped relationship between body mass index and incidence of diabetes. Diabetol Int. 3(2):92–98. doi:10.1007/s13340-012-0067-x.
- Watanabe N, Kobayashi M, Murata M. 2015. Study on correlation between height growth and menarche using smoothing spline function. J Jpn Assoc Hum Auxol. 21(1):40–49.
- Watanabe N, Kobayashi M, Murata M. 2017. Assessment of the correlation between the onset of menarche and body weight, BMI using smoothing spline function. J Jpn Assoc Hum Auxol. 23(2):75–83.
- [WHO] World Health Organization. 2016. Prevalence of underweight among adults, BMI < 18.5 (age-standardized estimate) (%). [accessed 2023 Feb 13]. https://www.who.int/data/gho/data/indicators/indicator-details/GHO/prevalence-of-underweight-among-adults-bmi-18-(age-standardized-estimate.)-(-).
- WHO Expert Consultation. 2004. Appropriate body-mass index for Asian populations and its implications for policy and intervention strategies. Lancet. 363(9403):157–163. doi:10.1016/S0140-6736(03)15268-3.