
ABSTRACT
In this study, fourteen coffee samples were collected from local markets in Doha, Qatar according to different variables i.e. packed or unpacked, beans or powder, roasted or raw bean samples. The coffee samples were subjected to both microbiological and chromatographical analyses. The microbiological isolation was achieved using direct plating of the coffee on malt agar extract and potato dextrose agar plates. The chromatographical analytical method was conducted using ultra-high-performance liquid chromatography-fluorescence detector (UHPLC-FLD) to quantify the contamination of four classes of aflatoxins (B1, B2, G1, and G2). In the UHPLC-FLD validation process, no interfering peaks were present and the aflatoxins G1, B1, G2, and B2 were well separated. The R2 or coefficient of determination of the calibration plots for all compounds was ≥ 0.995. The limit of quantitation for all compounds was 2 μg/kg. The precision or the relative standard deviation calculated for six replicates of samples spiked at 2 μg/kg were less than 20%, and the limit of detection was 0.17 μg/kg, 0.14 μg/kg, 0.12 μg/kg and 0.09 μg/kg for Aflatoxins G1, Aflatoxins B1, Aflatoxins G2, and Aflatoxins B2, respectively. The average recovery calculated for six replicates of samples spiked at 2 μg/kg was from 74.5–80%. The results for the chromatographical part showed that there was no contamination of aflatoxin in most of the coffee samples collected. Only two samples exhibited low concentrations of aflatoxin G, which are sample A (4.27 × 10⁻¹ μg/kg) and sample O (1.99 × 10⁻² μg/kg). Direct plating showed growth of microorganisms, such as Aspergillus niger, Mucor sp., Bacillus sp., Fusarium sp., and two yeast species. Although some of the isolated species have the potential to produce mycotoxins in coffee, they might be in the spore phase in the coffee samples and did not germinate.
1. Introduction
Aflatoxins are groups of chemically similar and belong to hypertoxic secondary metabolites groups that produced by some moulds of the genus Aspergillus section flavi, primarily A. flavus and A. parasiticus [Citation1,Citation2]. Aflatoxins are low molecular weight, highly toxic compounds, and can cause both acute and chronic effects for humans [Citation3]. Although only four are naturally found in foods, aflatoxins have almost 20 similar compounds that belong to a group, which is called the mycotoxins [Citation4]. The common four aflatoxins are B family (B1 and B2) and G family (G1, and G2) () in which difuran ring and coumarin characterise the aflatoxins. Their molecular weights range from 312 to 346 g/mol. The toxicity of the aflatoxins G family is lower than the B family. However, there is still a need to monitor both aflatoxin families in food and feed to protect the health of humans [Citation5]. Aflatoxins can be soluble in organic solvents with strong polarity, such as chloroform and methanol. They slightly dissolve in water [Citation6]. Aflatoxin B1 is considered the most commonly found in food and it is the most toxic. According to International Agency for Research on Cancer (IARC) (2002) [Citation7], aflatoxin B1 is classified as carcinogenic belonging to Group 1, and other aflatoxins have been classified as possible carcinogens belonging to Group 2B due to their carcinogenic and toxic effects [Citation8].
Figure 1. (a) Chemical structure of Aflatoxins of B family (B1 and B2) and G family (G1 and G2) [Citation5]. The moiety in blue or red Circle shows the difference between the two groups, and (b) Chemical structure of major functional moieties of Aflatoxins [Citation57].
![Figure 1. (a) Chemical structure of Aflatoxins of B family (B1 and B2) and G family (G1 and G2) [Citation5]. The moiety in blue or red Circle shows the difference between the two groups, and (b) Chemical structure of major functional moieties of Aflatoxins [Citation57].](/cms/asset/c9d6631c-cd42-4e2f-b544-54f326a79d9b/geac_a_1819993_f0001_oc.jpg)
It has been shown that some products such as wheat, coffee, peppers, dried fruits, milk, potatoes, and nuts are infected by the mould Aspergillus that have produced aflatoxin compounds [Citation9]. 25% of harvested crops and 60–80% of foods are contaminated or carried detectable levels of mycotoxins. Accumulation of fungal toxins in crops is a result of growing under stress and/or storing under minimal and insufficient working conditions [Citation10]. Other factors such as high temperature, low nitrogen content in the soil, and drought enhance toxin accumulation.
Since coffee is one of the products that may contain aflatoxins, many investigations have been carried out to assess and identify the presence of mycotoxins such as aflatoxins and ochratoxin [Citation11–14]. A study conducted on 30 samples of green coffee showed the presence of one genus Aspergillus in 17 samples, with total aflatoxins content ranged between 0.76 μg/kg and 8.92 μg/kg [Citation11]. The author also found that 12 out of 22 ground roasted coffee samples were contaminated with Aspergillus that produced aflatoxin, and the concentration ranged from 0.79 μg/kg to 5.08 μg/kg. Moreover, Soliman (2002) [Citation11] studied the behaviour and the stability of the toxic aflatoxins during roasting. Three methods, namely microwave, oven roasting (150°C, 15 min), and traditionally roasting (180°C for 10 min) were investigated. The traditional roasting method presented the best results around 55.9% of aflatoxin reduction, furthermore, decaffeination apparently increased the presence of aflatoxin content, and that was justified by the absence of caffeine compound that known to enhance the growth of mould and formation of aflatoxins [Citation15]. Nakajima et al. 1997 [Citation12] studied the effectiveness of heat treatment on the destruction of aflatoxins in some types of coffee beans. The results showed that aflatoxins in contaminated coffee beans were degraded by heat treatment.
The regulatory limits of aflatoxins differ among countries and anticipated use. Aflatoxins contamination is considered a significant problem for producers. The European markets enforce significantly lower limits, specifically 2 μg/kg for aflatoxin B1 and 4 μg/kg for total aflatoxins for products such as nuts and cereals for human consumption [Citation16,Citation17]. In regard to the regulatory limits of Ochratoxin A, 5 μg/kg has been set for roasted coffee beans and ground roasted coffee and 10 μg/kg for soluble coffee [Citation18]. However, the total aflatoxins concentration limit (including B1, B2, G1, G2, and M1 forms) is 4 ng/g as described by the European Food Safety Authority [Citation19].
In regard to the coffee consumption, daily intake, and the risk assessment of mycotoxins, a study conducted in Spain to investigate the effect of coffee processing (i.e. traditional and soluble Turkish process, coffee maker, and electrical machine,) [Citation20]. A deterministic approach was used in various ways of food consumption of adults in Spain [Citation20]. The results showed that only 15-acetyldeoxynivalenol, deoxynivalenol, neosolaniol, fumonisin B1, and ochratoxin A compounds showed noteworthy differences between the methods of coffee preparation.
To protect the consumers from the mycotoxin effects, around 100 countries have set mycotoxin regulations for human food as well as animal feed [Citation21]. According to the U.S. Food and Drug Administration (FDA) (2002) [Citation22], the concentration of aflatoxins in the range of 4–30 μg/kg is allowed in human food, depending on the importing countries. In the United States, the maximum limit of aflatoxin in the human food – except for milk is 20 μg/kg, while in the European Union it is 4 μg/kg [Citation23]. Since that, the European unions are considered to have the strictest standards for mycotoxins that have been established for a variety of commodities, including dried fruits, cereals, nuts, spices, milk, and infant formulae [Citation24].
In Qatar, there are several surveys on the occurrence of mycotoxins in food products available in markets. Al Jabira et al. 2019 [Citation19] estimated the exposure of the population of Qatar to ochratoxins, fumonisins, and aflatoxins. Different food samples of grains, cereals, dried nuts, and spices were collected from the markets of Doha. The study showed that the spices and nut samples were contaminated with aflatoxins (e.g. 371.6 ng/g and 534.15 ng/g, respectively). Therefore, the study recommended a need for a regular assessment and review of the concentration limits of aflatoxins allowed in food products in Qatar. Al-Jaal et al. 2019 [Citation25] studied the mycotoxin contamination of food and feed in the Gulf Cooperation Council countries (GCC). They highlighted the limitation of the studies related to mycotoxins such as aflatoxins globally and in the GCC countries.
Based on the classification that has been done on aflatoxin species by IARC as mentioned above, aflatoxin concentration in consumer products has become one of the most stringent indicators and measures of food toxicity. Several methods and procedures have been developed and adapted for the determination of aflatoxins in various food products [Citation26,Citation27]. Since fungi have been widely documented as a contaminant of coffee beans, there is a need for isolation and detection of types of fungi that have the potential to grow on coffee. Many studies and surveys have been conducted to isolate and determine the species of fungi that are present in coffee beans. Noonim et al. 2008 [Citation14] isolated different mycotoxin producing fungi by a direct plating method. The harvested fungi of the coffee were assessed for the presence of the genus Aspergillus, and the potential of the isolates to have any mycotoxin levels. The results showed that the contamination by Aspergillus and Rhizopus had a percentage of 25.46% and 38.88%, respectively.
According to Wacoo et al. 2014 [Citation28], different approaches have been reported and explored to detect and determine the presence of aflatoxins in food products, such as thin-layer chromatography, high-performance liquid chromatography (HPLC), enzyme-linked immunosorbent assay, liquid chromatography (LC) with mass spectrometry (MS), and others. However, in the GCC countries, chromatographic techniques and immunological methods are usually used for mycotoxin analysis. HPLC in combination with fluorescence detection is a simple analytical method that minimises the use of solvents and less labour-intensive. It is the most widely used and the most common technique for the determination of aflatoxins in food and feed [Citation29]. HPLC has been used in various studies for the detection of mycotoxins in the GCC countries, and it has managed to achieve a low sensitivity [Citation27]. However, due to the advantages of using small particles (smaller than 2.0 µm) of the stationary phase particles in the ultra-high performance liquid chromatography (UHPLC), UHPLC is considered as a good alternative to conventional HPLC [Citation30]. LC-MS is also considered one of the available detection techniques because of the selectivity, universality, and sensitivity. The high cost and matrix effect are the main disadvantages of LC-MS.
There are challenges for the routine monitoring of the multiple toxins. Certain of these challenges, as mentioned by Stroka, & Maragos, 2016 [Citation31], are the need for co-extraction of multiple analytes with a wide range of different polarities and the influence of matrix components on the results, are independent of the analytical technique used. Even though the enormous progress of the mycotoxin analysis, which detects the presence of well-known mycotoxins, the detection of conjugated forms, including masked or bound mycotoxins is still a challenge in this regard [Citation32]. Bound toxins can result from various chemical transformations and they may not be detected by routine analytical techniques. According to Köppen et al. 2010 [Citation33], the chemical transformations of toxins are generally caused by the enzymatic conversion or technological treatment of the contaminated foodstuff, especially by heat or alkaline pH. During extraction and clean-up, the mycotoxin conjugates may be lost because of the difference in polarity compared to the parent toxins [Citation33].
Evaluation of aflatoxins levels in different varieties of coffee available in Doha (Qatar) market is not comprehensively studied. In this regard, the objectives of this study were to (i) culture coffee samples to detect and isolate possible fungal species, and (ii) optimise, validate, and analyse the presence of aflatoxins in coffee (beans and powders) using ultra-high-performance liquid chromatography-fluorescence detector (UHPLC-FLD).
2. Experimental
2.1. Sample collection
Commercial samples of coffee (beans and powders, sample sizes were 0.25 kg and 0.50 kg) were purchased from different local markets in Doha. Fourteen coffee samples were collected according to different variables i.e. packed or unpacked, beans or powder, roasted or raw bean samples. The coffee samples were ground by a blender to obtain fine particles. The samples were classified as follows: unpacked raw bean coffee, unpacked roasted bean coffee, packed raw bean coffee, packed roasted bean coffee, packed powder coffee with cardamom, and packed powder coffee without cardamom. The samples were then stored in an icebox and given serial numbers.
2.2. Isolation of fungi from coffee samples
For powder coffee, one gram of the powder was weighed from each package and transferred in aseptic conditions to cultures. For coffee bean samples, one piece was taken randomly from each bag, weighed separately, and transferred in aseptic conditions to culture plates. Each sample was subjected to both the broth tube and agar plate cultures. The tubes contain potato dextrose agar (PDA) or malt extract agar (MEA). Three replicates were prepared from each tube or plate culture. The tubes and plates were labelled properly and then transferred to an incubator. Cultured PDA and MEA plates were incubated for 3–7 days at 25 °C. The fungal growth was observed regularly and any sign of growth was reported. In case if the growth appeared on the plates, fungi were purified and sub-cultured, incubated for 3–7 days at 25 °C, and then kept in a refrigerator for identification. If the growth was reported in broth culture, one millilitre of the broth culture was plated onto a Petri plate with PDA and then incubated again for 3–7 days at 25°C. All grown fungi were identified based on macroscopic and microscopic examinations and using fungal Keys and Atlases. The bag that has been reported as ‘with positive growth’ was subjected for a second experimental trial and then the number of CFU/1 g coffee was calculated after preparing serial dilutions of sterile distilled water.
2.3. Aflatoxin determination using ultra-high-performance liquid chromatography (UHPLC)
The determination of aflatoxins in food samples requires an efficient extraction step. The extraction step requires the use of organic polar solvents such as acetonitrile, methanol, or acetone mixed with different proportions of water [Citation34]. However, as the detection of aflatoxin is based on the immunoassay technique, this would require extraction using a mixture of methanol with water (80/20 v/v) as methanol has a less negative effect on anti-bodies compared to other organic solvents such as acetone [Citation35].
In the current study, various extraction solvents were studied, including (i) acetonitrile/water (84/16 v/v) and (90/10 v/v), (ii) no modifications, (iii) methanol/water (80/20 v/v) and (70/30 v/v), (iv) 1 mL of extract was combined with 1 mL of acetonitrile before the solid phase purification step, and (iv) chloroform – 2 mL portions of each extract was evaporated and re-dissolved in acetonitrile/water prior to the solid phase purification step. The recovery of this method was in the range of 70–120%. Each sample was extracted with each extraction solvent in replicates of 10 for 1 hour on a reciprocating shaker (180 rpm). The samples were analysed for aflatoxins by UHPLC using the AOAC method 994.08.
2.4. Reagents and chemicals
Aflatoxin mix 4- solution stock solution with B1 20.94 mg/L, G1 20.91 mg/L, B2 20.87 mg/L, and G2 20.93 mg/L concentration was supplied by Sigma-Aldrich. Acetonitrile solvent (for HPLC, gradient grade) was supplied by Sigma-Aldrich. It has a purity of ≥ 99.9% and is used to prepare acetonitrile 10% (Acetonitrile: deionised water (1:9)). Methanol solvent for HPLC, gradient grade) was supplied by Sigma-Aldrich that has a purity ≥ 99.9% and used to prepare the 80% (Methanol/DIW) for extraction of aflatoxins as well as in elution (100%). The n-hexane (for residue analysis) was provided by Merck. Trifluoroacetic acid (for HPLC) that has Purity 99.0% was supplied by Sigma-Aldrich. EASI-EXTRACT® Aflatoxin columns were supplied by R-Biopharm AG and were used for the clean-up process. Phosphate buffer saline tablets were provided by Sigma and were used to prepare the phosphate buffer used in the experiment. Deionised water was obtained by using Milli-Q® Integral Water Purification System. The mobile phase was prepared by volume using the previously mentioned solvents; acetonitrile: deionised water: methanol (18:64:18 v/v/v).
2.5. Standards preparation
Aflatoxin mix 4-solution stock solution to prepare intermediate standards, spiking standards, and calibration standards. A spiking standard of 1 mg/L was prepared by adding 500 µL of the stock solution in acetonitrile solvent 100%. An intermediate standard of 1 µg/L was prepared by adding 1 mL of 1 mg/L previously prepared standard in 9 mL of 100% Acetonitrile. Calibration standards of 1, 2.5, 5, 10, 25, 50, and 100 µg/L were prepared using the intermediate standard. Since the prepared standards are not derivatives, a derivatisation step is necessary to make the fluorescence detector able to detect them. To prepare the 100 µg/L and 50 µg/L, 200 µL and 100 µL, respectively, were added into acetonitrile solvent to have a final volume of 1 mL. To prepare 25 µg/L from 100 µg/L, a volume of 150 µL required into 10% acetonitrile. Derivatisation of the standards was carried out by adding 200 µL of each one into tubes and then evaporating using TurboVap® LV, then adding the derivatised solution (200 µL of n-hexane, 50 µL TFA, and 1.95 mL of 10% acetonitrile).
2.5.1. Extraction of aflatoxins G1, B1, G2, and B2
Aflatoxin compounds were extracted by mixing a known quantity of (5 g) homogenised coffee samples in a centrifuge tube 50 mL with extraction solvent 80% (MeOH/DIW), then by shaking for 2 minutes using VM-100 Mini Vortex Mixer. The solution was then centrifuged at 10000 rpm for 10 minutes. Specific volume (8 mL) of supernatant was transferred using a pipette to a beaker filled with 50 mL of phosphate buffer to adjust the pH of the sample to be 7.40.
2.5.2. Clean-up
Clean-up of toxins from interfering compounds present in the matrix (coffee) was done by using EASI-EXTRACT® Aflatoxin Immunoaffinity columns that contain antibodies specific to hold the aflatoxin compounds in the column. The column was activated after adjusting on a vacuum manifold by adding 15 mL phosphate buffer without allowing the column to dry. The solution prepared in the beaker was poured into the column. Aflatoxin compounds remain on the surface of the column without interfering compounds. After the whole sample passed the column, deionised water (20 mL) was added to washing the column and the column was then dried.
2.5.3. Elution
The column that contains the aflatoxins inside was eluted using 1.5 mL of 100% methanol solvent HPLC grade into a glass tube. The tube was transferred to TurboVap® LV to evaporate the solvent for 30 minutes using N2 gas with 99.9995% purity at 60°C.
2.5.4. Derivatisation
After evaporation, the tube was checked to be fully dried, 200 µL of hexane (HPLC grade, Purity = 95.0%), and 50 µL of trifluoroacetic acid (Purity 99.0%), UV-Spectroscopic grade (TFA) were added to reconstitute the residue. Then, the mixture was shaken for 30 seconds using VXR basic Vibrax® – IKA and let the tube for 5 minutes. After that, 1950 µL of 10% acetonitrile was added to the mixture and being shaken by a vortex.
Using a syringe and Filters PVDF (0.22 µm), an enough amount of the residues down the hexane layer was transferred to the UHPLC vial. Then, the vial was injected into the UHPLC instrument Agilent 1290 infinity series. The aflatoxin compounds were detected with fluorescence detector based on their fluorescence properties and the results were quantified by the UHPLC instrument Agilent 1290 infinity series with column WATERS NOVA PACK C18, 4 µm, 3.9 × 150 mm or equivalents, and fluorescence detector. This is a validated in-house method and accredited to be fit with the matrix and target analytes in this study, in which linearity, precision, limit of detection (LOD), limit of quantification (LOQ), and recovery were considered.
3. Results and discussion
Coffee is considered as the second most routinely consumed drink after water. It has been grown in more than 70 countries [Citation36,Citation37]. The minerals and biologically active substances in coffee are health-promoting properties that are linked to its antioxidant content. It was shown an increase of 169 million bags (bag equals 60 kg) of the world’s coffee production in 2018; representing 38% of Robusta and 61% of Arabica. 80% of the world’s coffee consumption corresponds to roasted coffee [Citation38]. Qatar, along with the Gulf Cooperation Council (GCC), is set to reach 50% of the world’s total coffee consumption, and it is considered one of the world’s growing coffee markets. The number of coffee cafes in Doha has greatly increased in recent years. It has been suggested that once the coffee beans are roasted, various physical and chemical changes take place such as the internal structure of beans changes, water content, density, and colour [Citation38]. This would affect the aflatoxins content in coffee. In this study, the samples, therefore, were classified as follows: unpacked raw bean coffee, unpacked roasted bean coffee, packed raw bean coffee, packed roasted bean coffee, packed powder coffee with cardamom, and packed powder coffee without cardamom.
3.1. UHPLC validation process
HPLC has been used in various studies for the detection of aflatoxins in food and managed to achieve a low sensitivity [Citation27]. However, due to the advantages of using small particles (smaller than 2.0 µm) of the stationary phase particles, higher peak capacity, resolution, and sensitivity in the UHPLC, UHPLC is considered as a good alternative to conventional HPLC [Citation30]. Validation of the UHPLC method was carried out based on the limit of detection, precision, linearity, selectivity, accuracy, and limit of quantification, and recovery. In the UHPLC validation process, no interfering peaks were observed and the aflatoxins G1, B1, G2, and B2 were separated in 20 min total run time. The R2 or coefficient of determination of the calibration plots for all compounds was ≥ 0.995. The limit of quantitation (LOQ) for all compounds was 2 μg/kg. The precision or the relative standard deviation (RSD%) calculated for six replicates of samples spiked at LOQ (2 μg/kg) was less than 20%, and the limit of detection (LOD) was 0.17 μg/kg, 0.14 μg/kg, 0.12 μg/kg and 0.09 μg/kg for Aflatoxins G1, Aflatoxins B1, Aflatoxins G2, and Aflatoxins B2, respectively. The average recovery calculated for six replicates of samples spiked at LOQ (2 μg/kg) was from 74.5–80% for aflatoxins as shown in .
Table 1. Analytical and performance characteristics of the aflatoxins determination method.
Based on the previous studies, aflatoxins determination in coffee and foodstuffs has focused on the simultaneous determination of various toxins with the aim of reducing the time and cost of analysis. However, the differences in the physicochemical properties of aflatoxins make it quite difficult to find an optimal extraction condition. Here, in this study, this problem has been overcome by using UHPLC – FLD. The method has been validated in a wide range of concentrations and satisfactory recovery results for all analytes were obtained. The RSD values were between 2.04% and 3.54%, which demonstrates the precision of the analytical procedure.
Afsah-Hejri et al. 2011 [Citation39] studied the optimisation of HPLC conditions for quantitative analysis of aflatoxins (B1, B2, G1, and G2) in contaminated peanut. Results showed that the detection value of target aflatoxins was affected by the HPLC variables such as temperature, flow rate, and the mobile phase. The study also showed that the mobile phase composition of (acetonitrile/H2O/MeOH: 8/54/38) at 24°C and a flow rate of 0.4 mL/min were the best quantification results for aflatoxins determination compared to two other conditions. The mobile phase compositions were (acetonitrile/H2O/MeOH: 23/54/23) at 28–32°C and a flow rate of 1 mL/min, and (acetonitrile/H2O/MeOH: 17/54/29) at 30°C and a flow rate of 1 mL/min.
Sakin et al., 2018 [Citation40] validated and determined the concentration of aflatoxins and ochratoxin A in Sürk cheese samples by the HPLC-FD system. It was shown that no interfering peaks were detected and the separation of aflatoxins and ochratoxin A were in less than 11 min total run time. The LODs for aflatoxins were in the range of 0.035 μg/kg – 0.061 μg/kg, whereas the LOQs ranged from 0.10 to 0.17 μg/kg. The average recoveries were between 74.3 and 102.3%.
Bessaire et al., 2019 [Citation18] developed and validated LC-MS/MS method to study the occurrence of mycotoxins in coffee. The results revealed that the samples were contaminated with a maximum level at 1.2 μg/kg of Aflatoxin B1. Ochratoxin A, Fumonisin B2, Sterigmatocystin, Beauvericin, and Enniatin A were found with maximum levels at 12.2 μg/kg, 76.3 μg/kg, 19.8 μg/kg, 4.4 μg/kg and 1.7 μg/kg, respectively.
Aflatoxin (AFG1) was only detected in two samples with low concentrations; namely samples A and O with 4.27 × 10⁻¹ μg/kg and 1.99 × 10⁻² μg/kg; respectively, as shown in . The reason behind that can be explained as that the aflatoxins in coffee products that were sampled might be reduced during the soluble coffee manufacturing as explained by Soliman (2002) [Citation11]. Moreover, roasting is an effective way for the destruction of aflatoxins and results showed that roasting methods caused reductions in four types of aflatoxins, however, aflatoxin B1 showed a persistence towards the heat, followed by aflatoxin G2, then aflatoxin B2, while aflatoxin G2 was sensitive and unstable to the heat [Citation11]. Among the three methods, the traditional roasting showed the highest destruction efficiency (55.9%) followed by oven roasting (47.8%) and then microwave roasting (42.2%) [Citation11]. In another study, electrical roasting at 200°C achieved 93–99% destruction of aflatoxins [Citation41]. In the present study, 11 out of 14 tested samples were already roasted and so a high concentration of aflatoxins was not detected in most of the tested samples. Similar to our findings, 17 samples out of 30 were shown to be infected with A. flavus but their concentrations of aflatoxins were low, which had a range of 0.76–8.92 μg/kg using HPLC [Citation11].
Figure 2. UHPLC-FLD chromatogram of sample A (4.27 x 10⁻¹μg/kg aflatoxin G1 (AFLA.G1)).
It was shown the roasting process may induce chemical reactions and; therefore, examining the quality of coffee beans and powder through biochemical composition and properties are of importance. For instance, high acid levels, proteins, and amino acids in coffee beans are correlated with high quality of coffee [Citation41]. The major compounds in coffee Arabica seeds are 48–60% dry matter polysaccharides, 13–17% dry matter lipids, 11–15% dry matter proteins, 7–11% dry matter sucrose, and 5–8% dry matter chlorogenic acids [Citation42]. Other investigators such as Hasan (1999) [Citation43] and Pluyer et al. 1987 [Citation44] confirmed that the roasting process is considered as an effective in the destruction of aflatoxins. The reason might also be related to the sugar content. During the roasting process, the sucrose content of the coffee was reduced from 7% to 0% as reported by Hasan (1999) [Citation43]. Many investigators have demonstrated that aflatoxin production occurs only when there are high levels of carbohydrates in the media [Citation11]. As a result, the loss of carbohydrates during roasting may account for the decrease in aflatoxin production. An investigation was conducted to study the concentration of aflatoxins in nuts and dried fruits in Morocco [Citation45] using immunoaffinity clean-up with LC-FLD. The results showed that the highest aflatoxins concentration (aflatoxins B1) was found in one walnut sample that had a concentration of 2500 μg/kg, and one pistachio sample, which had a concentration of 1430 μg/kg. Moreover, fruits of dried figs were analysed for the detection of aflatoxins. Around 5% of the fig samples, the aflatoxins were detected. Aflatoxin B1 was contaminated in one sample and had concentrations of 0.28 μg/kg. Other samples were detected with aflatoxin G1 that ranged from 0.28 μg/kg – 32.9 μg/kg. According to the limit set by the European legislation, around 15% of the dried figs examined during the study had exceeded the maximum limit (4 μg/kg). It was also revealed species that are responsible for the production of aflatoxins become more common when they have the chance to grow in their favourable conditions, which is mainly high sugar content [Citation45].
Sample A, which was contaminated with Aflatoxin G1, had a concentration of 4.27 × 10⁻¹ μg/kg, and it was packed roasted coffee beans. A survey that was conducted by Nakajima et al. 1997 [Citation12] to determine the concentration of selected mycotoxins in commercial coffee bean using HPLC linked with immunoaffinity chromatography. One of the detected mycotoxins was aflatoxin B1. It was mentioned that HPLC uses fluorometric analysis for mycotoxins in coffee beans might give interfering fluorescent peaks that may prevent the detection at low concentrations. Since that, the immunoaffinity column was introduced in the clean-up stage and their results revealed no interfering peaks, and the detection even was at a low concentration of aflatoxin B1 [Citation46–48]. The study of Nakajima et al. 1997 [Citation12] showed that 14 out of 47 samples of African and Asian imported beans were contaminated by aflatoxin B1 in a concentration that had a range of 2–32.9 ng/kg; however, all samples from the central and South American countries were not contaminated with mycotoxins [Citation12].
In the present study, no aflatoxins were detected in sample C (packed powder with cardamom). This could be explained as it showed that the addition of cardamom could cause an inhibition in fungal growth. But in a study conducted by Bokhari (2007) [Citation47] showed that the occurrence of aflatoxins in Arabic coffee beans, detection of aflatoxin B1 was at a minimum of 2.10 μg/kg, and the maximum was 219 μg/kg. Out of forty-eight samples collected from markets in Jeddah, 15 samples were positive results for aflatoxins. The results showed and represented a health risk, especially those of Arabic coffee beans that were prepared with light roasting that does not have a good efficiency for the destruction of mycotoxins. Three out of 47 samples in that study were imported from Brazil with Arabica type of beans. No detection for aflatoxin B1 in the three samples, although fungi species were isolated (with Aspergillus flavus as a common fungus) and all are known to be responsible for aflatoxin production [Citation47].
3.2. Isolation of fungi from coffee samples
It has been shown that coffee beans could be exposed to a range of microbial contaminants during cultivation, harvesting, processing, transportation, and storage. In addition, drying in the long term under the sun contributes to microbiological challenges [Citation38]. shows the list of microorganisms isolated from the studied samples. A species of yeast (species 1) grew in beans as well as powder samples. Yeast sp. 2 () was found in the packed roasted, unpacked raw beans, packed powder with cardamom, and packed powder without cardamom. Another isolate was Mucor sp. (, ) found in unpacked raw beans. The most common and repeated mould was A. niger ( and ). All detected fungal species in the present study coincide with other published studies. A study was conducted by Abera et al. 2015 [Citation49] to assess the associations of mycoflora in the seed of coffee. The study showed isolations of fungal species, which belonged to the genera Fusarium, Aspergillus, Penicillium, and Mucor by agar plating technique [Citation49]. It was shown that during different phases of development from harvesting to the storage phase, the contamination of the coffee cherries and beans or the colonisation by these microbes occurred. It was also concluded that a considerably lower pathogen association in the case of coffee beans processed by parchment and surface disinfection. The best explanations could be due to the parchment of beans that protect from the invasion of fungi. Moreover, the parchment is dead tissue and relatively composed of dry sclerenchymatous tissues that prevent the diffusion of gases such as CO2, O2, and H2O, which help in the germination of fungi.
Figure 3. Pictures of microorganisms isolated from the studied samples of coffee. (a) colonies of Aspergillus niger, (b) Mucor sp. Fusarium and yeast sp. 2., (c) Fusarium and yeast sp. 1 colonies, (d) Colonies of Aspergillus niger group and Fusarium sp.
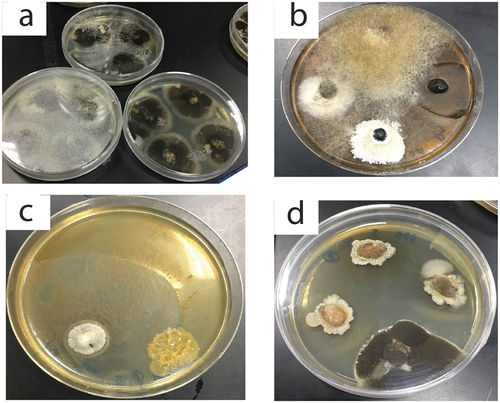
Table 2. List of microorganisms (Bacteria and Fungi) isolated from different coffee samples collected from the local Doha market.
In the present study, Aspergillus niger grew and isolated from many samples (; ). Eight samples out of fourteen were contaminated by Aspergillus niger. Most of the eight samples were whole beans. Aspergillus niger has been reported as a mycotoxin producer on dried coffee bean samples (Coffea arabica) in Thailand [Citation50]. In the latter study, a total of 50 samples was plated onto dichloran 18% glycerol agar plates and malt extract agar with and without surface sterilisation. It was observed that a diversity of black Aspergilli in coffee beans including A. niger, A. carbonarius, A. tubingensis, A. foetidus, A. aculeatinus and A. sclerotiicarbonarius were present. Moreover, the study showed a higher incidence of A. niger in Arabica coffee and related taxa, while in Robusta coffee, A. niger was one of the dominant species [Citation50]. In another study, Nakajima et al. 1997 [Citation12] found that after examination of the mycoflora of green coffee beans, members of the A. niger group were prominent. The authors reported that a group of mycotoxin, which is ochratoxin A was produced by A. foetidus that is one of the A. niger groups.
It is observed that all raw or green coffee beans – wherever the origin of the beans – showed colonies of A. niger. Batista et al. 2003 [Citation51] studied the presence of Aspergillus and other species before and after surface sterilisation on processed green coffee beans in Brazil (Coffea Arabica) as well as the mycotoxigenic potentials of these species. The authors reported that the contamination by Aspergillus species was 96% of 45 samples from 11 localities [Citation51].
Although the presence of fungi in the coffee beans affects the quality in terms of flavour and aroma and could be harmful to consumers at certain concentrations, finding fungi in coffee beans does not always mean they produce mycotoxins. Moreover, the results obtained showed that there are spores of fungi in coffee and these spores do not produce mycotoxins until they germinate and have a favourable condition for mycotoxin production. The results of the mould infection of this study agree with the findings of Abdel-Hafez & El-Maghraby (1992) [Citation52] and Shivaramaiah & Raghunathan (1989) [Citation53] who reported that there are dominated flora species such as A. ochraceus, A. flavus, and A. niger as well as Penicillium spp. of coffee beans. It is common to say that potentially mycotoxigenic fungi are associated with stored coffee beans, but there is little indication that coffee, in general, supports the production of mycotoxins. According to Kabak (2016) [Citation54], it was revealed that on the outer surface or inside the cavity of the fruit, toxigenic fungi could grow and produce aflatoxins even if no damage happens on the skin. In fact, there are critical periods of aflatoxins formation, and one of them is when the fruit shrivels and falls on the ground and soil. It was reported by Accinelli et al. 2008 [Citation55] that the concentration of aflatoxins in the soil is in the range of 1.9 nmol/kg – 881.4 nmol/kg soil. The aflatoxins can be taken up by the plants since they can be transported from the root to the fruits [Citation56]. Clay minerals that are found in the soil can isolate aflatoxins, which can be easily adsorbed onto a type of clay mineral called smectite [Citation57]. It was suggested by Deng & Szczerba (2011) [Citation58] that the electrostatic attraction in the aflatoxin B1 played a vital role in the bonding to smectite. The two functional groups in aflatoxin may be chemically bonded to the surface of smectite. As shown in ), aflatoxin compounds have a five-carbon ring with two adjacent carbonyls and two furan rings relating to toxicity, a highly substituted coumarin relating to carcinogenicity, in addition to organic lactone and a phenyl group [Citation59]. The carbonyl groups, which are rich in excess electrons, cause of the interaction with electron-deficient or positively charged species as discussed in Kang et al. 2016 [Citation59] study and this may explain the contamination of coffee beans as a result of the contaminated soil.
4. Conclusion
This investigation was done to determine the presence of aflatoxins in coffee samples using UHPLC and by culturing of coffee samples to isolate possible fungal species. The method optimisation and validation revealed that the UHPLC-FLD method provided acceptable relative standard deviation and recovery for aflatoxins determination. The RSD (%) was 3.54, 3.15, 2.59, and 2.04 for the aflatoxins G1, B1, G2, and B2, respectively. The LOD (μg/kg) was 0.17, 0.14, 0.12, and 0.09 for the aflatoxins G1, B1, G2, and B2, respectively. The average recovery of the aflatoxins G1, B1, G2, and B2 was 77.5, 74.5, 80.0, and 75.5, respectively. The analytical method that was based on UHPLC-FLD showed that most of the coffee samples are free from aflatoxins except for two samples with a very low concentration.
The dominant fungal genera associated with the coffee samples were Aspergillus niger, Mucor sp. Bacillus sp. and yeast species. Eight samples out of fourteen were contaminated by Aspergillus niger. Most of the eight samples were whole beans. 11 out of 14 tested samples were already roasted and so a high concentration of aflatoxins was not detected in most of the tested samples. It was concluded that the presence of these moulds does not mean the presence of mycotoxins in the samples as these moulds might not have the potential to produce mycotoxins. A very weak correlation was observed between the growth of the microorganisms (the level of coffee contaminated by total fungi) and the concentration of aflatoxins present, which do not essentially indicate an aflatoxin-contaminated sample. This study showed that the implemented method is an appropriate method for aflatoxins determination in coffee (beans and powder), and can be recommended for routine analysis envisioned for inspections or monitoring programs of aflatoxins in coffee and other food.
Acknowledgments
Open Access funding provided by the Qatar National Library.
This paper was made possible by Qatar University grant # (QUST-CAS-SPR-15/16-13). The statements made herein are solely the responsibility of the author(s). We extended our thanks to the lab technicians; Mr. Muhammad k Abdul Matheen and Mr. Kunhammad Keerankot for their technical supports. We would like to thank the Central Food Laboratories for his assistance in analyzing the samples.
Disclosure statement
On behalf of all authors, the corresponding author states that there is no conflict of interest.
Additional information
Funding
References
- C. Chuaysrinule, T. Maneeboon, C. Roopkham and W. Mahakarnchanakul, J. Agric. Food Res. 2, 100054 (2020). doi:10.1016/j.jafr.2020.100054.
- O. Atanda, M. Ogunrinu and F. Olorunfemi, World Mycotoxin J. 4, 147–115 (2011). doi:10.3920/WMJ2010.1241.
- M.E. Zain, J. Saudi Chem. Soci. 15, 129–144 (2011). doi:10.1016/j.jscs.2010.06.006.
- A.M. Macri, A. Szakacs and S. Matei, Bull. UASVM Agric. 71 (1), 147–151 (2014).
- P. Li, Q. Zhou, T. Wang, H. Zhou, W. Zhang, X. Ding, Z. Zhang, P.-K. Chang and Q. Zhang, Toxins 8, 5 (2016). doi:10.3390/toxins8010005.
- Z. Penga, L. Chena, Y. Zhua, Y. Huanga, X. Hua, Q. Wu, A.K. Nüssler, L. Liua and W. Yang, Trends Food Sci. Tech. 80, 155–166 (2018). doi:10.1016/j.tifs.2018.08.009.
- IARC, Aflatoxins. in Traditional Herbal Medicines, Some Mycotoxins, Naphthalene and Styrene. IARC Monographs on the Evaluation of Carcinogenic Risks to Humans (Vol. 82, International Agency for Research on Cancer, Lyon, France, 2002). pp. 171–366.
- G. Gonzalez, M.J. Hinojo, R. Mateo, A. Medina and M. Jiménez, Int. J. Food Microbiol 105, 1–9 (2005). doi:10.1016/j.ijfoodmicro.2005.05.001.
- F. Fung and R.F. Clark, J. Toxicol. Clin. Toxicol. 42, 217–234 (2005). doi:10.1081/CLT-120030947.
- M. Aoun, W. Stafstrom, P. Priest, J. Fuchs, G.L. Windham, P.W. Williams and R.J. Nelson, Food Control 118, 107363 (2020). doi:10.1016/j.foodcont.2020.107363.
- K.M. Soliman, J. Agric. Food. Chem. 50, 7477–7481 (2002). doi:10.1021/jf011338v.
- M. Nakajima, H. Tsubouchi, M. Miyabe and Y. Ueno, Food Agr. Immunol. 9, 77–83 (1997). doi:10.1080/09540109709354938.
- A. Filazi and U.T. Sireli, Occurrence of Aflatoxins in Food. INTECH Open Access Publisher, 2013.
- P. Noonim, W. Mahakarnchanakul, K.F. Nielsen, J.C. Frisvad and R.A. Samson, Int. J. Food Microbiol. 128, 197–202 (2008). doi:10.1016/j.ijfoodmicro.2008.08.005.
- V.R. Preedy, editors, Coffee in Health and Disease Prevention (Elsevier Academic Press, San Diego, CA, 2014). doi:10.1016/C2012-0-06959-1.
- P.V. Fernández, A. Patriarca, O. Locani and G. Vaamonde, Food Addit. Contam. 18, 1017–1020 (2001). doi:10.1080/02652030110057125.
- G.S. Shephard, J. Toxicol. 22 (2–3), 267–286 (2003).
- T. Bessaire, I. Perrin, A. Tarres, A. Bebius, F. Reding and V. Theurillat, Food Control 96, 59–67 (2019). doi:10.1016/j.foodcont.2018.08.033.
- M. Al Jabira, A. Barcarub, A. Latiffd, J. Morana, R. Gouda and H. Peter, Toxicol. Rep. 6, 975–982 (2019). doi:10.1016/j.toxrep.2019.09.009.
- A. García-Moraleja, G. Font, J. Mañes and E. Ferrer, Food Chem. Toxicol. 86, 25–233 (2015). doi:10.1016/j.fct.2015.10.014.
- A. Fellinger, Worldwide Mycotoxin Regulations and Analytical Challenges. World Grain Summit: Foods and Beverages, Sept. 17, San Francisco, California, USA, 2006.
- U.S. Food and Drug Administration (FDA), Investigative Operations Manual (Food and Drug Administration, Washington DC, USA, 2002).
- F. Wu, Mycotoxin Reduction in Bt Corn: Potential Economic, Health, and Regulatory Impacts. ISB News Report, 2006.
- S. Ashiq, Compr. Rev. Food Sci. Food Saf. 14 (2), 159–175 (2015).
- B. Al-Jaal, S. Salama, N. Al-Qasmi and M. Jaganjc, Toxicon 171, 43–50 (2019). doi:10.1016/j.toxicon.2019.10.003.
- M.Z. Zheng, J.L. Richard and J. Binder, Mycopathologia 161, 261–273 (2006). doi:10.1007/s11046-006-0215-6.
- D.K. Mahato, K.E. Lee, M. Kamle, S. Devi, K.N. Dewangan, P. Kumar and S.G. Kang, Front. Microbiol. 10, 2266 (2019).
- A.P. Wacoo, D. Wendiro, P.C. Vuzi and J.F. Hawumba, J. Appl. Chem. Biotech. 706291, 15 (2014).
- S.W. Khayoon, B. Saad, B. Salleh, H.A.M. Normaliza and A.A. Latiff, Food Chem. 147, 287–294 (2014). doi:10.1016/j.foodchem.2013.09.049.
- J.F. Huertas-Pérez, N. Arroyo-Manzanares, D. Hitzler, F.G. Castro-Guerrero, L. Gámiz-Gracia and A.M. García-Campaña, Food Chem. 24515, 189–195 (2018). doi:10.1016/j.foodchem.2017.10.041.
- J. Stroka and C. Maragos, Challenges in the Analysis of Multiple Mycotoxins. World, 2016.
- H. Yazdanpanah, Iran. J. Pharm. Res. 10 (4), 653–654 (2011).
- R. Köppen, M. Koch, D. Siegel, S. Merkel, R. Maul and I. Nehls, Appl. Microbiol. Biotechnol. 86, 1595–1612 (2010). doi:10.1007/s00253-010-2535-1.
- T. Bertuzzi, S. Rastelli, A. Mulazzi and A. Pietri, Food Anal. Methods 5, 512–519 (2012). doi:10.1007/s12161-011-9274-5.
- J. Stroka, M. Petz, U. Joerissen and E. Anklam, Food Addit. Contam. 16, 331–338 (1999). doi:10.1080/026520399283902.
- G. Hu, X. Peng, Y. Gao, Y. Huang, X. Li, H. Su and M. Qiu, Food Chem. 331, 127329 (2020). doi:10.1016/j.foodchem.2020.127329.
- K. Janda, K. Jakubczyk, I. Baranowska-Bosiacka, P. Kapczuk, J. Kochman, E. Rebacz-Maron and I. Gutowska, Foods 9, 121 (2020). doi:10.3390/foods9020121.
- M. Moeenfarda and A. Alves, Food Res. Int. 134, 109207 (2020). doi:10.1016/j.foodres.2020.109207.
- L. Afsah-Hejri, S. Jinap, S. Arzandeh and H. Mirhosseini, Food Control 22, 381–388 (2011). doi:10.1016/j.foodcont.2010.09.007.
- F. Sakin, I.O. Tekeli, M. Yipel and C. Kürekci, Food Control 90, 317–323 (2018). doi:10.1016/j.foodcont.2018.03.012.
- C. Micco, M. Miraglia, C. Brera, C. Desiderio and V. Masci, Mycotoxin Res. 8, 93–97 (1992). doi:10.1007/BF03192222.
- M. Workua, B. de Meulenaer, L. Duchateau and P. Boeckx, Food Res. Int. 105, 278–285 (2018). doi:10.1016/j.foodres.2017.11.016.
- H.A.H. Hasan, Cryptogamie Mycol. 20, 17–21 (1999). doi:10.1016/S0181-1584(99)80004-9.
- H.R. Pluyer, E.M. Ahmed and C.I. Wei, J. Food Prot. 50, 504–508 (1987). doi:10.4315/0362-028X-50.6.504.
- C. Juan, A. Zinedine, J.C. Molto, L. Idrissi and J. Manes, Food Control 19, 849–853 (2008). doi:10.1016/j.foodcont.2007.08.010.
- F. Bokhari and M.M. Aly, Afr. J. Food Sci. 3 (3), 68–76 (2009).
- F.M. Bokhari, Adv. Biol. Res. 1, 56–66 (2007).
- A.H.W. Abdulkadar, A.A. Al-Ali, A.M. Al-Kildi and J.H. Al-Jedah, Food Control 15, 543–548 (2004). doi:10.1016/j.foodcont.2003.08.008.
- A. Abera, F. Lemessa, F. Adunga. and W. Garedew, Plant Pathol. J. 14, 136–141 (2015). doi:10.3923/ppj.2015.136.141.
- P. Noonim, W. Mahakarnchanakul, K.F. Nielsen, J.C. Frisvad and R.A. Samson, Food Addit. Contam. 26, 94–100 (2009). doi:10.1080/02652030802366090.
- L.R. Batista, S.M. Chalfoun, G. Prado, R.F. Schwan and A.E. Wheals, Int. J. Food Microbiol. 85, 293–300 (2003). doi:10.1016/S0168-1605(02)00539-1.
- A.I.I. Abdel-Hafez and O.M.O. El-Maghraby, Cryptogamie. Mycologie 13 (1), 31–45 (1992).
- H.M. Shivaramaiah and A. Raghunathan, J. Coffee Res. (India) 19 (1), 39–45 (1989).
- B. Kabak, Food Chem. 211, 8–16 (2016). doi:10.1016/j.foodchem.2016.04.141.
- C. Accinelli, H.K. Abbas, R.M. Zablotowicz and J.R. Wilkinson, Can. J. Microbiol. 54, 371–379 (2008). doi:10.1139/W08-018.
- A. Logrieco, B. Doko, A. Moretti, S. Frisullo and A. Visconti, J. Agric. Food. Chem. 46, 5201–5204 (1998). doi:10.1021/jf9804903.
- A. Carraro, A. De Giacomo, M.L. Giannossi, L. Medici, M. Muscarella, L. Palazzo and F. Tateo, Appl. Clay Sci. 88, 92–99 (2014). doi:10.1016/j.clay.2013.11.028.
- Y. Deng and M. Szczerba, Appl. Clay Sci 54, 26–33 (2011). doi:10.1016/j.clay.2011.07.007.
- F. Kang, Y. Ge, X. Hu, C. Goikavi, M.G. Waigi, Y. Gao and W. Ling, J. Hazard. Mater. 320, 80 (2016). doi:10.1016/j.jhazmat.2016.08.006.