
 ?Mathematical formulae have been encoded as MathML and are displayed in this HTML version using MathJax in order to improve their display. Uncheck the box to turn MathJax off. This feature requires Javascript. Click on a formula to zoom.
ABSTRACT
Since 2008, there have been a growing number of social policies placed on UK higher education institutions (HEIs) to engage in reducing carbon emissions and meet self-imposed carbon reduction targets while producing graduates, publishing research papers and attracting research income. HEI managers thus face the challenging task of having to determine the optimal level between environmental performance and economic performance – from activities that generate income, to which we refer as overall efficiency. To that end, the current study measures the overall efficiency levels of UK HEIs from 2012/13 to 2018/19 using a slacks-based measure model that incorporates bad outputs. The study aims to determine the extent to which the optimal balance between environmental performance and economic performance has been achieved as evidenced by the efficiency of HEIs over the course of the sample period. The study also identifies factors associated with efficiency and provides policy recommendations. Over the study period, overall efficiency (incorporating the bad output of carbon emissions) initially fell and then rose in the last 2 years suggesting some optimism that carbon emissions management has improved since then. The second-stage analysis, which identifies factors associated with efficiency, suggests that the ratio of students to staff and HEIs in the Russell group is positively associated with the efficiency of inefficient HEIs. When both efficient and inefficient universities are considered, having an environmental management system is positively associated with efficiency, while the opposite is the case for having science, engineering and medicine disciplines and having carbon reduction targets.
1. Introduction
The basic functions of modern universities are teaching and research (Fischer-Appelt Citation1984; Potter et al. Citation1970; Stout Citation1946; Whitehead Citation1929). In the UK higher education sector, these functions have been refined through, for example, the implementation of the Research Excellence Framework (REF) and the Teaching Excellence Framework (TEF). The REF implemented in 2014, replaced the Research Assessment Exercise (RAE) that functioned between 1986 and 2008, to provide accountability for public investment in research and produce evidence of the benefits of this investment. It also provides benchmarking information and establishes reputational yardsticks for higher education institutions (HEIs); and underpins the selective allocation of an element funding for research. The TEF introduced and applied for the first time in 2016 complements the REF and assesses HEIs’ performance in delivering teaching. Information generated by the TEF on each HEI’s teaching quality is used by applicants to choose their university and course thereby indirectly linking performance to funding in the form of student tuition fees.
There is abundant literature on performance measurement in terms of efficiency and productivity analysis in the higher education (HE) sector. These are surveyed by Worthington (Citation2001), Johnes (Citation2004), Liu et al. (Citation2013), De Witte and López-Torres (Citation2017), Johnes, Portela, and Thanassoulis (Citation2017), and Rhaiem (Citation2017). More recent HE performance studies not covered by the aforementioned reviews include Johnes and Tsionas (Citation2019), Papadimitriou and Johnes (Citation2019), De Jorge Moreno et al. (Citation2019), Liu, Song, and Yang (Citation2019), Zhang and Shi (Citation2019), Mammadova and Aypay (Citation2020), Salas-Velasco (Citation2020), Agasisti et al. (Citation2021), Ghimire, Amin, and Wardley (Citation2021), Kaur (Citation2021), Thai and Noguchi (Citation2021), and Lee and Johnes (Citation2022). We provide an online appendix covering from 1999 to the most recent publications in the higher education efficiency field (Online Literature Appendix 2024).
The vast majority of these studies suggest that universities take staff (academic and sometimes professional services), students, and expenditure (or expenditure on specific areas such as library and computing) as inputs in order to produce teaching outputs such as graduates and research outputs such as publications and/or research income. Some studies attempt to incorporate measures of third mission outputs (such as patents) – see Thanassoulis et al. (Citation2011). A significant number of studies subsequently employ a second-stage approach to identify factors underpinning efficiency (as measured by the efficiency scores), in order to provide specific policy recommendations. Variables included in the second stage frequently fall into three main categories: factors relating to funding; student composition and quality; characteristics of the decision making unit (DMU) such as size, disciplines covered, mission focus, or staff composition and structures; and socio-economic background of the DMU’s location.
Despite a general alignment in the production model used in efficiency studies in higher education, we observe some variations in focus: some include student satisfaction as an output, allow for uncertainty, or relax the assumption of rationality in decision-making; some focus on an individual nation while others compare across countries often using a meta-frontier approach; some focus on topics of particular policy relevance such as merger; and increasing attention is being paid to the production model with network DEA becoming a more popular method of choice. Despite the plethora of efficiency and productivity studies in higher education, there has been little attention devoted to the issue of the environmental impact of university activities i.e. carbon emissions from the higher education sector. Just two studies (O’Hara and Sirianni Citation2017; Oloruntoba and Oladipo Citation2019) incorporate emissions as a bad output and we return to these later in the section.
In recent years, there has been increasing pressure on HEIs to incorporate a third function (or third mission) portrayed as ‘a contribution to society’ (Abreu et al. Citation2016; Urdari, Farcas, and Tiron-Tudor Citation2017). The third mission concept emerged in the 1980s as a consequence of global pressure on universities to play a more central role in the knowledge economy (Venditti, Reale, and Leydesdorff Citation2013). Conceptually, the third function is somewhat ambiguous (Gregersen, Linde, and Rasmussen Citation2009; Laredo Citation2007; Pinheiro, Langa, and Pausits Citation2015) but encompasses wide-ranging and recurring concepts such as the ‘entrepreneurial university’, ‘technology transfer’, and ‘Triple Helix Model (THM) partnerships’ (Trencher et al. Citation2014). What is clear about the third function is that it aims to contribute to the social, economic and cultural development of the regions in which they operate, by impacting and transferring knowledge and technologies to industry and to society at largeFootnote1 (Agasisti, Barra, and Zotti Citation2019; Compagnucci and Spigarelli Citation2020; De Jong et al. Citation2014; Secundo et al. Citation2017). A possibly emerging third mission concept is ‘co-creation for sustainability’ (Trencher et al. Citation2014) with institutions progressively engaging with environmental issues through research, teaching and their own actions as a business. It can therefore be argued that environmental issues and particularly sustainability are increasingly being seen as part of the third mission activities of HEIs.
The 2008 Climate Act committed the UK to reducing its greenhouse gas emissions by 80% by 2050 compared to 1990 levels, formed the Committee on Climate Change, and established UK carbon budgets. In June 2019, this was strengthened, committing the UK to bring all greenhouse gas emissions to net zero by 2050. This is referred to as the UK net zero target.
This paper is therefore concerned with incorporating the environmental impact of universities into the measurement of their efficiency. One reason for this focus is the United Nations’ (UN’s) 2030 agenda for sustainable development with the 17 sustainable development goals (SDGs) at its heart. These act as a call to action by all countries to tackle various global challenges with SDG number 13 focusing on climate action and identifying rising greenhouse gas emissions as a major contributor to the climate emergency. Businesses and investors need to ensure emissions are lowered whilst producing good outputs, thereby making climate, economic and business sense. The UK government’s strengthening commitment to bring all greenhouse gas emissions to net zero by 2050 (Department for Energy Security and Net Zero Citation2023) is aligned with the UN’s agenda, and the higher education sector will need to play its part in achieving this – through its teaching, research and knowledge exchange as well as the business activities of the universities that comprise the sector. For these reasons, and because of the issues raised in the Higher Education Funding Council for England (HEFCE) report and by the Higher Education Sustainability Initiative (HESI), in relation to carbon emissions management (see more details below), this paper therefore focuses on the term ‘sustainability’. While social, economic and environmental aspects are important, the authors can only work with available data, and at this stage, the only data available relates to sustainability, i.e. carbon emissions, and is available from HESA.
In the UK, sustainability in terms of reducing carbon footprint has gained traction in HEIs in recent years. The UK Climate Change Act of 2008 spearheaded the carbon reduction move by specifying the role the higher education sector can play in meeting national targets for carbon reduction. This led to the Higher Education Funding Council for England (HEFCE) releasing the report ‘Carbon reduction target and strategy for higher education in England’, which linked funding to performance against carbon management plans. This was followed up by similar publications in Scotland, Wales and Northern Ireland. In 2012, the Higher Education Sustainability Initiative (HESI) was formed, to which around 15 UK HEIs signed up, as a way of engaging HEIs with the new sustainable development agenda of commitment towards green campuses.Footnote2 On 1st May 2019, UK Members of Parliament (MPs) declared a climate and environment emergency, which is being adopted by an ever-increasing number of UK HEIs.
The social policies listed above are evidence of a national drive to push UK HEIs to engage in sustainable practices towards reducing carbon footprint. As vital hubs for research and teaching, HEIs are well-positioned to promote and encourage sustainability practices through teaching and research. In addition to incorporating sustainable development into their disciplines and courses, HEIs should also adopt a ‘practise what you preach’ motto. In this context, sustainability in terms of reducing carbon footprint would be a meaningful third function of UK HEIs.
Since 2019, a growing number of HEIs have undertaken steps towards reducing their carbon footprint and reporting their carbon management plans and activities in sustainability reports. The Environmental Association for Universities and Colleges (EAUC) provides a comprehensive overview of the sustainability commitments of UK HEIs. (https://www.eauc.org.uk/sustainability_commitments) – see .
Figure 1. UK HEIs committed and uncommitted towards sustainability (%), (September 2021). Source: https://www.eauc.org.uk/sustainability_commitments
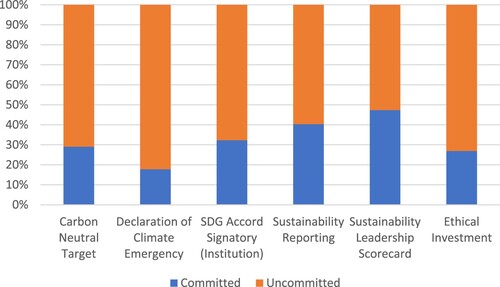
The above information relating to 2021 (accessed in September 2021) shows the percentage of HEIs committed to sustainability is well below the percentage that is uncommitted (in all categories), which suggests that the commitment of the HE sector as a whole towards sustainability in the UK is still lacking, especially as it has been thirteen years since the UK Climate Change Act 2008.
The challenge faced by HEIs (and all firms in all industries for that matter) is the trade-off arising from resource constraints. Resources spent on carbon reduction would mean less resources on activities relating to outputs of the traditionally key functions of HEIs (i.e. teaching and research). HEIs have to be efficient in allocating resources to their best use in order to maximise the number of good outputs (i.e. teaching and research) while minimising the amount of bad output (i.e. carbon emissions). The challenge at hand is thus finding the right balance between environmental performance and economic performance, which is faced by many corporate firms.
In the corporate environmental management literature, whether improving environmental performance worsens or improves economic performance has been widely debated since the late 1980sFootnote3, but so far, the results have been inconclusive (Schaltegger and Synnestvedt Citation2002; and Dechezleprêtre et al. Citation2019). The theoretical framework of Schaltegger and Synnestvedt (Citation2002, 340) indicates that ‘it is not the pure fact of being green but the way in which a certain level of environmental performance has been achieved that influence whether the correlation between environmental and economic performance is positive or negative’. This suggests there exists a trade-off between environmental performance and economic performance and is in line with Reinhardt’s (Citation1999) question on when it pays to be green and not if it pays to be green. Even with the implementation of social policies since 2008, UK HEIs’ carbon reduction has been somewhat lacklustre suggesting that HEIs are fearful that increasing commitment to environmental performance over time will reduce economic performance. Hence, the current study follows the theoretical framework of Schaltegger and Synnestvedt (Citation2002) to evaluate the validity of this and determine to what extent UK HEIs have achieved the optimal balance between environmental performance and economic performance.
In the literature on environmental performance and economic performance in the HE sector, only two studies were identified to have incorporated the third function, which considered carbon emissions as a bad output. These were O’Hara and Sirianni (Citation2017); and Oloruntoba and Oladipo (Citation2019).
O’Hara and Sirianni (Citation2017) used two inputs, expenditures on teaching and research, to produce two good outputs – total FTE enrolment as a teaching output and research grants obtained as research output; and one bad output – total carbon emissions (scope 1 and 2). The model specification for their DEA model does not include the input that correlates with carbon emissions, namely energy consumed. Oloruntoba and Oladipo (Citation2019) assumed a free disposability DEA model and used inputs energy consumption, FTE staff, and gross internal area to produce three good outputs research income, taught students FTE, research students FTE and one bad output carbon emissions. Their study however uses the DEA radial measure, which assumes proportional change in input or output resources and ignores the remaining non-radial slacks. This approach can result in efficiency scores that provide misleading estimates of performance and consequently incorrect decision making (Tone Citation2001; Torgersen, Førsund, and Kittelsen Citation1996). Assuming free disposability for bad outputs is unrealistic as it suggests that there is no cost in reducing carbon emissions without tradeoffs. The relationship between energy consumption and CO2 emissions is that they are non-separable and weak disposability must be considered in the model. To reduce CO2 emissions, energy consumption has to be reduced (with the given fixed technology).
The objectives of our study are twofold. First, to derive the efficiency of UK universities using a production model that incorporates the bad outputs of higher education production, namely carbon emissions. Second, to determine the factors associated with the (in)efficiency measures derived from this model via a second-stage regression with a view to providing policy recommendations.
The paper is divided into five sections. Following this introduction, Section 2 describes the data and selection of inputs, outputs and environmental variables. Section 3 explains the rationale for using the slacks based model (SBM) Overall efficiency approach. Section 4 presents and discusses the results. The paper concludes with brief remarks in section 5.
2. Data
The majority of the extant literature on efficiency and productivity analysis in HE adopts a production model whereby inputs namely labour (namely academic and non-academic staff), student enrolment (number of equivalent full-time students) and expenditure, produce teaching outputs in the form of qualifications (number of post-graduate degrees and undergraduate degrees conferred), and research output (often, but not exclusively, measured by research income) – see De Witte and López-Torres (Citation2017) for a comprehensive overview, and also specific references below and also the online appendix to this paper (Online Literature Appendix 2024) which we use to formulate our production model.
Taking the variables from previous studies into consideration and incorporating the bad output, CO2, into the production model, we identify five inputs producing three good outputs and one bad output. The inputs comprise full-time equivalent (FTE) staff (Agasisti et al. Citation2021; Kaur Citation2021; Lee and Johnes Citation2022; Oloruntoba and Oladipo Citation2019; Salas-Velasco Citation2020; Sharma and Mehra, Citation2017), FTE students comprising of student FTE teaching and student FTE research (Kumar and Thakur, Citation2019; Lee and Johnes Citation2022), operating expenses (Agasisti et al. Citation2021; Kaur Citation2021; Lee and Johnes Citation2022; Sharma and Mehra, 2019; Thai and Noguchi Citation2021), non-residential gross internal area (Oloruntoba and Oladipo Citation2019), and non-residential energy consumption (Oloruntoba and Oladipo Citation2019). The outputs comprise three good outputs namely the total number of undergraduates and postgraduates qualifications excluding number of doctorates (Kaur Citation2021; Kumar and Thakur, Citation2019; Lee and Johnes Citation2022), the total number of doctorates, and research income whereby competitively-won income reflects the prestige and hence denotes quality of research (Oloruntoba and Oladipo Citation2019; Salas-Velasco Citation2020). The bad output is CO2 emissions comprising non-residential scope 1 and 2 carbon emissions (Oloruntoba and Oladipo Citation2019; O’Hara and Sirianni Citation2017). Data are drawn from the Higher Education Statistics Agency (HESA) website https://www.hesa.ac.uk/.
We use Scope 1 and 2 total CO2 emissions because Scope 1 emissions refer to the direct greenhouse (GHG) emissions that occur from sources that are controlled or owned by an organization (e.g. emissions associated with fuel combustion in boilers, furnaces and vehicles), and Scope 2 emissions are indirect GHG emissions associated with the purchase of electricity, steam, heat, or cooling. We do not include Scope 3 emissions in our model because Scope 3 emissions are the result of activities from assets not owned or controlled by the reporting organization but that the organization indirectly impacts in its value chain and include all sources not within an organization’s scope 1 and 2 boundaries.
The study covers the years 2012/13–2018/19. We started in 2012/13 to correspond with the Higher Education Sustainability Initiative (HESI), as we aim to capture the progress and development of the sustainable development agenda of commitment towards green campuses since then. The study excludes the years after 2018–19 because of data availability and the impact of lockdowns on HEI functions due to COVID-19 and any results that may be derived after 2018–19 may not be a true reflection of the impact of the social policies.
We derived a balanced sample of data by using only HEIs that record data for all inputs, outputs and the environmental variables for the entire sample period 2012/13–2018/19. Ideally, all HEIs should be considered in our analysis but there were missing data for a number of HEIs in the UK HESA dataset and including them would have resulted in an unbalanced sample which is not appropriate for application of the SBM model. Note that HEIs that had zero research income were excluded. For HEIs that had research income but zero doctorates, the latter was assigned a value of 0.01 and included in our sample. The result was a balanced sample of 139 HEIs over 7 years leading to a total of 973 observations.
We perform a correlation test on our input-output dataset for 2018/19 and present the coefficients in .Footnote4 The results indicate that the relationships are as expected.
Table 1. Correlation analysis, 2018/19.
2.1. Second-stage environmental variables
For the second-stage analysis, we consider seven environmental variables that may help explain overall efficiency performance. These are ‘Teaching load’, ‘Non-residential income growth’, ‘Environmental management system (EMS) external verification’, ‘Proportion of non-academic staff’, ‘Presence of Science, Engineering and Medicine’, ‘Russell group’, and ‘Carbon reduction’ target. All environmental variables data are drawn from the HESA website except for ‘Russell group’, which is drawn from the Russell Group website (https://russellgroup.ac.uk/about/our-universities/).
‘Teaching load’ is measured as the ratio of FTE students to FTE staff (student-staff ratio). Lee (Citation2011) considered this variable as ‘actual student load’ and noted that more student numbers indicate less time on research activities thus reducing research performance. Although his study focussed on research performance, it allowed the current study to employ this variable to determine the performance of HEI in terms of teaching, research and limiting carbon emissions. That said, we do not offer an unambiguous a priori hypothesis as more students (per staff member) could result in an increase in the number of graduates, and by the same token, could also increase carbon emissions via an increase in energy consumption.
‘Non-residential income growth’ is measured as the percentage change in income from the previous year. We exclude residential income as the study focuses only on non-residential HEI activity. We hypothesise that an increase in income (which represents an increase in the overall size of operations of the HEI) expands teaching and research outcomes, and so positively affects efficiency. However, Papadimitriou and Johnes (Citation2018); and Wolszczak-Derlacz (Citation2017) noted that an increase in the proportion of funding coming from the government, or greater share of the revenue from noncompetitive resources, is negatively associated with efficiency. We also note that an increase in income may have a negative impact on efficiency through an increase in bad output. Specifically, we anticipate three possible alternative efficiency outcomes. First, increasing income is associated with an increase in efficiency because the increase in the output of teaching and research (the good outputs) is greater than the increase in the level of carbon emissions. Second, increasing income is associated with a decrease in efficiency because the increase in teaching and research outputs is less than the increase in the level of carbon emissions. Third, increasing income is associated with no change in efficiency because the increase in teaching and research outcomes is the same as the increase in the level of carbon emissions. These scenarios potentially inform us of the scale of operations, which raises the question of what is the optimum size that HEIs should pursue and achieve a balance between good and bad outputs.
‘Environmental management system’ (EMS) ‘is the system by which a company controls the activities, products and processes that cause, or could cause environmental impacts and in doing so minimises the environmental impacts of its operations.’ (https://assets.publishing.service.gov.uk/media/5a74b51ee5274a3f93b48266/environmental_management_system.pdf). In 2018/19, approximately 59 percent of HEIs either adopted an approved standard of environmental protection such as the International Organization for Standardization ISO14001, the EcoCampus scheme, or the Acorn BS8555.Footnote5 We first use EMS external verification as a dummy variable for each year; where 1 = verification certified and 0 = no verification. After this, we take the average value of the dummy variable over the sample period. Similar to Reinecke, Manning, and Von Hagen (Citation2012), we believe that sustainability schemes such as EMS, evaluate and promote organisational performance in relation to the environment. Hence, we hypothesise that HEIs with an EMS external verification would have successfully demonstrated environmental management and are likely to be more environmentally efficient, all else being equal. EMS external verification is also a measurement of quality and achieving this award suggests that the awardee has satisfied the required level of participation. As noted in Disterheft et al. (Citation2012), that for EMS to be effective and successful requires not only implementation but also the level of participation.
‘Proportion of non-academic to total staff’ reflects the percentage of non-academic staff per HEI. Few studies have attempted to measure the impact professional services staff have on university efficiency. Graham and Regan (Citation2016) performed a qualitative analysis of the contribution of professional staff to student outcomes for a UK and an Australian HEI, but the results showed little inference about the relative impact of professional services on the performance of their respective institutions. Baltaru (Citation2019) assessed whether changes in the staffing structure affected the performance of 100 British universities between 2003 and 2011. The results indicated that universities that increased their ratio of non-academic professionals to students displayed slightly higher rates of course completion, but no such effect was observed on research quality, good honours degrees or graduate employability. We extend this research by using the ‘Ratio of non-academic to total staff’ to reflect the percentage of non-academic staff that may influence the efficiency performance of HEIs. Given that Baltaru (Citation2019) showed that non-academics contribute positively to teaching outcomes, and have no effect on research outcomes, we do not offer an unambiguous a priori hypothesis based on the fact that more non-academics can increase teaching outcomes but could also increase carbon emissions due to increased energy consumption on campus given that professional services staff typically have less flexibility in terms of work location than academic staff (at least that was the case pre-pandemic) (Sharafizad, Paull, and Omari Citation2011).
‘Science, engineering and medicine (SEM)’ are courses that involve the use of laboratories and experiments, which can be time-consuming. In the case of research, academic researchers use specialised equipment for experiments that are only available on campus. On this basis, we hypothesise that HEIs with SEM courses will have higher carbon emissions than HEIs that focus on humanities and social science and thus negatively impact efficiency. This is consistent with Agasisti and Pohl (Citation2012), Barra, Lagravinese, and Zotti (Citation2018), Kempkes and Pohl (Citation2010) and Thai and Noguchi (Citation2021) who noted that science faculties (such as medical or engineering) were less efficient due to longer training durations and higher resource consumption. Larsen et al. (Citation2013) also demonstrated that carbon contributions of teaching and research in science, engineering and medicine (SEM) were higher compared to the humanities and social science (H&S). We use a dummy variable for the ‘Presence of SEM’ where HEIs having SEM = 1 and HEIs with no SEM = 0. That said, it should also be noted, however, that research income from SEM contributes a large portion of total research income and may thus have a positive impact on efficiency. On this basis, we do not offer an unambiguous a priori hypothesis on whether SEM has a positive or negative impact on the overall efficiency score.
The ‘Russell Group’ represents 24 leading UK HEIs, which excel in research. On 9th December 2019, the Russell Group published a joint statement on environmental sustainability (https://russellgroup.ac.uk/news/russell-group-publishes-joint-statement-on-environmental-sustainability), setting out its commitment to reducing carbon emissions and seeking to improve the energy efficiency of buildings through research, teaching and more sustainable practices. Although the statement was released at the end of 2019, it would not be surprising if the majority (if not all) of the HEIs in the ‘Russell group’ had already put in place actions and engaged in tackling climate change and having a positive relationship with overall efficiency. That said, Russell Group universities are among the UK’s highest-emitters in the HE sector because of their energy-intensive research programmes (Russell Group Citation2019), which would negatively impact overall efficiency. On this basis, we do not offer an unambiguous a priori hypothesis on whether Russell Group HEIs have a positive or negative impact on the overall efficiency score. The use of Russell Group as an environmental variable has only been considered by Lee and Johnes (Citation2022) but for different reasons namely that the reputation of Russell group universities makes their graduates more attractive in the labour market.
‘Total carbon reduction target’ is a self-imposed carbon reduction target for scope 1 and 2 emissions to 2020 against a 2005 baseline. HEFCE (Citation2010) prescribed a sector target of 34% reduction below 1990 levels in scope 1 and 2 emissions by 2020, which equates to a reduction of 43% of the 2005/06 baseline. To that end, HEIs have the option to adopt a carbon management plan via a self-imposed carbon reduction target. The question is whether resources allocated to achieving the self-imposed targets will negatively impact teaching and research outputs; or will have any meaningful impact on reducing carbon emissions. As Williams et al. (Citation2012) argued, whilst reducing emissions is important, it cannot be at the expense of the academic and economic merits they provide. According to the estates management record of HESA, the majority (59%) of UK universities failed to meet their carbon reduction targets of reducing emissions by 43% between 2005–06 and 2020–21 (Horton Citation2022). Given this information, we hypothesise that ‘carbon reduction target’ negatively impacts efficiency.
The summary statistics of our dataset for 2018/19 are presented in (and these are representative of previous years of the study).
3. Methodology
This paper employs the non-radial SBM non-separable (NS) and non-oriented model described in Cooper, Seiford, and Tone (Citation2007); and Tone (Citation2011) described in Appendix 1. Our rationale for this model is as follows. First, the SBM model successfully deals with slacks of each input/output individually and independently, whereas the DEA radial model results in non-radial slacks resulting in efficiency scores that provide misleading performance and consequently incorrect decision-making (Tone Citation2001; Torgersen, Førsund, and Kittelsen Citation1996).
Table 2. Descriptive statistics of the inputs, outputs and environmental variables for 2018/19.
Second, the SBM model does not adopt the assumption of proportional change but aims to obtain maximum rates of change of inputs and/or outputs (Avkiran, Tone, and Tsutsui Citation2008; Tone Citation2001). This suggests that the SBM model can be used to construct non-oriented models which assume that decision-makers can control the inputs and outputs simultaneously (Bilsel and Davutyan Citation2014; Du et al. Citation2014; Ozcan Citation2008; Sommersguter-Reichmann and Stepan Citation2015; Tone Citation2011; Zhu Citation2014; and Zhang, Tone, and Lu Citation2018).
Third, the SBM model considers weak disposability based on a piece-wise linear production technology characterized within an environmental DEA technology. It treats good and bad outputs asymmetrically and because the SBM model follows the weak disposability DEA model, it is consistent with the physical laws and allows the treatment of bad outputs showing the opportunity cost of reducing them (Färe and Grosskopf Citation2004). DEA and SBM models based on weak disposability have gained interest and acceptance since the pioneering work of Färe et al. (Citation1989). The new developments include Färe et al. (Citation1993), Färe and Grosskopf (Citation2004); Yaisawarng and Klein (Citation1994), Chung, Färe, and Grosskopf (Citation1997), Zofio and Prieto (Citation2001); Zhou, Ang, and Poh (Citation2008); and Tone (Citation2011).
Fourth, the SBM model considers the separability issue of ‘good’ and ‘bad’ outputs. Cooper, Seiford, and Tone (Citation2007) noted that ‘bad’ outputs are at times non-separable from the corresponding ‘good’ outputs; and at times ‘bad’ outputs are non-separable from the corresponding input. The notion of non-separability suggests that any reduction in ‘bad’ outputs would invariably be accompanied by a reduction in either good outputs or/and inputs. The issue of non-separability is evident in the higher education sector and trade-offs between good and bad outputs exist (i.e. reducing CO2 by using less energy would result in less graduate students and research publications). For example, science and related disciplines require laboratories, while the arts, music and drama require the use of stage, lighting, musical instruments and other facilities. The teaching and research in these disciplines require the use of these essential facilities that have to be conducted on campus in order to teach and research; and thus consume resources that produce CO2. If CO2 is to be reduced, then the consumption of inputs and/or good output has to be reduced. We can thus assume that non-residential energy consumption and non-residential scope 1 and 2 carbon emissions are non-separable. Consequently, weak disposability of bad outputs must be assumed and the SBM non-separable (NS) model has to be adopted (Cooper, Seiford, and Tone Citation2007).
We therefore employ the SBM non-separable (NS) and non-oriented model to generate the SBM overall efficiency (SBM-OE) scores in the first stage of analysis. SBM (non-radial approach) is applied to the separable outputs (i.e. total number of graduates and a number of research publications), and the radial approach is applied to the non-separable outputs (i.e. CO2). In the second stage, we regress the SBM-OE scores against the chosen environmental variables identified above. Given the nature of the efficiency scores (taking values only between 0 and 1), we have employed the two-part fractional regression model (FRM) proposed by Ramalho, Ramalho, and Henriques (Citation2010). The data-generating process for DEA scores via traditional linear or tobit models in the second-stage regression is not appropriate, whereas their proposed FRM ‘is the most natural way of modelling bounded, proportional response variables such as DEA scores’ (Ramalho, Ramalho, and Henriques Citation2010, 254).
4. Results and discussion
4.1. SBM-OE scores, 2012/13–2018/19
The SBM-OE scores in decreased from 0.8160 in 2012/13 to 0.7793 in 2016/17 before increasing to 0.8512 in 2018/19. The increase in the SBM-OE scores especially the last two years suggests that more HEIs are moving closer to reaching the optimal balance between environmental performance and economic performance. To understand the trend of the SBM-OE efficiency scores, we take a look at the trends for each of the variables that were used in the SBM_OE model. The trends for these variables are presented in .
Figure 2. Total FTE staff and FTE students, 2012/13–2018/19. Source: HESA (https://www.hesa.ac.uk/).
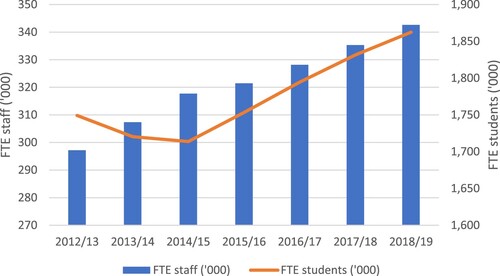
Figure 3. Non-residential GIA and Operating expenses, 2012/13–2018/19. Source: HESA (https://www.hesa.ac.uk/).
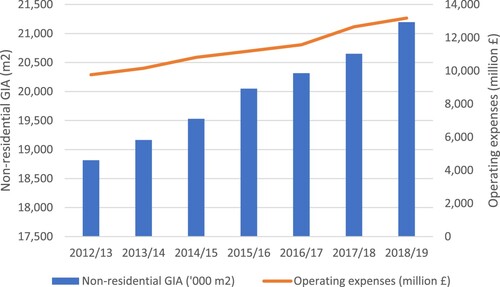
Figure 4. Total undergraduate and postgraduate, Doctorates and Research income, 2012/13–2018/19. Source: HESA (https://www.hesa.ac.uk/).
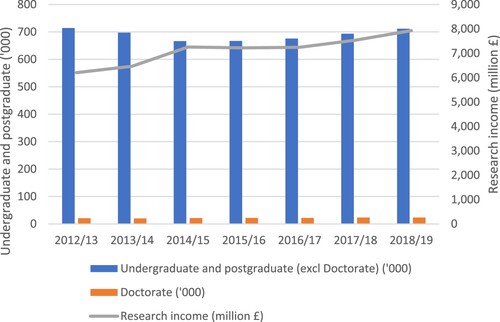
Figure 5. Non-residential energy consumption and Carbon emissions, 2012/13–2018/19. Source: HESA (https://www.hesa.ac.uk/).
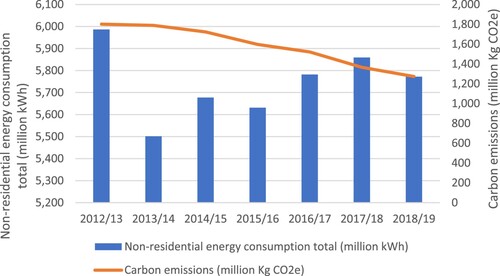
Table 3. Summary results of SBM-OE, 2012/13–2018/19.
We note from our sample that the total FTE staff and FTE students in have increased, and the inputs non-residential GIA and operating expenses in have also increased. The good outputs in , on average, have increased, but in , carbon emissions have decreased even when non-residential energy consumption increased since 2013/14 with a drop in 2018/19. Given the high correlation between carbon emissions and energy consumption in , further investigation into the sources of carbon emissions and energy consumption is warranted. We investigate the sources of carbon emissions and energy sources and illustrate them in and .
Figure 6. Carbon emissions by type of energy consumption (%), 2012/13–2018/19. Source: HESA (https://www.hesa.ac.uk/).
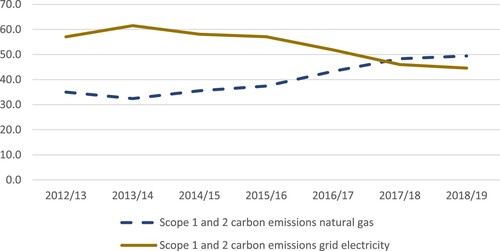
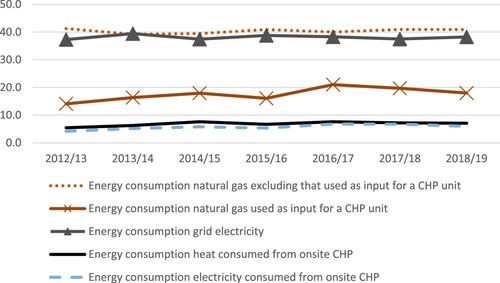
Figure 7. Type of energy consumption (%), 2012/13–2018/19. Source: HESA (https://www.hesa.ac.uk/).
shows the percentage of carbon emissions trends from natural gas and grid electricity. It is observed from these trends that carbon emissions from grid electricity have gradually declined even when the consumption levels remained around 32%. In contrast, carbon emissions from natural gas increased. Further investigation on the increase in natural gas consumption is revealed in .
shows the trends for the four highest energy sources – natural gas (on average 58%)Footnote6, grid electricity (on average 38%), heat consumed from onsite combined heat and power (CHP) (on average 7%), and electricity consumed from onsite CHP (on average 6%).Footnote7 Natural gas can be decomposed into natural gas not used as input for a CHP unit (on average 40%) and natural gas used as input for a CHP unit (on average 18%). The striking aspect of energy consumption of natural gas is that natural gas not used as input for a CHP unit has gradually decreased whereas natural gas used as input for a CHP unit has increased. The increase in natural gas consumption was due to natural gas used as input for a CHP unit for heating and electricity generation. As stated in HESA,
CHP is a means by which heat and electricity are generated locally, using gas but sometimes using other forms of fuel. It is an alternative to using grid electricity and other fuels for heating and is generally, but not always, a greener alternative. (https://www.hesa.ac.uk/collection/c20042/a/energygeneratedonsitebychp).
Table 4. Percentage of HEIs consuming energy from CHP.
HEIs had also begun using renewables, albeit slowly. Use of onsite photovoltaic increased from 0.03% to 0.16% of total energy consumption while onsite wind consumption was around 0.09% during this period. We tested the significance of these energy sources (heat and electricity consumed onsite CHP and renewable energy sources (onsite photovoltaic and wind)) on SBM-OE scores in our second-stage regression but the results revealed these variables were insignificant. Nonetheless, universities can increase their energy efficiency by more investment in photovoltaic as installation is easy and maintenance is within the existing facilities, and rural universities can invest in hydropower and wind energy through government support similar to the UK Feed-in Tariffs scheme, which funded installation and maintenance of photovoltaic plants over 2010–2019 (Eskander and Nitschke Citation2021).
HEIs can reduce the consumption of energy from grid electricity by switching to online teaching/learning. However, online teaching/learning as a substitute for face-to-face teaching/learning requires careful consideration as there are unintended consequences. First, as noted by Filimonau et al. (Citation2021), online teaching/learning simply transfers the carbon footprint from HE to households that are likely to be less environmentally efficient than the university campus setting. This is because universities can more successfully access environmentally friendly technologies and achieve economies of scale far greater than households. Second, online teaching/learning impacts the mental well-being of students and staff. In addition, it fails to provide the full developmental HE experience that includes socialisation, face-to-face interaction and interpersonal communication, and this, in turn, can reduce student productivity and performance, and inhibit the encouragement in students of transferable skills which are so crucial in leading to successful employment outcomes. Finally, online teaching/learning is infeasible for some courses that require the use of specialist equipment and space that only HEIs can provide.
4.2. Factors associated with efficiency – second-stage analysis
A second stage analysis assumes that the separability condition holds (Daraio, Simar, and Wilson Citation2018). This implies that the factors that condition the performance of the universities are implicitly assumed to influence only the inefficiency levels and not the shape of the efficient production frontier (i.e. the factors are considered as fully independent of the input and output space). Prior to our second-stage regression, we therefore perform a separability test according to Daraio, Simar, and Wilson (Citation2018). Using Wilson’s (Citation2008) FEAR software package version 3.1, we test the separability condition using Daraio, Simar, and Wilson (Citation2018) proposed central limit theorem. Using bootstrap replications of 1,000 and 10 splits as recommended by Daraio, Simar, and Wilson (Citation2018), we tested each individual environmental variable based on input-orientation and considered all inputs and good outputs only.Footnote8 The tests present p-values based on the bootstrap method described by Simar and Wilson (Citation2020). Our p-values shown in are greater than 0.05 based on Daraio, Simar, and Wilson (Citation2018) test statistic, which suggests that the null hypothesis of separability is not rejected for the alternative, thus confirming that the separability assumption holds.
Table 5. Separability test (p-values) based on input-orientation.
To explore factors associated with efficiency, we take the average SBM-OE scores over the sample period and regress them against the averages of the environmental variables using a fractional regression model (FRM).
Various functional forms can be used to estimate the FRM: logit, probit, loglog and Cloglog. We applied a variety of tests to establish the suitability of each of the functional forms: the Regression Equation Specification Error Test (RESET) test proposed by Papke and Wooldridge (Citation1996) based on one fitted power of the response index of Ramalho, Ramalho, and Henriques (Citation2010); the Goodness-of-function-form (GOFF(I)) and GOFF(II) tests of Ramalho, Ramalho, and Murteira (Citation2011); and the P-test proposed by Davidson and MacKinnon (Citation1981).
The test results reported in indicate that all functions, for both the first part and second part of the two-part model, are admissible. Given that the GOFFI and GOFFII tests do not reject the Logit, Probit, Loglog and Cloglog functions at the 1% level, we use the results of these functions for the first part and second part. The FRM results for Logit, Probit, Loglog and Cloglog functions are presented in . Discussions of results below focus only on the variables that are significant for all four functions.
Table 6. Specification tests for the two-part models (p values).
Table 7. FRM estimation results for logit, probit, loglog and Cloglog.
‘EMS external verification’ is significant and positively impacts OE suggesting the successful implementation and participation of sustainability schemes, which in turn promotes organisational performance and efficiency including in relation to the environment. As noted in Disterheft et al. (Citation2012), that for EMS to be effective and successful requires not only implementation but also the level of participation.
‘Presence of SEM’ negatively impacts on OE suggests that HEIs offering SEM courses consume more energy than HEIs that focus mainly on H&S and consequently increase their carbon emissions. Our finding, which concurs with Larsen et al. (Citation2013), is not unexpected because research is one of the three key functions of HEIs. Under the traditional production model where carbon emissions are not accounted for, HEIs will continue to increase their research activities. However, if reducing carbon emissions becomes the third function of HEI, then HEIs with SEM will have to find the optimum balance between research and carbon emissions. Even if HEIs were to reduce carbon emissions at the expense of research activities, this may be counter-productive. This is because many past discoveries and innovations were from intensive research in SEM. For example, the MRI scanner, ultrasound, surgery under anaesthesia, and the e-reader.
The negative impact of ‘Carbon reduction target’ on OE suggests two possibilities. The first is that too much resource is used leading to trade-offs resulting in reduced teaching and research outputs. Given the trends shown in , , , whereby good outputs have increased over time, it is unlikely that carbon target setting would have caused any such trade-offs. The second is that consuming insufficient resources contributes little towards the reduction of carbon emissions. HEIs recognise the important role they play in paving the way towards carbon reduction and demonstrate their commitment by setting self-imposed targets. However, as noted by Horton (Citation2022), the majority of UK universities failed to meet their carbon reduction targets. It is very likely that insufficient resources were used to reduce carbon emissions and only contributed towards inefficiency. As resources were insufficient, the outcomes therefrom may also not be immediately enjoyed and could take time to realise.
In the second part of FRM when only inefficient HEIs are considered, ‘teaching load’ and ‘Russell Group’ are significant and positively impact OE. As stated earlier, we could not offer an unambiguous a priori hypothesis relating to the effect of ‘teaching load’. The result suggests that inefficient HEIs are under-utilising ‘teaching load’ and can improve OE by increasing their student to staff ratio and achieving economies of scale until they reach an optimum level. We find ‘Russell Group’ significant and positive impacts on OE, which suggests that even when ‘Russell Group’ HEIs are inefficient, they are still contributing significantly in terms of research as would be expected because ‘Russell Group’ HEIs are research-intensive and offer world-class research facilities.
5. Conclusion
The current study measured the overall efficiency (OE) of 139 UK HEIs by incorporating both good and bad outputs in the SBM-OE model. The results show that efficiency decreased at first from 0.8160 at the start of the study period (2012/13) to 0.7793 in 2016/17, before increasing to 0.8512 at the end of the study period (2018/19). The increase in the efficiency scores especially in the last two years gives reason for optimism that more higher education institutions (HEIs) are moving closer to reaching the optimal balance between environmental performance and economic performance.
The OE scores were regressed against environmental variables to identify possible factors associated with efficiency. Our findings and policy recommendations for economic and environmental management can be summarised as follows.
Managers of HEIs and policy-makers can directly influence student intake – both international and domestic admission – now that the cap on the latter has been removed in the UK. The findings in the second stage analysis relating to ‘teaching load’ (ratio of students to staff) suggest that inefficient HEIs can improve their overall efficiency by increasing their teaching load. While one could argue that increasing student numbers (relative to staff) would increase carbon emissions, the results suggest that the efficiency gains from increasing student load are likely to outweigh the increase in carbon emissions.
In 2018/19, 59% of the surveyed HEIs in HESA had some form of environmental management system (EMS), and our results suggest that this is positively associated with the efficiency of both efficient and inefficient HEIs.
Having carbon reduction targets, on the other hand, negatively impact efficiency in efficient and inefficient universities. This is an interesting result and possibly is a consequence of too little time to realise any benefits from having such targets. With regards to self-imposed carbon reduction targets, 97% of HEIs demonstrate some level of participation. Given the active involvement of HEIs in EMS and self-imposed carbon reduction, environmental management however seems to be insufficient according to the recent UK student protests in 2019 on climate change and the environment. As noted by Piñeda (Citation2019),
The National Union of Students (NUS), which has been monitoring attitudes towards the environment since 2014, says 91% of students are “fairly or very concerned” about climate breakdown; 80% want their institution to be doing more on sustainable development, while 60% want to learn more about sustainability.
Having science, engineering and medicine (SEM) disciplines is also negatively related to efficiency for efficient and inefficient institutions. This is perhaps unsurprising given the way this model has been set up: these subjects which likely require substantial on-campus resources with accompanying carbon emissions are therefore likely to impact efficiency, and managers should be aware.
This work is an early effort to incorporate environmental issues into the higher education production process. We have focused on incorporating carbon emissions and revealed some interesting results and policy implications. However, managers and policy-makers should be aware of limitations.
First of all, this study focuses on a narrow definition of environmental impact (or sustainability) namely sustainability as measured by carbon emissions. To be absolutely clear the production model used only considers the environmental impact (carbon emissions) of on-campus activities and does not try to measure any wider positive impacts on the environment which universities can make through both their research and their teaching. Universities through their teaching can produce graduates who can take their knowledge of the environmental impact of business activities into the workplace and take a more responsible approach to running business. Through their research, universities can find innovations that can be shared through knowledge transfer directly with business to use in cleaner production methods. Future work in this area should aim to take these effects into account.
The second stage of analysis provides insights into factors associated with overall efficiency, the validity of which relies on the assumption of separability. This implies that the factors that condition the performance of the universities are implicitly assumed to influence only the inefficiency levels and not the shape of the efficient production frontier (i.e. the factors are considered as fully independent of the input and output space). While we undertook a separability test for each individual environmental variable based on input-orientation and considered all inputs and good outputs, we could not incorporate the bad output. Future work might explore the development of a separability test for models that include both good and bad outputs.
Finally, despite the caveats, we feel that this work is useful not only in the results it has produced but also in shining a spotlight on what is a highly important topic and we hope that it encourages future research to explore the topic further.
Disclosure statement
No potential conflict of interest was reported by the authors.
Notes
1 It is important to note the existence and importance of the UK Knowledge Exchange Framework (KEF) right at the start of this paper. The KEF, first published in 2021, is an attempt to measure HEIs’ performance on this third mission activity and is as yet not linked to the allocation of funds, although all HEIs in receipt of higher education innovation funding must participate in the evaluation. The concepts and metrics of the KEF relate largely to the concepts of ‘entrepreneurial university’, ‘technology transfer’, ‘Triple Helix Model partnerships’ and ‘sustainability’. That said, KEF is not included in this study because the KEF 2021 results cover the period 2018–2020 and are therefore beyond the scope of this study.
2 The current study focuses on HEIs’ reduction in carbon footprint and their commitment towards green campuses. This is one of HESI’s commitments. The other commitments not within the scope of the current study but worth mentioning are teaching sustainable development across all disciplines of study, encouraging research and dissemination of sustainable development knowledge, supporting local sustainability efforts, and engaging and sharing of information with international networks.
3 For a list of corporate environmental management literature, see Schaltegger and Synnestvedt (Citation2002).
4 We use 2018/19 as a representative of previous years.
5 The percentage is based on the responses from HEIs in the HESA survey. From the number of respondents of 160 HEIs, 94 responded with some form of approved environmental protection for the ‘environmental management system external verification’.
6 Consumption from natural gas includes that used as input for a CHP (combined heat and power).
7 The percentages are averages and derived by taking the average for the period 2012/13–2018/19 and based on the complete HEI list in HESA. Note that the breakdown by source for non-residential was unavailable and as such, we could only rely on the averages for total (aggregation of non-residential and residential).
8 The bad output was not considered in the separability test of Daraio, Simar, and Wilson (Citation2018) because their model only considers good outputs. Nonetheless, like any other standard production model (that ignores bad outputs), it is still meaningful to employ the separability test as the aim of the test is to determine whether the second-stage variables can be separated from the first-stage analysis. We had to rely on ‘input-orientation’ as the results for the ’non-oriented’ model were still being generated even after 24 h and this is for one environmental variable.
9 Note that the model described here is for a general SBM-OE model that incorporates both separable and non-separable bad outputs. As the current study only has one non-separable bad output, we therefore ignore the SB components within this model.
References
- Abreu, M., P. Demirel, V. Grinevich, and M. Karataş-Özkan. 2016. “Entrepreneurial Practices in Research-Intensive and Teaching-Led Universities.” Small Business Economics 47:695–717. https://doi.org/10.1007/s11187-016-9754-5.
- Agasisti, T., C. Barra, and R. Zotti. 2019. “Research, Knowledge Transfer, and Innovation: The Effect of Italian Universities’ Efficiency on Local Economic Development 2006−2012.” Journal of Regional Science 59 (4): 819–49. https://doi.org/10.1111/jors.12427.
- Agasisti, T., and C. Pohl. 2012. “Comparing German and Italian Public Universities: Convergence or Divergence in the Higher Education Landscape?” Managerial and Decision Economics 33:71–85. https://doi.org/10.1002/mde.1561.
- Agasisti, T., G.-L. Yang, Y.-Y. Song, and C. T. T. D. Tran. 2021. “Evaluating the Higher Education Productivity of Chinese and European “Elite” Universities Using a Meta-Frontier Approach.” Scientometrics 126:5819–53. https://doi.org/10.1007/s11192-021-03978-z.
- Avkiran, N. K., K. Tone, and M. Tsutsui. 2008. “Bridging Radial and Non-radial Measures of Efficiency in DEA.” Annals of Operations Research 164 (1): 127–38. https://doi.org/10.1007/s10479-008-0356-8.
- Baltaru, R. D. 2019. “Do Non-academic Professionals Enhance Universities’ Performance? Reputation vs. Organisation.” Studies in Higher Education 44 (1): 1183–96. https://doi.org/10.1080/03075079.2017.1421156.
- Barra, C., R. Lagravinese, and R. Zotti. 2018. “Does Econometric Methodology Matter to Rank Universities? An Analysis of Italian Higher Education System.” Socio-Economic Planning Sciences 62:104–20. https://doi.org/10.1016/j.seps.2017.09.002.
- Bilsel, M., and N. Davutyan. 2014. “Hospital Efficiency with Risk Adjusted Mortality as Undesirable Output: The Turkish Case.” Annals of Operations Research 221 (1): 73–88. https://doi.org/10.1007/s10479-011-0951-y.
- Chung, Y. H., R. Färe, and S. Grosskopf. 1997. “Productivity and Undesirable Outputs: A Directional Distance Function Approach.” Journal of Environmental Management 51 (3): 229–40. https://doi.org/10.1006/jema.1997.0146.
- Compagnucci, L., and F. Spigarelli. 2020. “The Third Mission of the University: A Systematic Literature Review on Potentials and Constraints.” Technological Forecasting and Social Change 161:120284. https://doi.org/10.1016/j.techfore.2020.120284.
- Cooper, W. W., L. M. Seiford, and K. Tone. 2007. Data Envelopment Analysis A Comprehensive Text with Models, Applications, References and DEA-Solver Software. 2nd ed. New York, NY: Springer.
- Daraio, C., L. Simar, and P. W. Wilson. 2018. “Central Limit Theorems for Conditional Efficiency Measures and Tests of the ‘Separability’ Condition in Non-parametric, Two-Stage Models of Production.” Econometrics Journal 21 (2): 170–91. https://doi.org/10.1111/ectj.12103.
- Davidson, R., and J. G. MacKinnon. 1981. “Several Tests for Model Specification in the Presence of Alternative Hypotheses.” Econometrica 49 (3): 781–93. https://doi.org/10.2307/1911522.
- Dechezleprêtre, A., T. Koźluk, T. Kruse, D. Nachtigall, and A. De Serres. 2019. “Do Environmental and Economic Performance Go Together? A Review of Micro-Level Empirical Evidence from the Past Decade or so.” International Review of Environmental and Resource Economics 13 (1–2): 1–118. https://doi.org/10.1561/101.00000106.
- De Jong, S., K. Barker, D. Cox, T. Sveinsdottir, and P. Van Den Besselaar. 2014. “Understanding Societal Impact Through Productive Interactions: ICT research as a Case.” Research Evaluation 23 (2): 89–102. https://doi.org/10.1093/reseval/rvu001.
- De Jorge Moreno, J., A. G. Robles, A. Martinez, R. M. Calvo, and A. G. Miron. 2019. “Assessing Efficiency in the Spanish Public Universities Through Comparative non-Radial and Radial Data Envelopment Analysis.” Tertiary Education and Management 25 (3): 195–210. https://doi.org/10.1007/s11233-018-09017-6.
- Department for Energy Security and Net Zero. 2023. Net Zero Government Initiative: UK Roadmap to Net Zero Government Emissions. London: Gov.UK. https://www.gov.uk/government/publications/net-zero-government-emissions-uk-roadmap#:~:text=Details,to%20net%20zero%20by%202050.
- De Witte, K., and L. López-Torres. 2017. “Efficiency in Education: A Review of Literature and a Way Forward.” Journal of the Operational Research Society 68 (4): 339–63. https://doi.org/10.1057/jors.2015.92.
- Disterheft, A., S. Caeiro, M. Ramos, and U. Azeiteiro. 2012. “Environmental Management Systems (EMS) Implementation Processes and Practices in European Higher Education Institutions – Top-Down Versus Participatory Approaches.” Journal of Cleaner Production 31:80–90. https://doi.org/10.1016/j.jclepro.2012.02.034.
- Du, J., J. Wang, Y. Chen, S.-Y. Chou, and J. Zhu. 2014. “Incorporating Health Outcomes in Pennsylvania Hospital Efficiency: An Additive Super-Efficiency DEA Approach.” Annals of Operations Research 221 (1): 161–72. https://doi.org/10.1007/s10479-011-0838-y.
- Eskander, S. M. S. U., and J. Nitschke. 2021. “Energy use and CO2 Emissions in the UK Universities: An Extended Kaya Identity Analysis.” Journal of Cleaner Production 309 (9): 127199. https://doi.org/10.1016/j.jclepro.2021.127199.
- Färe, R., and S. Grosskopf. 2004. “Modeling Undesirable Factors in Efficiency Evaluation: Comment.” European Journal of Operational Research 157 (1): 242–5. https://doi.org/10.1016/S0377-2217(03)00191-7.
- Färe, R., S. Grosskopf, C. A. K. Lovell, and C. Pasurka. 1989. “Multilateral Productivity Comparisons When Some Outputs Are Undesirable: A Nonparametric Approach.” The Review of Economics and Statistics 71 (1): 90–8. https://doi.org/10.2307/1928055.
- Färe, R., S. Grosskopf, C. A. K. Lovell, and S. Yaiswarng. 1993. “Deviation of Shadow Prices for Undesirable Outputs: A Distance Function Approach.” The Review of Economics and Statistics 75 (2): 374–80. https://doi.org/10.2307/2109448.
- Filimonau, V., D. Archer, L. Bellamy, N. Smith, and R. Wintrip. 2021. “The Carbon Footprint of a UK University During the COVID-19 Lockdown.” Science of the Total Environment 756:143964. https://doi.org/10.1016/j.scitotenv.2020.143964.
- Fischer-Appelt, P. 1984. “The Basic Functions of the Modern University.” Higher Education in Europe 9 (4): 6–10. https://doi.org/10.1080/0379772840090402.
- Ghimire, S., S. H. Amin, and L. J. Wardley. 2021. “Developing New Data Envelopment Analysis Models to Evaluate the Efficiency in Ontario Universities.” Journal of Informetrics 15 (3): 101172. https://doi.org/10.1016/j.joi.2021.101172.
- Graham, C., and J.-A. Regan. 2016. “Exploring the Contribution of Professional Staff to Student Outcomes: A Comparative Study of Australian and UK Case Studies.” Journal of Higher Education Policy and Management 38 (6): 595–609. https://doi.org/10.1080/1360080X.2016.1211935.
- Gregersen, B., L. T. Linde, and J. G. Rasmussen. 2009. “Linking Between Danish Universities and Society.” Science and Public Policy 36 (2): 151–6. https://doi.org/10.3152/030234209X406818.
- HEFCE (Higher Education Funding Council for England). 2010. Carbon Management Strategies and Plans: A Guide to Good Practice. Bristol: UK.
- Horton, H. 2022. “Most UK Universities Failing to Hit Carbon Reduction Targets.” The Guardian December 6, 2022. https://www.theguardian.com/education/2022/dec/06/uk-universities-failing-carbon-reduction-targets-emissions-fossil-fuel-divestment.
- Johnes, J. 2004. “Efficiency Measurement.” In International Handbook on the Economics of Education, edited by G. Johnes and J. Johnes, 613–742. Cheltenham, UK: Edward Elgar.
- Johnes, J., M. Portela, and E. Thanassoulis. 2017. “Efficiency in Education.” Journal of the Operational Research Society 68 (4): 331–8. https://doi.org/10.1057/s41274-016-0109-z.
- Johnes, J., and M. G. Tsionas. 2019. “Dynamics of Inefficiency and Merger in English Higher Education from 1996/97 to 2009/9: A Comparison of Pre-merging, Post-merging and Non-merging Universities Using Bayesian Methods.” The Manchester School 87 (3): 297–323. https://doi.org/10.1111/manc.12262.
- Kaur, H. 2021. “Assessing Technical Efficiency of the Indian Higher Education: An Application of Data Envelopment Analysis Approach.” Higher Education for the Future 8 (2): 197–218. https://doi.org/10.1177/23476311211011932.
- Kempkes, G., and C. Pohl. 2010. “The Efficiency of German Universities – Some Evidence from Nonparametric and Parametric Methods.” Applied Economics 42 (16): 2063–79. https://doi.org/10.1080/00036840701765361.
- Kumar, A., and R. R. Thakur. 2019. “Objectivity in performance ranking of higher education institutions using dynamic data envelopment analysis.” International Journal of Productivity and Performance Management 68: 774–796.
- Laredo, P. 2007. “Revisiting the Third Mission of Universities: Toward a Renewed Categorization of University Activities?” Higher Education Policy 20 (4): 441–56. https://doi.org/10.1057/palgrave.hep.8300169.
- Larsen, H., J. Pettersen, C. Solli, and E. Hertwich. 2013. “Investigating the Carbon Footprint of a University – The Case of NTNU.” Journal of Cleaner Production 48:39–47. https://doi.org/10.1016/j.jclepro.2011.10.007.
- Lee, B. L. 2011. “Efficiency of Research Performance of Australian Universities: A Reappraisal Using a Bootstrap Truncated Regression Approach.” Economic Analysis and Policy 41 (3): 195–203. https://doi.org/10.1016/S0313-5926(11)50032-3.
- Lee, B. L., and J. Johnes. 2022. “Using Network DEA to Inform Policy: The Case of the Teaching Quality of Higher Education in England.” Higher Education Quarterly 76 (2): 399–421. https://doi.org/10.1111/hequ.12307.
- Liu, J.-S., Louis Y.-Y. Lu, W.-M. Lu, and B.-J. Lin. 2013. “A Survey of DEA Applications.” Omega 41 (5): 893–902. https://doi.org/10.1016/j.omega.2012.11.004.
- Liu, H.-H., Y.-Y. Song, and G.-L. Yang. 2019. “Cross-Efficiency Evaluation in Data Envelopment Analysis Based on Prospect Theory.” European Journal of Operational Research 273 (1): 364–75. https://doi.org/10.1016/j.ejor.2018.07.046.
- Mammadova, R., and A. Aypay. 2020. “Efficiency Analysis of Research Universities in Turkey.” International Journal of Educational Development 75 (7): 102176. https://doi.org/10.1016/j.ijedudev.2020.102176.
- O’Hara, M. E., and P. Sirianni. 2017. “Carbon Efficiency of US Colleges and Universities: A Nonparametric Assessment.” Applied Economics 49 (11): 1083–97. https://doi.org/10.1080/00036846.2016.1210780.
- Oloruntoba, A., and J. T. Oladipo. 2019. “Modelling Carbon Emissions Efficiency from UK Higher Education Institutions Using Data Envelopment Analysis.” Journal of Energy Research and Reviews 3:1–18.
- Ozcan, Y. A. 2008. Health Care Benchmarking and Performance Evaluation. New York, NY: Springer Science.
- Papadimitriou, M., and J. Johnes. 2018. “Does Merging Improve Efficiency? A Study of English Universities.” Studies in Higher Education 44 (2): 1454–74.
- Papke, L. E., and J. M. Wooldridge. 1996. “Econometric Methods for Fractional Response Variables with an Application to 401(k) Plan Participation Rates.” Journal of Applied Econometrics 11 (6): 619–32. https://doi.org/10.1002/(SICI)1099-1255(199611)11:6<619::AID-JAE418>3.0.CO;2-1.
- Piñeda, N. L. 2019. “The Youth Generation Is United: The Uni Students Striking for the Climate.” The Guardian, September 19, 2019. https://www.theguardian.com/education/2019/sep/19/campus-is-the-perfect-place-to-disrupt-why-university-students-are.
- Pinheiro, R., P. V. Langa, and A. Pausits. 2015. “One and Two Equals Three? The Third Mission of Higher Education Institutions.” European Journal of Higher Education 5 (3): 233–49. https://doi.org/10.1080/21568235.2015.1044552.
- Potter, V. R., D. A. Baerreis, R. A. Bryson, J. W. Curvin, G. Johansen, J. McLeod, J. Rankin, and K. R. Symon. 1970. “Purpose and Function of the University.” Science 167:1590–3. https://doi.org/10.1126/science.167.3925.1590.
- Ramalho, E. A., J. J. S. Ramalho, and P. D. Henriques. 2010. “Fractional Regression Models for Second Stage DEA Efficiency Analyses.” Journal of Productivity Analysis 34 (3): 239–55. https://doi.org/10.1007/s11123-010-0184-0.
- Ramalho, E. A., J. J. S. Ramalho, and J. Murteira. 2011. “Alternative Estimating and Testing Empirical Strategies for Fractional Regression Models.” Journal of Economic Surveys 25 (1): 19–68. https://doi.org/10.1111/j.1467-6419.2009.00602.x.
- Reinecke, J., S. Manning, and O. Von Hagen. 2012. “The Emergence of a Standards Market: Multiplicity of Sustainability Standards in the Global Coffee Industry.” Organization Studies 33 (5–6): 791–814. https://doi.org/10.1177/0170840612443629.
- Reinhardt, F. 1999. “Bringing the Environment Down to Earth.” Harvard Business Review 77 (4): 149. July–August 1999.
- Rhaiem, M. 2017. “Measurement and Determinants of Academic Research Efficiency: A Systematic Review of the Evidence.” Scientometrics 110:581–615. https://doi.org/10.1007/s11192-016-2173-1.
- Russell Group. 2019. “Russell Group Universities Are Pulling in the Same Direction to Tackle Climate Challenges.” https://russellgroup.ac.uk/news/russell-group-universities-are-pulling-in-the-same-direction-to-tackle-climate-challenges/.
- Salas-Velasco, M. 2020. “Measuring and Explaining the Production Efficiency of Spanish Universities Using a Non-parametric Approach and a Bootstrapped-Truncated Regression.” Scientometrics 122:825–46. https://doi.org/10.1007/s11192-019-03324-4.
- Schaltegger, S., and T. Synnestvedt. 2002. “The Link Between `Green’ and Economic Success: Environmental Management as the Crucial Trigger Between Environmental and Economic Performance.” Journal of Environmental Management 65 (4): 339–46.
- Secundo, G., C. De Beer, C. S. L. Schutte, and G. Passiante. 2017. “Mobilising Intellectual Capital to Improve European Universities’ Competitiveness: The Technology Transfer Offices’ Role.” Journal of Intellectual Capital 18 (3): 607–24. https://doi.org/10.1108/JIC-12-2016-0139.
- Sharafizad, F., M. Paull, and M. Omari. 2011. “Flexible Work Arrangements: Accessibility in a University Environment.” Australian Universities’ Review 53 (2): 43–9.
- Sharma, M., and A. Mehra. 2017. “Dynamics of Higher Education in Punjab.” ANVESHAK-International Journal of Management 6: 76–91.
- Sibilio, S., and A. Rosato. 2016. “Energy Technologies for Building Supply Systems: MCHP.” In Energy Performance of Buildings: Energy Efficiency and Built Environment in Temperate Climates, edited by S.-N. Boemi, O. Irulegi, and M. Santamouris, 291–318. Cham, Switzerland: Springer International Publishing.
- Simar, L., and P. W. Wilson. 2020. “Hypothesis Testing in Nonparametric Models of Production Using Multiple Sample Splits.” Journal of Productivity Analysis 53 (3): 287–303. https://doi.org/10.1007/s11123-020-00574-w.
- Sommersguter-Reichmann, M., and A. Stepan. 2015. “The Interplay Between Regulation and Efficiency: Evidence from the Austrian Hospital Inpatient Sector.” Socio-Economic Planning Sciences 52:10–21. https://doi.org/10.1016/j.seps.2015.09.001.
- Stout, A. K. 1946. “The Functions of a University.” The Australian Quarterly 18:3–14. https://doi.org/10.2307/20631352.
- Thai, K. Q., and M. Noguchi. 2021. “Investigating the Technical Efficiency of Japanese National Universities Following Corporatization: A Two-Stage Data Envelopment Analysis Approach.” International Journal of Educational Management 35 (6): 1297–311.
- Thanassoulis, E., M. Kortelainen, G. Johnes, and J. Johnes. 2011. “Costs and Efficiency of Higher Education Institutions in England: A DEA Analysis.” Journal of the Operational Research Society 62 (7): 1282–97. https://doi.org/10.1057/jors.2010.68.
- Tone, K. 2001. “A Slacks-Based Measure of Efficiency in Data Envelopment Analysis.” European Journal of Operational Research 130 (3): 498–509. https://doi.org/10.1016/S0377-2217(99)00407-5.
- Tone, K. 2011. “Slacks-Based Measure of Efficiency.” In Handbook on Data Envelopment Analysis, 2nd ed. edited by W. W. Cooper, L. M. Seiford, and J. Zhu, 195–209. New York, NY: Springer.
- Torgersen, A. M., F. R. Førsund, and S. A. C. Kittelsen. 1996. “Slack-Adjusted Efficiency Measures and Ranking of Efficient Units.” Journal of Productivity Analysis 7 (4): 379–98. https://doi.org/10.1007/BF00162048.
- Trencher, G., M. Yarime, K. B. McCormick, C. N. H. Doll, and S. B. Kraines. 2014. “Beyond the Third Mission: Exploring the Emerging University Function of Co-creation for Sustainability.” Science and Public Policy 41 (2): 151–79. https://doi.org/10.1093/scipol/sct044.
- Urdari, C., T. Farcas, and A. Tiron-Tudor. 2017. “Assessing the Legitimacy of HEIs’ Contributions to Society: The Perspective of International Rankings.” Sustainability Accounting, Management and Policy Journal 8 (2): 191–215. https://doi.org/10.1108/SAMPJ-12-2015-0108.
- Venditti, M., E. Reale, and L. Leydesdorff. 2013. “Disclosure of University Research to Third Parties: A Non-market Perspective on an Italian University.” Science and Public Policy 40 (6): 792–800. https://doi.org/10.1093/scipol/sct027.
- Whitehead, A. N. 1929. The Aims of Education and Other Essays. New York, NY: Macmillan.
- Williams, I., J. Coello, S. Kemp, E. McMurtry, D. Turner, and L. Wright. 2012. “The Role of Business and Industry in Climate Management After Durban.” Carbon Management 3 (5): 431–3. https://doi.org/10.4155/cmt.12.51.
- Wilson, P. W. 2008. “FEAR: A Software Package for Frontier Efficiency Analysis with R.” Socio-Economic Planning Sciences 42 (4): 247–54. https://doi.org/10.1016/j.seps.2007.02.001.
- Wolszczak-Derlacz, J. 2017. “An Evaluation and Explanation of (in)Efficiency in Higher Education Institutions in Europe and the US with the Application of Two-Stage Semi-Parametric DEA.” Research Policy 46 (9): 1595–605. https://doi.org/10.1016/j.respol.2017.07.010.
- Worthington, A. C. 2001. “An Empirical Survey of Frontier Efficiency Measurement Techniques in Education.” Education Economics 9 (3): 245–68. https://doi.org/10.1080/09645290110086126.
- Yaisawarng, S., and J. D. Klein. 1994. “The Effects of Sulfur Dioxide Controls on Productivity Change in the US Electric Power Industry.” The Review of Economics and Statistics 76 (3): 447–60. https://doi.org/10.2307/2109970.
- Zhang, Z.-Y., and W.-B. Shi. 2019. “Research About the University Teaching Performance Evaluation Under the Data Envelopment Method.” Cognitive Systems Research 56 (1–2): 108–15. https://doi.org/10.1016/j.cogsys.2018.11.004.
- Zhang, X., K. Tone, and Y.-Z. Lu. 2018. “Impact of the Local Public Hospital Reform on the Efficiency of Medium-Sized Hospitals in Japan: An Improved Slacks-Based Measure Data Envelopment Analysis Approach.” Health Services Research 53 (2): 896–918. https://doi.org/10.1111/1475-6773.12676.
- Zhou, P., B. W. Ang, and K. L. Poh. 2008. “Measuring Environmental Performance Under Different Environmental DEA Technologies.” Energy Economics 30 (1): 1–14. https://doi.org/10.1016/j.eneco.2006.05.001.
- Zhu, J. 2014. Quantitative Models for Performance Evaluation and Benchmarking: Data Envelopment Analysis with Spreadsheets. 3rd ed. Cham, Switzerland: Springer.
- Zofio, J. L., and A. M. Prieto. 2001. “Overall Efficiency and Regulatory Standards: The Case of CO2 Emissions from OECD Industries.” Resource and Energy Economics 23 (1): 63–83. https://doi.org/10.1016/S0928-7655(00)00030-0.
Appendix
Non-radial SBM non-separable and non-oriented model (SBM-OE)
Let the observed input and output data matrices be and
, respectively, where n, m and s refer to the number of decision making units (DMUs), inputs and outputs. As described in the methodology section, output variables can be classified into non-separable goods (NSG), separable goods (SG), non-separable bads (NSB), and separable bads (SB); and some inputs are not separable from outputs.Footnote9 We can decompose the input and output data matrices
and
as follows:
where
and
denote separable and non-separable input data matrices, respectively, and
,
,
, and
denote separable good, separable bad, non-separable good and non-separable bad outputs, respectively.
Note that the behaviour of the non-separable outputs need special handling. A reduction of the non-separable bad outputs
is designated by
with
, which is accompanied by a proportionate reduction in the non-separable good outputs
as denoted by
as well as in the non-separable input denoted by
. Hence, the production possibility set
is defined by
where
are slacks to respective inputs/outputs.
The SBM-OE VRS model can be implemented in , and
as below,
subject to
where m = m1 + m2, s = s1 + s2 + s3 + s4, and is the intensity vector.