
 ?Mathematical formulae have been encoded as MathML and are displayed in this HTML version using MathJax in order to improve their display. Uncheck the box to turn MathJax off. This feature requires Javascript. Click on a formula to zoom.
ABSTRACT
Expanding sugarcane (SC) cultivation at the expense of paddy rice (PRC) areas led to soil nutrient cycling changes. The study hypothesized that SC straw return and fertilizer application after land use change (LUC) from PRC to SC cropping would increase the soil-crop systems nutrient balance, ultimately enhancing growth, yield, and nutrient use efficiency of SC. In a field study involving a 17-year chronosequence of sugarcane 6 (SC6), 13 (SC13), and 17 (SC17) years after LUC, the nutrient balance dynamics of SC were monitored in comparison with those of PRC. A phosphorus (P) balance increase of 62–102% after LUC increased soil available P (Pav) from 5.2 to 13.6–16.0 mg kg−1. A potassium (K) balance decrease of 47–55% after LUC led to a decrease in soil exchangeable K (Kex) from 102.5 to 96.2–56.8 mg kg−1. Moreover, LUC increased the % sand, soil organic matter (SOM), total mineral nitrogen (N), and total N. In contrast, the % clay, bulk density, cation exchange capacity (CECpH7), and exchangeable calcium (Caex) decreased after LUC. An increase in soil nutrients increased cane yield and nutrient use efficiency with time after LUC. However, further research in different locations and management practices is required for the LUC investigation.
HIGHLIGHTS
LUC in combination with tillage improved soil chemical properties, leading to increased sugarcane yield (SC6 > SC13 > SC17) and nutrient use efficiency.
In a system without tillage, after land use change (LUC), the percentage of sand, SOM, Pav and mineral N increased, while the percentage of clay, bulk density, CECpH7, Kex, and Caex decreased.
Sugarcane (SC) had a greater P balance than paddy rice (PRC) after LUC, leading to an increase in soil available P.
K inputs from rice straw return promoted a greater K balance in PRC than in SC.
Introduction
In recent decades, severe LUCs have occurred in tropical countries due to increasing populations and demand for food resources (Houghton et al. Citation1991; Houghton Citation1994; Lambin et al. Citation2001). Global sugar demand is expected to increase to 203 million tons by 2028 (14%), which will be mainly driven by rising sugar consumption in Asia, the Middle East and North Africa (OECD/FAO Citation2019). This led to worldwide expansion of the SC area from 2.58 to 2.61 million hectares (ha) (FAOSTAT Citation2022). Thailand, which is the world’s second largest sugar exporter, is expected to be a major competitor in filling the gap in supplies to expanding markets in Africa, the Middle East and Asia. Therefore, Thailand is projected to produce as much as 15.6 million tons of sugar by 2028 (OECD/FAO Citation2019). However, 25 to 30 years of continuous sugarcane cultivation affects soil fertility, leading to decreases in soil pH, SOM, total sulfur, total N, and available N (Chi et al. Citation2017; Pang et al. Citation2021). An increase in sugar demand has led to the expansion of cultivated SC area, which are the most common of all arable lands (approximately 46%) (Office of Agricultural Economics Citation2019). This has resulted in a decrease of approximately 1.29 million hectares in cultivated PRC area in the last decade (Land Development Department Citation2009, Citation2019). Continuous rice monocultures have led to increased soil compaction due to higher bulk density and decreased soil quality by reducing soil organic carbon (SOC), total N and cation exchange capacity (CECpH7) (Ba et al. Citation2016; Adelana et al. Citation2022). Therefore, changing from mono rice cropping to sugarcane could increase sugar production to meet global demand and improve soil fertility. However, LUC from PRC to SC cropping system has been observed only in Thailand. In contrast to Brazil, the world’s largest sugar exporter, where extensive deforestation and pasture conversion to SC has occurred (Arruda et al. Citation2019; Guarenghi et al. Citation2023), the LUC to SC significantly impacts soil physicochemical properties (Cherubin et al. Citation2015; Bordonal et al. Citation2017).
Six years after LUC from PRC to upland SC cropping in Thailand, consecutive straw return promoted total soil carbon (C) and N stock accumulation, while new C accumulation derived from sugarcane was confirmed by the13C distribution patterns observed across the soil profile. However, longer SC ratoon cycles (up to 17 years) slowed the total C accumulation in the 1 m soil profile (Phiwdaeng et al. Citation2023). In addition, LUC affects the physical and chemical properties of soil in different ways (Tellen and Yerima Citation2018; Enaruvbe et al. Citation2020). Decreased contents of several relevant soil nutrients (available phosphorus (Pav), sulfur (S), calcium (Ca), magnesium (Mg) and boron (B)) and CECpH7 have been found with natural forest to pasture conversions, while increased Ca, Mg and Pav have been observed under pasture to SC cultivation conversions (Cherubin et al. Citation2015). Moreover, in another study, the conversion of a pasture to a SC production area led to an increase in clay content, CECpH7 and Pav but a decrease in SOC (Geissen et al. Citation2009). The conversion from forest to plowing pasture increases soil bulk density and compactness, while these parameters are not different after a pasture is converted to SC fields (Cherubin et al. Citation2016). Changes in soil physicochemical properties may be influenced by crop management regimes and nutrient removal patterns after LUC.
A study showed that LUC from upland maize cultivation to irrigated rice cultivation and the concomitant change from mainly nonflooded to flooded conditions led to significant changes in SOC and total N (Li et al. Citation2020). The conversion of natural wetlands to croplands decreased SOC, total N and NH4+-N contents (Guo et al. Citation2019). Moreover, the conversion of upland fields to paddy fields led to significant increases in SOC and total N, while the pH and NO3−-N content significantly decreased (Sun et al. Citation2021). Management practices (tillage and straw return) are important factors controlling soil physical and chemical properties (Jayaraman et al. Citation2021). SC straw return is a short-term N source under ratoon cane conditions (Phukongchai and Kaewpradit Citation2022). A no-tillage system resulted in greater bulk density, SOC stock and SOC content than did the conventional tillage system (Liu et al. Citation2014; Coulibaly et al. Citation2022). Thus, LUC from tilled PRC to no-tilled SC may change both the physical and chemical properties of a soil. Moreover, there is a knowledge gap in how LUC from paddy to upland conditions affects soil fertility. LUC feedback has been investigated mainly in terms of soil physical and chemical properties, and the response of crop production and nutrient balance to changes in soil physical and chemical properties after the conversion of rice paddies to SC systems has not been fully elucidated.
Crop nutrient uptake, management, growth and yield impact soil fertility. SC nutrient uptake (39 kg N ha−1, 12 kg P ha−1, 39 kg K ha−1 (Yanai et al. Citation2010)) and rice nutrient uptake (24 kg N ha−1, 6 kg P ha−1, 7 kg K ha−1 (Naklang et al. Citation2006)) reflect crop nutrient removal and nutrient use efficiency. Because nutrients are removed from the soil by crops, crop residue return and fertilizer application are increasingly practiced. The balance between nutrient output and input is a major factor that controls a soil’s nutrient status (Hairiah et al. Citation2000; Qaswar et al. Citation2020; Singh et al. Citation2021). A nutrient surplus existed in an orchard (1,081 kg N ha−1 yr−1) after conversion from a maize – wheat system (205 kg N ha−1 yr−1), which increased the soil N content and stock (Lu et al. Citation2016). Greater nutrient input than output after LUC results in soil nutrient accumulation, while greater nutrient output than input leads to overall soil nutrient loss. Therefore, understanding the effects of LUC from PRC to sugarcane on nutrient balance, which is reflected in the soil nutrient status, is important. We hypothesized that LUC from PRC to SC cropping with SC straw return and chemical fertilizer application at different times would increase the nutrient balance in the soil – crop system. This positive effect can change some soil chemical properties and increase nutrient uptake, nutrient use efficiency, growth and yield in SC. In this study, the nutrient balance dynamics of a soil-crop system was investigated with a chronosequence of no-till SC cropping after conversion from tilled PRC systems (6, 13 and 17 years after LUC). Our specific objectives were (1) to investigate changes in several soil physicochemical properties, (2) to determine crop nutrient balance in the soil-crop system, and (3) to evaluate the growth, yield and nutrient use efficiency of sugarcane after PRC field conversion to SC cultivation.
Materials and methods
Description of the field experiment
The study was carried out in Lam Plai Mat district, Buriram Province, in northeastern Thailand (15°04’32.3’N, 102°48’11.0’E). Field sites under the same crop management practices were selected according to the history of LUC from PRC to upland SC cultivation using the space for time substitution principle. Specifically, sugarcane fields were selected 6 (SC6), 13 (SC13) and 17 (SC17) years after the LUC. The time since LUC was confirmed based on farmer interviews and land cover maps provided by the Land Development Department of Thailand (Figure S1). The three SC fields and a reference field (monocropped PRC with more than 40 years of cultivation and annual tillage during soil preparation), representing the factor “LUC”, were located within the same soil series (Phiwdaeng et al. Citation2023). The experimental soil used was a Cham Ni fine-silty soil (aquic Haplustalfs) (Soil survey staff Citation2010). The plots with the four land use types were located in close proximity, within a distance of 1–2 km, to reduce environmental variation. The average temperature was 27.1°C, and the mean annual precipitation was 1,284 mm since LUC was carried from PRC to SC (Figure S2). PRC (15°4’40.1’N 102°48’11.6’E) consisted of a monocrop PRC system in which rice straw was incorporated into the soil annually after harvest. Fertilizers were applied two times at the tillering and booting stages (50 kg N ha−1, 3.5 kg P ha−1, 3.3 kg K ha−1). The five, twelve and sixteen SC ratoon cycles were used for SC6 (15°4’30.38”N 102°48’11.94”E), SC13 (15°4’30.71”N 102°48’10.57”E) and SC17 (15°4’33.24”N, 102°48’11.46”E), respectively. In the SC fields, soil tillage was conducted only once during soil preparation prior to planting. SC straw was applied annually after harvest. During the growing period, dissolved urea (14.4 kg ha−1) was sprayed on the mulched straw 5 times. At the tillering stage, 43.8 kg N ha−1, 6.7 kg P ha−1 and 13.0 kg K ha−1 were applied. At the stalk elongation stage, 20.3 kg N ha−1, 4.7 kg P ha−1 and 32.4 kg K ha−1 were applied.
We randomly selected four 4 × 6 m plots inside a 100 × 120 m area in each field according to Phiwdaeng et al. (Citation2023). Three subplots (1 × 1 m2) were randomly selected within a 4 × 6 m area in each plot (Figure S3).
Soil sampling and analysis
Soil samples were collected shortly after the SC harvest between November and December 2017. Using a soil auger (⌀ 7.6 cm), soil samples were taken from each subplot to a depth of 100 cm. The soil cores were divided into 7 soil layers (0–10, 10–20, 20–30, 30–40, 40–60, 60–80, and 80–100 cm), which represented the factor ‘soil depth’. The divided soil samples from the 3 subplots per field were combined to obtain one composite sample (n = 4). The bulked samples were air-dried, passed through a 2 mm sieve, and stored for further analyses. Moreover, a single soil core (98.125 cm3) was taken at each soil depth for bulk density data. The % Clay, % silt and bulk density were determined according to Kilmer and Mullins (Citation1954) and Black (Citation1965), respectively. The soil pH was measured in water at a 1:1 ratio (Peech Citation1965). The cation exchange capacity (CECpH7) was determined by soil extraction with 1 M ammonium acetate at pH 7 (Jackson Citation1958). The SOM content was determined via wet oxidation (Walkley and Black Citation1934). The soil available phosphorus (Pav) concentration was determined by the Murphy and Riley reagent using the Bray II method (Bray and Kurtz Citation1945). Mineral N (NH4+-N, NO3—N) was determined in 10 g of fresh soil sample extracted with 50 ml of 1 M KCl following colorimetric analysis (Tecator Citation1984). Soil exchangeable potassium (Kex) and calcium (Caex) were extracted with 1 M ammonium acetate at pH 7 and determined by flame photometry (Jackson Citation1958). The total soil N content (TN) was determined via flow injection analysis after Kjeldahl digestion (Bremner Citation1965).
Plant sampling and analysis
Rice sampling
Rice grains and straw were sampled from 3 subplots (1 × 1 m2; Figure S3), dried at 70 °C for 48 h and weighed. The nutrient contents were determined by FIA (N), spectrophotometry (P) and flame photometry (K) after Kjeldahl digestion (N) and wet oxidation using nitric and perchloric acid (P, K). Total nutrient accumulation was calculated from the dry matter and nutrient contents.
Sugarcane growth and harvest
Cane tiller numbers were recorded in all plots (plot size: 6 m × 4 rows; Figure S3(a)). Six stalks (per plot) were randomly taken to determine the height, diameter and SPAD chlorophyll meter reading (SCMR) of the SC plants at 4, 6, 8, 10 and 12 months after harvest (MAH). At the time of ratoon harvest, all the canes in each plot were harvested. The stalk number, fresh weight, fresh weight and commercial cane sugar (CCS) content were recorded. The total soluble solids (°brix) were measured by a hand refractometer. CCS content was determined and subsequently calculated according to Blackburn (Citation1984). The stalks and straw were dried at 70 °C for 48 h to determine the stalk and straw dry weights and N, P and K contents. Total nutrient accumulation was calculated from the dry matter and nutrient contents.
Calculation of nutrient use efficiency, nutrient input and output
The internal efficiencies of N, P, and K (IEN, P, K) and the partial factor productivity of the applied N, P and K (PFPN, P, K) were calculated as follows:
The nutrient balance was calculated by the following formula (modified from Lu et al. Citation2016):
Nutrient inputs from chemical fertilizers and straw were estimated by multiplying their application rates by the actual concentrations of nutrients (). The nutrient output included nutrients removed by yield at harvest. Since these residues were returned to the soil, nutrient removal by rice and SC straws was excluded from the nutrient output.
Statistical analysis
The experimental design did not allow for the application of standard one-way or two-way ANOVA; instead, we applied univariate repeated-measures ANOVA (Bergh Citation1995), which helps to treat correlated data (subplots and soil properties within one profile). This method was used to examine the effects of LUC and soil depth on soil physicochemical properties as well as on nutrient balance, nutrient uptake, nutrient use efficiency and SC growth and yield. When significant differences existed, paired sample t tests (p < 0.05) were applied to compare the means of the treatments. Statistical analyses were performed using R software, version 4.0.5 (R Core Team Citation2019), and ANOVA was performed. The soil and plant parameter data for each treatment were subjected to principal component analysis (PCA) using XLSTAT software, version 2021 software package (Addinsoft New York, U.S.A.).
Results
Some soil physicochemical properties
Bulk density, SOM, Pav, Kex, Caex, NH4+-N, NO3—N, mineral N and total N were significantly affected by LUC, soil depth, and their interaction (); % sand, % clay and CECpH7 were affected by LUC and soil depth; and % silt and pH1:1 H2O were affected by soil depth. The percentage of sand significantly increased after LUC but decreased with soil depth (p < 0.01; ). No-till SC soils (SC6, SC13 and SC17) had higher percentages of sand than did the tilled PRC soil (). The percentage of silt was not affected by LUC but decreased with soil depth (). LUC significantly decreased the % clay bulk density and CECpH7 ( and ). The % clay, bulk density and CECpH7 increased with soil depth after LUC ( and ) but had no effect on the soil pH1:1 H2O (p > 0.05; ).
Figure 1. % Sand (a), % silt (b), % clay (c) and bulk density (d) after LUC in soil profile (1 m). Horizontal bars represent standard error of the mean (SEM), and different lowercase letters indicate statistically significant differences between the land-use types for the specific depth; capital letters indicate statistically significant differences between the soil layers for the same land-use types (p < 0.05). PRC: monocrop paddy rice, SC6: it was converted from paddy rice to sugarcane for 6 years, SC13: it was converted from paddy rice to sugarcane for 13 years, and SC17: it was converted from paddy rice to sugarcane for 17 years.
Figure 2. Cation exchange capacity (CECpH7) (a), soil pH (pH1:1H2O) (b), organic matter (SOM) (c) and available phosphorus (pav) (d) after LUC in soil profile (1 m). horizontal bars represent standard error of the mean (SEM), and different lowercase letters indicate statistically significant differences between the land-use types for the specific depth; capital letters indicate statistically significant differences between the soil layers for the same land-use types (p < 0.05). LUC: land use change, PRC: monocrop paddy rice, SC6: it was converted from paddy rice to sugarcane for 6 years, SC13: it was converted from paddy rice to sugarcane for 13 years, and SC17: it was converted from paddy rice to sugarcane for 17 years.
Table 1. Significance of single and interacted factors influencing the soil physicochemical properties.
Conversion from tilled PRC to no-till SC significantly increased SOM, whereby SC6 and SC13 had higher SOM than SC17 in the topsoil (0–10 cm) (). However, a greater amount of SOM was found in the PRC soil than in the SC soil in the subsoil (40–100 cm) (). Pav significantly increased after LUC, but the difference in Pav after LUC had no effect on Pav at the 0–20 cm depth (p < 0.01; ). However, Pav significantly decreased with increasing soil depth (p < 0.01; ). LUC significantly decreased Kex and Caex, while Caex increased with increasing soil depth (p < 0.01; ). In contrast, LUC significantly increased NH4+-N, NO3− -N, and total mineral N at all soil depths (p < 0.01, ). Furthermore, LUC significantly increased the total N at the 0–40 cm depth, but it decreased with increasing soil depth ().
Figure 3. Exchangeable K (Kex) (a), exchangeable Ca (Caex) (b), total N (Total N) (c), soil NH4+-N (NH4+-N) (d), soil NO3−N (NO3− -N) (e) and total mineral nitrogen (Total mineral N) (f) after LUC in soil profile (1 m). Horizontal bars represent Standard Error of the Mean (SEM), and different lowercase letters indicate statistically significant differences between the land-use types for the specific depth; capital letters indicate statistically significant differences between the soil layers for the same land-use types (p < 0.05). LUC: land use change, PRC: monocrop paddy rice, SC6: it was converted from paddy rice to sugarcane for 6 years, SC13: it was converted from paddy rice to sugarcane for 13 years, and SC17: it was converted from paddy rice to sugarcane for 17 years.
Nutrient balance and crop nutrient uptake
The nutrient balance in a soil – crop system is influenced by management regimes, crop nutrient uptake and crop nutrient removal. The yield, straw yield and total N uptake were significantly greater in the no-till SC treatment than in the tilled PRC treatment (p < 0.01; ). Moreover, PRC had the highest straw and total K uptake but had the lowest yield K uptake (). The differences in crop nutrient uptake led to nutrient removal by crops. Fertilizer application and SC straw return in each cropping system were highly variable among the individual fields (). The N and P inputs from SC straw did not differ after LUC, while the N and P inputs from fertilizer were greater in no-till SC than in tilled PRC, leading to greater total N and P inputs in no-till SC than in tilled PRC (). The N output (N removal by yield) was greater in the untilled SC treatment (105.62, 127.06 and 121.25 kg N ha−1 in SC6, SC13 and SC17, respectively) than in the tilled PRC treatment (67.01 kg N ha−1) (), but the N balance demonstrated no significant difference (). The total P input was significantly greater in no-till SC than in tilled PRC (p < 0.01; ), leading to an increase in the P balance from 5.11 to 10.34, 8.97 and 8.40 kg ha−1 in SC6, SC13 and SC17, respectively (62–102%) (p < 0.01; ). However, the K input from fertilizer and SC straw in untilled SC was lower than that in tilled PRC (). A lower K output was found in the tilled PRC (25.16 kg K ha−1), leading to a greater K balance than that in the untilled SC (119.43, 61.63, 53.78, and 62.96 kg K ha−1 for PRC, SC, SC13 and SC17, respectively) (p < 0.01; ).
Figure 4. Annual apparent nitrogen (a), phosphorus (b) and potassium (c) balances in different land use (kg ha−1) and N, P, K uptakes (d) of crop at final harvest. Vertical bars represent Standard Error of the Mean (SEM), and different lower-case letters indicate statistically significant differences (p < 0.05). LUC: land use change, PRC: monocrop paddy rice, SC6: it was converted from paddy rice to sugarcane for 6 years, SC13: it was converted from paddy rice to sugarcane for 13 years, and SC17: it was converted from paddy rice to sugarcane for 17 years.
Sugarcane: growth, yield and nutrient use efficiency
The different LUC time points affected the number of stalks; no-till SC17 had significantly higher (p < 0.05) values at 4, 6, 8, 10 and 12 MAH (). However, the height (p > 0.05), ), diameter and SCMR of the SC plants were not affected by the year in which LUC occurred (data not shown). LUC significantly decreased the single-stalk weight with increasing time from LUC implementation (1.40, 1.22, and 1.18 for SC6, SC13 and SC17, respectively) (p < 0.05, ). At the final harvest, an increase in the time after LUC led to an increase in millable cane from 88.75 Mg ha−1 (SC6) to 93.78 Mg ha−1 (SC13) and 100.24 Mg ha−1 (SC17) (). However, different LUC time points did not affect the straw fresh weight, straw dry weight, °Brix, or CCS at the final harvest (p < 0.05, ). However, yield and total dry weight significantly increased with time after LUC (p < 0.01; ). No-till SC17 had a greater yield dry weight (33.51, 28.40 and 23.00 Mg ha−1 in SC17, SC13 and SC6, respectively) and total dry weight than did SC6 and SC13 (45.71, 40.01 and 33.26 Mg ha−1 in SC17, SC13 and SC6, respectively). Moreover, LUC increased both SC yield and nutrient use efficiency. The no-till SC group had significantly greater IEN, IEP and IEK than did the no-till SC group (p < 0.01; ). The IEN, IEP and IEK concentrations increased with time after LUC treatment. Furthermore, PFP was affected by LUC. PFPN, PFPP and PFPK significantly increased with time after LUC (p < 0.01; ).
Figure 5. Internal Nutrient use efficiency (IEN,P,K):[yield/total N, P, K uptake] (a), and Partial factor productivity of applied Nutrient (PFPN,P,K): [yield/Nutrient applied] (b) of crop at final harvest. Vertical bars represent standard error of the mean (SEM), and different lower-case letters indicate statistically significant differences (p < 0.05). LUC: land use change, PRC: monocrop paddy rice, SC6: it was converted from paddy rice to sugarcane for 6 years, SC13: it was converted from paddy rice to sugarcane for 13 years, and SC17: it was converted from paddy rice to sugarcane for 17 years.
![Figure 5. Internal Nutrient use efficiency (IEN,P,K):[yield/total N, P, K uptake] (a), and Partial factor productivity of applied Nutrient (PFPN,P,K): [yield/Nutrient applied] (b) of crop at final harvest. Vertical bars represent standard error of the mean (SEM), and different lower-case letters indicate statistically significant differences (p < 0.05). LUC: land use change, PRC: monocrop paddy rice, SC6: it was converted from paddy rice to sugarcane for 6 years, SC13: it was converted from paddy rice to sugarcane for 13 years, and SC17: it was converted from paddy rice to sugarcane for 17 years.](/cms/asset/80392fb9-2f80-4921-b3ca-f056114cd460/gags_a_2330496_f0005_b.gif)
Table 2. Cane populations and plant height of sugarcane at 4, 6, 8, 10 and 12 months after harvesting (MAH).
Table 3. Single stalk weight, millable cane, leaf weight, °Brix, commercial cane sugar (CCS), and dry weight of sugarcane at final harvest.
Correlations between nutrient inputs, outputs, balances, soil nutrients and sugarcane yield
There were strong correlations between nutrient input and output and between nutrient balance and soil nutrients, as indicated by the significant biplot principal component analysis (PCA) and confirmed by Pearson’s correlation coefficients (p < 0.05, Figure S4). The first and second principal components (PCA1 and PCA2) explained 93.85%, 80.78%, 97.50% and 89.27%, respectively, of the total variability in the dataset (Figure S4). The N balance was significantly negatively correlated with N output (Figure S4(a)), while the P balance was significantly positively correlated with P input from fertilizer and total P input (straw and fertilizer) (Figure S4(b)). However, the K balance was significantly positively correlated with K input from straw and total K input (straw and fertilizer) and significantly negatively correlated with K output and K input from fertilizer (Figure S4(c)). N input and output had significant positive correlations with total mineral N (NH4+-N, NO3− -N) (Figure S4(a)), while P input and balance had significant positive correlations with Pav (Figure S4(b)). Kex was significantly positively correlated with K input and balance but significantly negatively correlated with K output (Figure S4(c)). Moreover, % clay and CECpH7 had positive correlations with Kex but negative correlations with Pav and total mineral N (Figure S4(d)). The change in soil physicochemical properties after LUC treatment from tilled PRC to no-till SC correlated with SC yield (Figure S5). The yield and total dry weight of SC had a significant positive correlation with total mineral N, while Pav and SOM had significant negative correlations with sugarcane yield. A biplot of PC1 and PC2 was generated (62.57%) (Figure S5).
Discussion
Changes in nutrient balance and soil negative charge drive soil N, P and K accumulation after LUC
Nutrient balances refer to the difference in nutrient input (straw and fertilizer) and crop nutrient uptake (output). The relationships between the amount of crop nutrient uptake and nutrient output and soil nutrient storage enable us to evaluate the sustainability of crop production during the transition from PRC to SC. Our results demonstrated that a higher P balance in no-till SC than in tilled PRC led to a greater Pav in the SC (). Pav was positively correlated with the P balance (Figure S4(b)). However, P uptake by rice and SC yield did not differ significantly; the higher P input in untilled SC than in tilled PRC promoted a greater Pav in SC, especially in the topsoil (0–0 cm) (). The Pav content increased after LUC treatment in response to fertilizer application, as shown by the positive correlation with P input from fertilizer (Figure S4(b)). A higher level of P input than output increases the total P and Olsen-P in the soil (Chen et al. Citation2011; Lu et al. Citation2016). This is in line with the findings of Moritsuka et al. (Citation2013), who reported that a high P fertilizer application rate led to an increase in Pav after LUC from paddies to upland crops and vegetables was carried out.
However, LUC decreased Kex throughout the soil profile in our study (). Because the K uptake by SC yield was greater than that by rice yield, the K balance was reduced, leading to a decrease in Kex after LUC (). Correlation analysis indicated that a higher K output resulted in a decrease in the K balance (Figure S4(c)). Although the K applied from fertilizer in no-till SC was greater than that in tilled PRC, SC had a lower K balance due to high K uptake by SC (high K output) (). Moreover, the K input from rice straw was greater than that from SC straw, which increased Kex in the tilled PRC soil, as shown by its positive correlation with K input from straw (, S4c). K is not associated with the structural organic components of plants, so it is released from rice straw after decomposition. Consequently, this nutrient is highly mobile and is rapidly released into the soil solution after it is returned to the soil (Lousier and Parkinson Citation1978). Therefore, rice straw retention has the potential to influence the amount of K returned to the soil, which affects the increase in K balance compared to that in the absence of rice straw return (Whitbread et al. Citation2003). A higher K balance after rice straw return led to an increase in the soil Kex (Saha et al. Citation2010). The K balance has a positive correlation with Kex (Han et al. Citation2021). Liao et al. (Citation2013) reported that rice straw addition could increase exchangeable K by 26.4% in comparison to that in a control treatment (without rice straw) in reddish paddy soil. Thus, the greater K uptake by SC yield and lower K input compared to those in the rice system could reduce the soil Kex in untilled SC.
Our study revealed that LUC had no effect on the N balance (). However, the N balance was negatively correlated with N output, as shown by the greater N uptake in the no-till SC yield than in the tilled PRC yield (Figure S4(a) and 4(d)). A previous study reported that rice N uptake (Rann et al. Citation2016) was lower than SC N uptake (Butphu et al. Citation2020). However, the total N input (straw and fertilizer; 51 kg N ha−1) was greater in SC than in PRC; therefore, there was no significant difference in the N balance. Because the amount of N fertilizer applied in this experimental field was higher than the recommended rate of N application for SC systems in Thailand (118.8 kg N ha−1) (Thawaro et al. Citation2017), the N balance did not decrease after LUC.
Soil mineral N increased after LUC, as shown by its positive correlation with N input and output after LUC in our study (Figure S4(a)). This was influenced by the higher N input from fertilizer and SC straw. An N application rate that is higher than the N uptake rate induces N accumulation. A 2 to 4 times greater N input to orchards and vegetable fields than to maize fields led to greater soil total N in orchards and vegetable fields than in maize fields (Chen et al. Citation2011). Moritsuka et al. (Citation2013) revealed that a high N fertilizer application rate after LUC from paddy to upland crops and vegetables increased the soil mineral N. Moreover, urea solution application to SC straw after SC harvest and during SC growth may have accelerated straw decomposition and N mineralization, which led to increased soil mineral N, as shown by the positive correlation of mineral N with total N input from straw and fertilizer (Figure S4(a)). This agrees with the observation that mineral N increased after forestland was converted into SC fields and nitrogen fertilizer was applied (Sattolo et al. Citation2017).
Soil mineral N and Pav accumulation after LUC was also influenced by the number of negative charges in the soil (% clay and CECpH7) (Figure S4(d)). However, the decrease in the negative charge (% clay and CECpH7) reduces soil Kex (Figure S4(d)). The change in field management practices from tillage (PRC) to no-till (SC) induced clay to move from the topsoil to the subsoil, leading to a decrease in the negative charge (% clay, CECpH7) in the topsoil (0–20 cm) after LUC (). A decrease in the soil negative charge reduces the leaching of NO3− and Pav, resulting in an increase in the N and P absorption efficiency. This led to an increase in total mineral N and Pav after LUC, especially in the topsoil (0–30 cm and 0–20 cm for total mineral N and P availability, respectively) (). This agreed with the findings of Pratt and Gabbe (Citation1964), who reported that clay content is negatively correlated with Pav. However, the decrease in soil negative charge (% clay, CECpH7) after LUC throughout the soil profile reduced Kex after LUC from PRC to SC because of the absorption ability of clay particles. Kex is strongly correlated with soil clay content (Wakeel et al. Citation2013). Thus, a decrease in K absorption efficiency occurred in the topsoil, and K leaching was induced. The soils in northeastern Thailand are typically sandy, with low cationic nutrient adsorption at exchange sites, which leads to a high nutrient leaching rate and K accumulation in the subsoil (Mehmood et al. Citation2017), resulting in poor plant K.
LUC significantly increased the P balance, leading to improved soil Pav, while a significant decrease in the K balance led to a decrease in the soil Kex. For the N balance, LUC did not lead to significantly changes. Although SC straw is returned to the soil annually, straw mulch affects only the soil surface, limiting decomposition and the release of nutrients. To improve the sustainability of such LUCs, the incorporation of SC straw may be needed.
Changes in soil physicochemical properties after LUC increased sugarcane yield
Our results demonstrated that LUC affects soil physicochemical properties, which influence sugarcane yield. A positive correlation was found between the total mineral N and SC yield (Figure S5). This led to an increase in the number of stalks per area with time after LUC (), which increased both the SC yield and the N use efficiency (IEN and PFPN) with time after LUC (, ). A higher IEN in SC indicates that higher nutrient uptake contributes to yield. Moreover, the increase in PFPN with time after LUC application reflected an increase in SC yield over time. These findings confirmed our hypothesis that LUC from PRC to SC cultivation with SC straw return and chemical fertilizer application at different times would increase the nutrient balance in the soil – crop system. This positive effect can increase some soil chemical properties, nutrient uptake, nutrient use efficiency, growth, and yield. Nitrogen fertilizer application is an important factor controlling the amount of soil NH4+-N and total minerals. Our results revealed the positive effect of LUC on soil total N, while consecutive rice or sugarcane monoculture resisted the decrease in soil total N. Mineral N (NH4+-N, NO3− -N) increased after N application, which affected SC yield (Vale et al. Citation2013). Gopalasundaram et al. (Citation2012) reported that an appropriate amount of N fertilizer application can markedly increase tillering and thus result in an early population with high yield, which can increase SC yield. Joris et al. (Citation2020) revealed that long‑term N fertilizer application not only increases soil N and SC yield but also reduces N uptake from fertilizer and increases N uptake from soil. This is in line with the findings of Cao et al. (Citation2022), who reported that N fertilizer application was positively correlated with N uptake, which increased wheat yield after 17 years of straw return with sufficient N fertilizer application compared to straw return alone. Moreover, we assumed that SC growth and yield may increase with an increase in mineral N after LUC under the combined practices of SC straw mulching and N fertilization. N promoted SC straw and SOM decomposition and released mineral N through mineralization. This was confirmed by our previous finding showing that soil C from previous rice plants (old C) decomposed 17 years after LUC (Phiwdaeng et al. Citation2023). This led to an increase in mineral N after LUC. Greater SC N uptake and N use efficiency led to an increase in SC growth and yield, as indicated by the positive correlation between SC yield and mineral N. A previous study showed that a combination of N fertilizer application and SC straw mulching increased SC yield by 1.2 Mg ha−1 in the third ratoon compared to that in the first ratoon cane (Yadav et al. Citation1994).
Although LUC increased Pav at 0–20 cm, Pav could not contribute to SC yield, as confirmed by the negative correlation between yield and Pav (Figure S5). A plausible explanation is that the soil Pav was lower than the optimum value for SC planting in our study. The optimum rate of Pav for SC planting is 20–40 mg kg−1 (Horneck et al. Citation2011). Although the soil Pav was lower than the optimum in our study, the nutrient use efficiency (IEP and PFPP) increased with time after LUC. Since 50% of the SC root biomass exists at the 0–20 cm soil depth (Smith et al. Citation2005), the roots can take up P. Adapting P inputs for the sugarcane root system could be highly efficient for nutrient uptake under low soil nutrient conditions (Otto et al. Citation2009). Yi et al. (Citation2022) reported increases of 24–51% in shallow root distribution (top root) and increases of 67–96% in shallow root biomass under low Pav conditions. Thus, these conditions increased nutrient use efficiency (IEP and PFPP) but did not contribute to SC yield in our study.
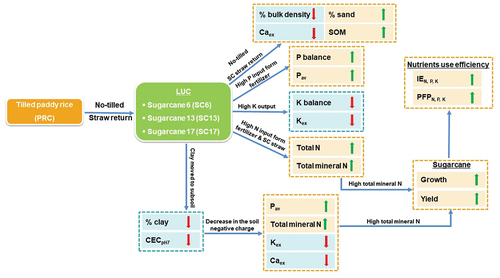
A negative correlation between SOM and SC yield was found in our study (Figure S5). Although LUC to SC increased the SOM content at the 0–30 cm depth, the SOM content was lower than the optimum content for SC production. The optimum rate of SOM for SC planting is 20–100 g kg−1 (FAO Citation2005). This led to the negative correlation between SOM and SC yield. However, the negative correlation between SOM and SC yield can be explained by the decomposition of SOM. After decomposition, SOM contributes N, P and S to the soil (Vityakon Citation2011). This was indicated by the increase in total N and mineral N, which supported the increase in SC yield with time after LUC. The conceptual discussion and result of our study is presented in .
Figure 6. A conceptual diagram illustrating the impact of land use change from tilled paddy rice to long-term no-till sugarcane cropping, with consecutive returns of sugarcane straw, on various soil physicochemical properties, nutrient balance, yield and nutrient use efficiency of sugarcane.
Conclusion
LUC from tilled PRC to untilled SC under consecutive SC straw return impacts soil fertility. After LUC, high P input from fertilizer increased the P balance and Pav accumulation from 5.2 to 13.6–16.0 mg kg−1. Meanwhile, the high K output resulted in a decrease in the K balance and soil Kex from 102.5 to 96.2–56.8 mg kg−1. Although, LUC did not affect the N balance, total mineral N and total N increased after LUC. Moreover, LUC from PRC to SC increased the % sand and SOM content while decreasing the % clay, bulk density and CECpH7. The decrease in the negative charge (% clay and CECpH7) after LUC from tilled PRC to untilled SC increases the availability of total mineral N and Pav. This improvement, along with enhanced nutrient use efficiency (PFPN, P, K and IEN, P, K), could promote the growth and yield of SC over time after LUC, resulting in an increase in SC yield from 88.7 to 100.2 Mg ha−1. Thus, the land use change from paddy rice to sugarcane has profound effects on soil nutrient balance and various properties, ultimately influencing sugarcane growth and productivity. Our research provides a fundamental understanding of the nutrient balance in soil-crop systems, facilitating enhancements in soil properties and sugarcane production after LUC. This could encourage farmers to change from rice planting to cultivating sugarcane. However, further field studies should consider several locations under different management practices such as burning, no-burn, tillage, no-tillage.
Supplemental Material
Download MS Word (1.7 MB)Disclosure statement
No potential conflict of interest was reported by the author(s).
Data availability statement
The data are available upon request from the authors.
Supplementary material
Supplemental data for this article can be accessed online at https://doi.org/10.1080/03650340.2024.2330496.
Additional information
Funding
References
- Adelana A, Aduramigba-Modupe V, Oke A, Are K, Ojo O, Adeyolanu O. 2022. Soil quality assessment under different long-term rice-based cropping systems in a tropical dry savanna ecology of northern Nigeria. Acta Ecol Sin. 42(4):312–321. doi: 10.1016/j.chnaes.2021.12.004.
- Arruda MR, Slingerland M, Santos JZL, Giller KE. 2019. Agricultural land use change and associated driving forces over the past 180 years in two municipalities of the Brazilian Cerrado. GeoJournal. 84(3):555–570. doi: 10.1007/s10708-018-9875-2.
- Ba LT, Van KL, Elsacker SV, Cornelis WM. 2016. Effect of cropping system on physical properties of clay soil under intensive rice cultivation. Land Degrad Dev. 27(4):973–982. doi: 10.1002/ldr.2321.
- Bergh DD. 1995. Problems with repeated measures analysis: Demonstration with a study of the diversification and performance relationship. Acad Manage J. 38(6):1692–1708. doi: 10.2307/256850.
- Black CA. 1965. Methods of soil analysis: part I, physical and mineralogical properties. Madison (Wisconsin): American Society of Agronomy.
- Blackburn F. 1984. Sugar cane. Tropical agricultural services. New York: Published in the USA by Longman inc.
- Bordonal RD, Lal R, Ronquim CC, de Figueiredo EB, Carvalho JLN, Maldonado W, DMBP M, Scala NL. 2017. Changes in quantity and quality of soil carbon due to the land use conversion to sugarcane (Saccharum officinarum) plantation in southern Brazil. Agric Ecosyst Environ. 24:54–65. doi: 10.1016/j.agee.2017.02.016.
- Bray RA, Kurtz LT. 1945. Determination of total organic and available form of phosphorus in soil. Soil Sci. 59(1):39–45. doi: 10.1097/00010694-194501000-00006.
- Bremner JM. 1965. Inorganic forms of nitrogen. In: Black C., editor. Methods of soil analysis Part 2, Agronomy monograph No. 9. Madison: ASA and SSSA; p. 1179–1237.
- Butphu S, Rasche F, Cadisch G, Kaewpradit W. 2020. Eucalyptus biochar application enhances Ca uptake of upland rice, soil available P, exchangeable K, yield, and N use efficiency of sugarcane in a crop rotation system. J Plant Nutr Soil Sci. 183(1):58–68. doi: 10.1002/jpln.201900171.
- Cao B, Qu C, Guo Y, Liu C, Liang Z, Jiao Y, Shi J, Tian X. 2022. Long-term nitrogen and straw application improves wheat production and soil organic carbon sequestration. J Soil Sci Plant Nutr. 22(3):3364–3376. doi: 10.1007/s42729-022-00892-y.
- Chen L, Qi X, Zhang X, Q LI, Zhang Y. 2011. Effect of agricultural land use changes on soil nutrient use efficiency in an agricultural Area, Beijing, China. Chin Geogr Sci. 21(4):392–402. doi: 10.1007/s11769-011-0481-1.
- Cherubin MR, Franco ALC, Cerri CEP, Karlen DL, Pavinato PS, Rodrigues M, Davies CA, Cerri CC. 2016. Phosphorus pools responses to land-use change for sugarcane expansion in weathered Brazilian soils. Geoderma. 265:27–38. doi: 10.1016/j.geoderma.2015.11.017.
- Cherubin MR, Franco ALC, Cerri CEP, Oliveira DMS, Davies CD, Cerri CC. 2015. Sugarcane expansion in Brazilian tropical soils-Effects of land use change on soil chemical attributes. Agric Ecosyst Environ. 211:173–184. doi: 10.1016/j.agee.2015.06.006.
- Chi L, Mendoza-Vega J, Huerta E, Álvarez-Solís J D. 2017. Effect of long-term sugarcane (Saccharum Spp.) cultivation on chemical and physical properties of soils in Belize. Commun Soil Sci Plant Anal. 48(7):741–755. doi: 10.1080/00103624.2016.1254794.
- Coulibaly SFM, Aubert M, Brunet N, Bureau F, Legras M, Chauvat M. 2022. Short-term dynamic responses of soil properties and soil fauna under contrasting tillage systems. Soil Till Res. 215:105191. doi: 10.1016/j.still.2021.105191.
- Enaruvbe GO, Osewole AO, Mamudu OP, Rodrigo-Comino J. 2020. Impacts of land-use changes on soil fertility in Okomu Forest Reserve, Southern Nigeria. Land Degrad Dev. 32(6):2130–2142. doi: 10.1002/ldr.3869.
- FAO. 2005. The importance of soil organic matter Key to drought-resistant soil and sustained food and production. Rome.
- FAOSTAT. 2022. Production: Crops and livestock products. [accessed 2024 February 8]. https://www.fao.org/faostat/en/#data/QCL.
- Geissen V, Sánchez-Hernández R, Kampichler C, Ramos-Reyes R, Sepulveda-Lozada A, Ochoa-Goana S, de Jong BHJ, Huerta-Lwanga E, Hernández-Daumas S, de Jong BHJ. 2009. Effects of land-use change on some properties of tropical soils — an example from Southeast Mexico. Geoderma. 151(3–4):87–97. doi: 10.1016/j.geoderma.2009.03.011.
- Gopalasundaram P, Bhaskaran A, Rakkiyappan P. 2012. Integrated nutrient management in sugarcane. Sugar Tech. 14(1):3–20. doi: 10.1007/s12355-011-0097-x.
- Guarenghi MM, Garofalo DFT, Seabra JEA, Moreira MMR, Novaes RML, Ramos NP, Nogueira SF, de Andrade CA. 2023. Land use change net removals associated with sugarcane in Brazil. Land. 12(3):584. doi: 10.3390/land12030584.
- Guo X, Chen L, Zheng R, Zhang K, Qiu Y, Yue H. 2019. Differences in soil nitrogen availability and transformation in relation to land use in the Napahai Wetland, Southwest China. J Soil Sci Plant Nutr. 19(1):92–97. doi: 10.1007/s42729-019-0013-0.
- Hairiah K, Van Noordwijk M, Cadisch G. 2000. Crop yield, C and N balance of three types of cropping systems on an Ultisol in Northern Lampung. Neth J Agri Sci. 48(1):3–17. doi: 10.1016/S1573-5214(00)80001-9.
- Han T, Huang J, Liu K, Fan H, Shi X, Chen J, Jiang X, Liu G, Liu S, Zhang L, et al. 2021. Soil potassium regulation by changes in potassium balance and iron and aluminum oxides in paddy soils subjected to long-term fertilization regimes. Soil Till Res. 214:105168. doi: 10.1016/j.still.2021.105168.
- Horneck DA, Sullivan DM, Owen JS, Hart JM. 2011. Soil test interpretation guide. EC 1478. Corvallis: Oregon State University.
- Houghton RA. 1994. The worldwide extent of land-use change. BioScience. 44(5):305–313. doi: 10.2307/1312380.
- Houghton RA, Skole DL, Lefkowitz DS. 1991. Changes in the landscape of Latin America between 1850 and 1985 II. Net release of CO2 to the atmosphere. For Ecol Manag. 38(3–4):173–199. doi: 10.1016/0378-1127(91)90141-H.
- Jackson ML. 1958. Soil chemical analysis. Englewood Cliffs: Prentice-Hall.
- Jayaraman S, Sinha NK, Mohanty M, Hati KM, Chaudhary RS, Shukla AK, Shirale AO, Neenu S, Naorem AK, Rashmi I, et al. 2021. Conservation tillage, residue management and crop rotation effects on soil major and micro-nutrients in Semi-arid Vertisols of India. J Soil Sci Plant Nutr. 21(1):523–535. doi: 10.1007/s42729-020-00380-1.
- Joris HAW, Vitti AC, Ferraz‑Almeida R, Otto R, Cantarella H. 2020. Long‑term N fertilization reduces uptake of N from fertilizer and increases the uptake of N from soil. Sci Rep. 10(1):18834. doi: 10.1038/s41598-020-75971-0.
- Kilmer VJ, Mullins J. 1954. Improved stirring and pipetting apparatus for mechanical analysis for soil. Soil Sci. 77(6):437–441. doi: 10.1097/00010694-195406000-00004.
- Lambin EF, Turner BL, Geist HJ, Agbola SB, Angelsen AJ, Bruce W, Coomes OT, Dirzo R, Fischer G, Folke C, et al. 2001. The causes of land-use and land- cover change: moving beyond the myths. Glob Environ Change. 11(4):261–269. doi: 10.1016/S0959-3780(01)00007-3.
- Land Development Department. 2009. Land use in Thailand 2008/2009; [accessed 2021 September 12]. http://www1.ldd.go.th/web_OLP/result/landuse2551-2552.htm.
- Land Development Department. 2019. Land use in Thailand 2017/2018; [accessed 2021 September 12]. http://www1.ldd.go.th/web_OLP/result/luse_result60-61.htm.
- Liao YL, Zheng SX, Nie J, Xie J, Lu YH, Qin XB. 2013. Long-term effect of fertilizer and rice straw on mineral composition and potassium adsorption in a reddish paddy soil. J Integr Agric. 12(4):694–710. doi: 10.1016/S2095-3119(13)60288-9.
- Liu E, Teclemariam SG, Yan C, Yu J, Gu R, Liu S, He W, Liu Q. 2014. Long-term effects of no-tillage management practice on soil organic carbon and its fractions in the northern China. Geoderma. 213:379–384. doi: 10.1016/j.geoderma.2013.08.021.
- Li X, Zhang H, Sun M, Xu N, Sun G, Zhao M. 2020. Land use change from upland to paddy field in Mollisols drives soil aggregation and associated microbial communities. Appl Soil Ecol. 146:1033512. doi: 10.1016/j.apsoil.2019.09.001.
- Lousier JD, Parkinson D. 1978. Chemical element dynamics in decomposing leaf litter. Can J Bot. 56(21):2795–2812. doi: 10.1139/b78-335.
- Lu Y, Chen Z, Kang T, Zhang X, Bellarby J, Zhou J. 2016. Land-use changes from arable crop to kiwi-orchard increased nutrient surpluses and accumulation in soils. Agric Ecosyst Environ. 223:270–277. doi: 10.1016/j.agee.2016.03.019.
- Mehmood K, Li J, Jiang J, Masud MM, Xu RK. 2017. Effect of low energy-consuming biochars in combination with nitrate fertilizer on soil acidity amelioration and maize growth. J Soils Sediments. 17(3):790–799. doi: 10.1007/s11368-015-1219-y.
- Moritsuka N, Nishikawa T, Yamamoto S, Matsui N, Inoue H, Li KZ, Inamura T. 2013. Changes in soil physicochemical properties following land use change from paddy fields to greenhouse and upland fields in the southeastern basin of Dianchi lake, Yunnan Province, China. Pedosphere. 2(2):3169–3176. doi: 10.1016/S1002-0160(13)60004-1.
- Naklang K, Harnpichitvitaya D, Amarante ST, Wade LJ, Haefele SM. 2006. Internal efficiency, nutrient uptake, and the relation to field water resources in rainfed lowland rice of northeast Thailand. Plant Soil. 286(1–2):193–208. doi: 10.1007/s11104-006-9037-z.
- OECD/FAO. 2019. OECD-FAO agricultural outlook 2019-2028. Rome: OECD Publishing, Paris/Food and Agriculture Organization of the United Nations.
- Office of Agricultural Economics. 2019. Land use in Thailand 2019; [accessed 2021 September 12]. https://www.oae.go.th/assets/portals/1/files/socio/LandUtilization2562.pdf.
- Otto R, Trivelin PCO, Franco HCJ, Faroni CE, Cesar A. 2009. Root system distribution of sugar cane as related to nitrogen fertilization, evaluated by two methods: monolith and probes. Rev Bras Ciênc Solo. 33(3):601–612. doi: 10.1590/S0100-06832009000300013.
- Pang Z, Tayyab M, Kong C, Liu Q, Liu Y, Hu C, Huang J, Weng P, Islam W, Lin W, et al. 2021. Continuous sugarcane planting negatively impacts soil microbial community structure, soil fertility, and sugarcane agronomic parameters. Microorganisms. 9(10):2008. doi: 10.3390/microorganisms9102008.
- Peech M. 1965. Hydrogen-Ion Activity. In: Black C., editor. Methods of soil analysis part 2.
- Phiwdaeng N, Kaewpradit W, Blagodatsky S, Rasche F. 2023. Temporal soil carbon and nitrogen accumulation after land use change from paddy rice to upland sugarcanecropping in Thailand. Geoderma Reg. 33:e00656. doi: 10.1016/j.geodrs.2023.e00656.
- Phukongchai W, Kaewpradit W. 2022. Sugarcane straw management by inoculation of microbial consortia and its impact on short-term N source and amelioration of ratoon sugarcane yield. Arch Agron Soil Sci. 69(12):2267–2285. doi: 10.1080/03650340.2022.2146101.
- Pratt PF, Gabbe MJ. 1964. Division s-2- soil chemistry: correlations of phosphorus availability by chemical tests with inorganic phosphorus fractions. USA: American society of agronomy; pp. 914–926.
- Qaswar M, Jing H, Ahmed W, Dongchu L, Shujun L, Lu Z, Cai A, Lisheng L, Yongmei X, Jusheng G, et al. 2020. Yield sustainability, soil organic carbon sequestration and nutrients balance under long-term combined application of manure and inorganic fertilizers in acidic paddy soil. Soil Till Res. 198:104569. doi: 10.1016/j.still.2019.104569.
- Rann V, Anusontpornperm S, Thanachit S, Sreewongchai T. 2016. Response of KDML105 and RD41 rice varieties grown on a Typic Natrustalf to granulated pig manure and chemical fertilizers. Agr Nat Resour. 50(2):104–113. doi: 10.1016/j.anres.2015.12.001.
- R Core Team. 2019. R: a language and environment for statistical computing. Vienna (Austria): R Foundation for Statistical Computing.
- Saha P, Miah M, Hossain A, Rahman F, Saleque M. 2010. Contribution of rice straw to potassium supply in rice-fallow-rice cropping pattern. Bangladesh J Agric Res. 34(4):633–643. doi: 10.3329/bjar.v34i4.5839.
- Sattolo TMS, Mariano E, Boschiero BN, Otto R. 2017. Soil carbon and nitrogen dynamics as affected by land use change and successive nitrogen fertilization of sugarcane. Agric Ecosyst Environ. 247:63–74. doi: 10.1016/j.agee.2017.06.005.
- Singh P, Benbi DK, Verma G. 2021. Nutrient management impacts on nutrient use efficiency and energy, carbon, and net ecosystem economic budget of a rice–wheat cropping system in Northwestern India. J Soil Sci Plant Nutr. 21(1):559–577. doi: 10.1007/s42729-020-00383-y.
- Smith DM, Inman-Bamber NG, Thorburn PJ. 2005. Growth and function of the sugarcane root system. Field Crops Res. 92:169–183. doi: 10.1016/j.fcr.2005.01.017.
- Soil Survey Staff. 2010. Keys to soil taxonomy. 11th Edn ed. Washington, D.C: USDA-Natural Resources Conservation Service.
- Sun M, Li T, Li D, Zhao Y, Gao F, Sun L, Li X. 2021. Conversion of land use from upland to paddy field changes soil bacterial community structure in mollisols of Northeast China. Microb Ecol. 81(4):1018–1028. doi: 10.1007/s00248-020-01632-4.
- Tecator. 1984. Determination of ammonia nitrogen (ASN 65-32/84) or nitrate nitrogen (ASN 65-31/84) in soil samples extractable by 2 M KCl using flow injection analysis. Application notes. Ho¨ganas, Sweden: Tecator.
- Tellen VA, Yerima BPK. 2018. Effects of land use change on soil physicochemical properties in selected areas in the North West region of Cameroon. Environ Syst Res. 7(1):3. doi: 10.1186/s40068-018-0106-0.
- Thawaro N, Toomsan B, Kaewpradit W. 2017. Sweet sorghum and upland rice: alternative preceding crops to Ameliorate Ethanol production and soil sustainability within the sugarcane cropping system. Sugar Tech. 19(1):64–71. doi: 10.1007/s12355-016-0437-y.
- Vale DW, Prado RM, Cantarella H, Fonseca IM, Avalhães CC, Correia MAR, Barbosa MP. 2013. Ammonium and nitrate in soil and ratoon sugarcane grown in function of nitrogen on Oxisol. J Plant Nutr. 36(2):201–213. doi: 10.1080/01904167.2012.739241.
- Vityakon P. 2011. Soil organic matter and soil quality in Northeast Thailand. Department of plant science and agricultural resources, faculty of agriculture. Khon Kaen, Thailand: Khon Kaen University; p. 142.
- Wakeel A, Gul M, Sanaullah M. 2013. Potassium dynamics in three alluvial soils differing in clay contents. Emir J Food Agric. 25(1):39–44. doi: 10.9755/ejfa.v25i1.15395.
- Walkley A, Black CA. 1934. An examination of degtjareff method for determining soil organic matter and proposed modification of the chromic acid titration method. Soil Sci. 37(1):29–35. doi: 10.1097/00010694-193401000-00003.
- Whitbread A, Blair G, Konboon Y, Lefroy R, Naklang K. 2003. Managing crop residues, fertilizers and leaf litters to improve soil C, nutrient balances, and the grain yield of rice and wheat cropping systems in Thailand and Australia. Agric Ecosyst Environ. 100(2–3):251–263. doi: 10.1016/S0167-8809(03)00189-0.
- Yadav RL, Prasad SR, Singh R, Srivastava VK. 1994. Recycling sugarcane trash to conserve soil organic carbon for sustaining yields of successive ratoon crops in sugarcane. Bioresour Technol. 49(3):231–235. doi: 10.1016/0960-8524(94)90045-0.
- Yanai J, Nakata S, Funakawa S, Nawata E, Katawatin R, Kosaki T. 2010. Effect of NPK application on the growth, yield and nutrient uptake by sugarcane on a sandy soil in Northeast Thailand. Trop Agric Dev. 54:113–118.
- Yi K, Li X, Chen D, Yang S, Liu Y, Tang X, Ling G, Zhao Z. 2022. Shallower root spatial distribution induced by phosphorus deficiency contributes to topsoil foraging and low phosphorus adaption in sugarcane (Saccharum officinarum L). Front Plant Sci. 12:797635. doi: 10.3389/fpls.2021.797635.