
Abstract
The Barda Wildlife Sanctuary (Barda WLS) is a semi-arid ecosystem that plays an important role in the conservation of mammalian carnivores. It is essential to evaluate the population of important wild prey species in Barda, which has conservation implications for mammalian predators and themselves. We assessed the density, biomass, and population structure of wild prey species by surveying road (n = 10) and trail (n = 8) transects using the distance sampling framework method. We used male-to-female sex ratios and the percent contribution of each age class to assess population structure. Mean group size (MGS), median group size (Mdgs), and mean crowding (Mc) were calculated to analyze group size. Of the species studied, Indian peafowl had the highest density (51.61 ± 7.08 individuals/km2), followed by wild pig (10.77 ± 4.59), blue bull (3.50 ± 0.51), Indian hare (3.03 ± 0.73), and spotted deer (0.62 ± 0.04). The male-to-adult female sex ratio was biased towards females, except for Indian peafowl. All species had small group sizes except wild pigs. The results of this study can aid in its development as one of the important protected areas in Gujarat for the conservation of mammalian predators, along with framing conservation strategies for Barda WLS.
INTRODUCTION
Birds and mammalian prey species could affect the structure and functioning of the ecosystem where they persist by affecting key ecological functions like nutrient cycling, seed dispersal, soil structure changes, and succession (Crawley Citation1983; Hobbs Citation1996; Wolf & Ripple Citation2016). Further, by acting as a prey base for a range of mammalian predators, which includes both meso and large predators, they are crucial for their long-term survival. Apart from that, they can affect life history characteristics such as population density, space use and competitive interactions of the meso and large mammalian predators (Carbone & Gittleman Citation2002; Karanth et al. Citation2004). Thus, a healthy population of birds and mammalian prey population is vital to support viable populations of a range of mammalian carnivores (Karanth & Sunquist Citation1995; Karanth & Stith Citation1999). However, despite their ecological importance, prey species of wild mammal has faced a decline in their population and historic range due to anthropogenic reasons like poaching, competition with livestock and habitat destruction. Therefore, birds and mammalian prey require their conservation planning, which is not possible without having baseline data on their ecology collected using robust scientific methods.
To effectively conserve and manage birds and mammalian prey species, it is crucial to understand population parameters such as density, social organization, and group size, which are inherently linked to ecosystem effectiveness (Jathanna et al. Citation2003). Assessing population parameters can help understand key ecological processes such as inter- or intraspecific competition, dispersal, and factors that limit or regulate the population (Krebs Citation2000). However, obtaining reliable estimates of prey populations is often challenging and requires rigorous monitoring to understand population trends and make better management decisions (Witmer Citation2005; Skalski et al. Citation2010). Various techniques have been used over time to monitor wild prey populations, with waterhole counts being the most commonly used (Dinerstein Citation1980). However, these methods do not account for animals missed during the survey and assume perfect detection for all individuals, which is often rare in actual field conditions (Tewari & Rawat Citation2013). The distance sampling framework method for estimating density is a robust statistical method that accounts for animals missed during the survey by estimating detection probability using an effective strip width (Buckland et al. Citation2015). Distance sampling has been widely used to assess population parameters for birds and mammalian prey across the globe.
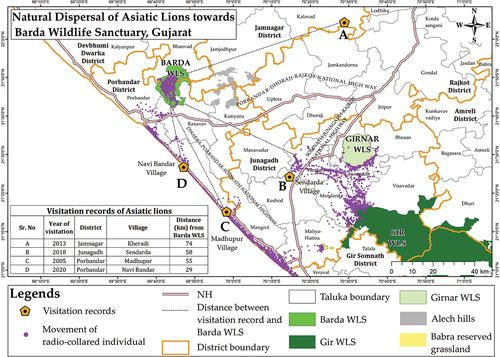
Barda Wildlife Sanctuary (Barda WLS hereafter) is among one of the wildlife sanctuaries situated in the semi-arid region of Gujarat, India. Barda harbours a range of large and meso carnivores like leopards, striped hyenas, small Indian civets and rusty spotted cats. Historically, Barda WLS had a population of Asiatic lions (Panthera leo persica), which deserted the area towards the end of the 19th century (Divyabhanusinh Citation2005; Misra Citation2005). However, currently, there are three Asiatic lions (one male and two females) in Barda WLS. One radio-collared male Asiatic lion has reoccupied the sanctuary through natural dispersal (). This further adds on to its mammalian carnivore richness. Thus, estimating the density of important wild prey species would help in framing conservation strategies for mammalian carnivores in Barda.
Fig. 1. Map indicating recent records of the natural dispersal of Asiatic lions towards the Barda WLS. The inset table indicates the visitation records’ distance from Barda WLS.
However, there is a lack of information on the wild prey population in Barda WLS. To our knowledge, the most recent estimates are from a survey conducted by Jhala et al. (Citation2014) approximately 8 years ago. Therefore, we conducted a study with the objectives of (a) assessing the population density (individuals/km2) and biomass of wild prey species, and (b) evaluating the population structure and grouping patterns of wild prey species in Barda WLS.
MATERIAL AND METHODS
Study area
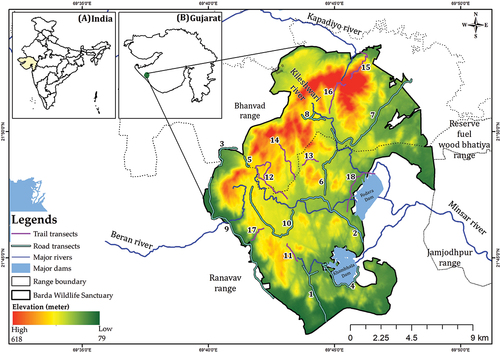
Barda WLS (21°40’N to 21°55’N, 69°40’E to 69°50’E) is situated in the Saurashtra region of the Gujarat state in western India (). It covers an area of 192.31 km2 and has a highly hilly and undulating terrain, with altitudes ranging between 79.2 to 617.8 m asl (Meena & Kumar Citation2014). It is situated in a semi-arid biogeographic zone with forest sub-types, including 5A-Southern tropical forest, 5A/C3-Southern dry mixed deciduous forest, and 6B-Northern tropical thorn forest (Misra Citation2005). Bhalodia et al. (Citation2002), using remote sensing, found that 16.3% of the area of Barda WLS is covered by dense forest, 29.9% by open forest, and the rest is categorized as degraded forest. The study area experiences 3 distinct seasons: summer (March to June), with May and June being the hottest months when temperatures can reach up to 42 °C; monsoon (June to November), with an average rainfall of around 650 mm; and winter (mid-November to February), with December and January being the coldest and driest months, with night temperatures falling to 8–10 °C (Vyas Citation2004). It is drained by two major rivers, Kileshwari and Minsar. Barda WLS is home to 368 floral species (59 trees, 83 shrubs, 200 herbs, and 26 climber species) (Raviya Citation2020) and 376 faunal species (22 mammals, 269 birds, 26 reptiles, 4 amphibians, and 55 butterfly species) (Meena & Kumar Citation2014). It has a broad vegetation association, including Acacia nilotica - Acacia senegal, - Dichrostachys cinerea, and Wrightia tinctoria - Butea monosperma association (Meena & Kumar Citation2014).
Fig. 2. Study area map showing the road transects (n = 10) and trail transects (n = 8) laid out in Barda Wildlife Sanctuary. The map insets indicate the location of Gujarat (A) within India and the study area (B) within Gujarat.
Currently, the most prominent carnivore species in the area are the Indian leopard (Panthera pardus fusca), jungle cat (Felis chaus), striped hyena (Hyaena hyaena), Indian golden jackal (Canis aureus), Indian grey mongoose (Herpestes edwardsii), small Indian civet (Viverricula indica), and Indian fox (Vulpes bengalensis), with occasional sightings of the ratel (Mellivora capensis). The major wild prey species are the blue bull (Boselaphus tragocamelus), wild pig (Sus scrofa), and Indian peafowl (Pavo cristatus). The spotted deer (Axis axis) and sambar (Rusa unicolor) have become locally extinct. Therefore, a breeding center has recently been established in Barda WLS to augment the population of these species.
There are about 58 nesses (temporary human settlements of pastoralist “maldhari” community; 18 nesses are abandoned, and 40 are inhabited) in the Barda WLS, housing 164 families (a human population of about 1051) with a livestock population of about 2333. However, due to better resource availability and accessibility, many of them are living outside the sanctuary.
Methodology
Distance sampling is a widely used framework for assessing wild prey species (Majumder et al. Citation2013; Awasthi et al. Citation2016; Upadhyay et al. Citation2019). There are several ways to use this framework for population assessment, such as line, road, and trail transects (Singh Citation2017). However, the study area in question has highly hilly and difficult terrain, which limits the scope of using the line transect method for population estimation. Therefore, to obtain better spatial coverage of the study area (as shown in ), we used a combination of the road (n = 10) and trail (n = 8) transects. While some studies have raised concerns about using trails as transects (Buckland et al. Citation1993), trails can be used for sampling as long as their curvature poses no serious theoretical or practical problems, and a substantial detection proportion occurs within the curvature radius (Hiby & Krishna Citation2004). Therefore, we only used reconnaissance trails that did not have sharp turns and allowed detection in a radius of curvature. Other studies (Khudsar et al. Citation2008) have also used this methodology to assess the wild prey population. Moreover, previous studies have indicated that animal interactions with roads are contingent on species-specific behaviours (Mulero-Pázmány et al. Citation2016). Nevertheless, roads offer a practical method for estimating the population of mammalian prey in hilly and undulating terrain while facilitating rapid coverage of the study area (Khan et al. Citation1996; Majumder et al. Citation2013; Ram et al. Citation2023). Given the predominantly rugged nature of our study area, we utilized roads as a monitoring tool for mammalian prey populations.
To collect data, we provided training to the observers involved in the estimation regarding methodology, work distribution within the team, observations to be recorded, data sheets, instrument handling in the field, timings, transects, etc. To ensure the detection of all wild prey species on and around the road transects, we used an open four-wheel vehicle (running at a speed of < 20 km per hour), with two observers on both the left and right sides, and one observer on the front seat to record data. Transects were conducted in the morning and evening hours between 07:00–09:00 and 16:00–18:00 hr, respectively, as this overlaps with the wild prey species’ activity period, allowing for a larger proportion of the population to be sampled. Similarly, trail transects were walked during the same times stated for road transects. We ran four temporal replicates of each road (n = 10) and trail (n = 8) transect, resulting in total efforts of 244.8 and 107.36 km, respectively (Table S1 in Supplemental Data). For each sighting on transects, we recorded data about the species name, group size, age and sex structure of the group, perpendicular distance from the transect, start and end time, GPS location (Garmin e-Trex 30), transect length, and milometer reading (in road transect) during the encounter. We measured the sighting distances from the transect using a laser rangefinder (Hawke Laser Range Finder 900 M) and used binoculars (Hawke Nature-Trek, 10 × 42) for fine-scale observations.
As the data collection included information on group size and age-sex structure, this data was subsequently used to evaluate the social organization and grouping patterns of the species under study.
Data analysis
Data analysis was conducted according to the recommendations of the distance sampling framework (Buckland et al. Citation1993, Citation2001), which assumes perfect detection of individuals along the line transects (both road and trail in this study). However, this assumption can be violated if the movement of the species under investigation is influenced by observer disturbance or other factors, potentially impacting detection probability and density estimates. To assess any evasive movements that might have affected the data, we first organized the data into very small groups of classes (Buckland et al. Citation2001). This step was taken to mitigate any bias in population estimates resulting from changes in detection distances and probabilities due to animal movement.
The perpendicular distances were grouped into large classes such that the detection function exhibited a shoulder, as recommended in previous studies (Buckland et al. Citation1993). A Chi-square test was used to evaluate the significant difference between the observed and expected groupings of perpendicular distance (Buckland et al. Citation1993). Furthermore, the detection function in distance sampling can be influenced by large animal species, as they can be detected at greater distances than smaller species due to their size and group size, which affects the monotonic decrease of the detection function and can potentially influence the effective strip width (ESW) and hence density (Buckland et al. Citation2001). To assess the relationship between detection distance and group size of animals, a linear regression was performed using the built-in analysis tool in the Distance 7.4 program. Three models [Half normal (HN), Uniform (UN), and Hazard rate (HR)] were used to determine the best fit for the detection function. Additionally, three keys [Cosine (COS), Simple Polynomial (SP), and Polynomial (P)] were used to adjust the shape of the detection function (Figs S2.1-S2.5, S3.1-S3.3 in Supplemental Data). A combination of all three models and three keys was utilized, and the best model was chosen based on the Akaike Information Criterion (ΔAIC). The model with the lowest AIC (ΔAIC = 0) was selected as the best for density estimation (Burnham & Anderson Citation2002).
To calculate the biomass of wild prey species, we multiplied the weight of each prey species by its abundance. The weight of each species was determined as follows: spotted deer (45 kg), sambar (160 kg), blue bull (180 kg), wild boar (45 kg), Indian peafowl (5 kg), and Indian hare (2 kg) (weight units adapted from Khan et al. Citation1996; Johnsingh & Manjrekar Citation2013).
Social organization and grouping pattern
Two methods for calculating ratios, specifically adult male to per 100 adult female and fawn to 100 adult female ratios, have frequently been used to measure social organization in prey species (Karanth & Sunquist Citation1992; Bagchi et al. Citation2008; Ramesh et al. Citation2012; Mehta & Soni Citation2018). Additionally, the percentage of the population in a specific age and sex group has been used as another measure. To assess the social organization of wild prey species, we used both ratio methods.
To assess the grouping pattern of the prey populations, we categorized the groups into six categories based on group size: 1, 2–5, 6–10, 11–15, 16–20, and > 20 individuals (Ramesh et al. Citation2012). We then assessed the number of groups in each category. Three measures of group size were used: mean group size, median group size, and crowding. Mean group size is a commonly used method for estimating group size (calculating this provides estimates for a comparative basis), but it can be affected by the inclusion of extremely large or small groups. To address this issue, we also calculated the median group size (Ramesh et al. Citation2012). In addition, we used the measure of “crowding”, which pertains to the size of the group in which an individual resides or, more broadly, to the group size experienced by individuals (Reiczigel et al. Citation2007). This measure is similar to Jarman’s typical group size, which also considers an individual’s experience of the group around it (Jarman Citation1974). We conducted the group size analysis using Flocker 1.1 (Reiczigel & Rozsa Citation2006).
RESULTS
Encounters of wild prey species
During the transect survey in Barda WLS, we recorded a total of 556 encounters with six wild prey species. The species with the highest number of encounters was the Indian peafowl (n = 411), followed by the blue bull (n = 48), Indian hare (n = 44), wild pig (n = 28), spotted deer (n = 22), and sambar (n = 3). Analysis for sambar was not carried out because of the very low sample size.
Density, biomass, grouping pattern and population structure
The highest density (individuals/km2 ± SE) of wild prey species in Barda WLS was recorded for Indian peafowl (51.61 ± 7.08), followed by wild pig (10.77 ± 4.59), blue bull (3.50 ± 0.51), Indian hare (3.03 ± 0.73), and spotted deer (0.62 ± 0.04) (). The highest biomass (kg) was recorded for blue bull (121140 ± 17640), followed by wild pig (93195 ± 39735), spotted deer (5355 ± 360), Indian peafowl (49625 ± 6810), and Indian hare (1166 ± 280). The mean group size among ungulates was highest for wild pigs and lowest for blue bulls (). Median group size and mean crowding showed the same pattern. The most frequent group size category was between 1 and 2–5 group size categories, while the high group size category was the least frequent (). The percentage of the population and the adult male to 100 adult female ratio were biased towards females in all wild prey species, except for Indian peafowl (). The highest number of adult females were present in blue bulls, as indicated by the percentage of the population contribution and the adult male to 100 adult female ratio, followed by spotted deer. The fawn to 100 adult female ratio was highest for Indian peafowl, followed by the wild pig, and lowest for blue bulls ().
Table 1. Population density, abundance and group size pattern of wild prey species in Barda WLS.
Table 2. Population structure of wild prey species in Barda WLS.
DISCUSSION
Population density and abundance
The present study was conducted to assess the population density and abundance of important wild prey species in Barda WLS. Our results show that the wild pig has the highest density among wild ungulates in Barda WLS. This finding is consistent with similar high-density estimates of the wild pig from other areas in India, such as Sariska Tiger Reserve (18.11) (Bagchi et al. Citation2008) and Keoladeo National Park (15.47) (Singh et al. Citation2017). However, in those studies, the high density was due to high group density rather than large group size, while in our study, the high density was due to large group size rather than group density. According to the group size theory, large groups form either to avoid predation or when food is abundantly available (Szeman et al. Citation2021). Therefore, the high group density during the pinch period (summer season) suggests good food availability in certain patches. If food patches were widely distributed, a higher group density of wild pigs would be expected.
The density of blue bulls in Barda WLS was found to be lower than that of wild pigs. Other studies have also reported low estimates of blue bull density in semi-arid areas such as Mukundra Hills Tiger Reserve (3.59) (Jhala et al. Citation2019) and Gir National Park and Wildlife Sanctuary (1.80) (Khan et al. Citation1996). The blue bull, which is the largest antelope in India, prefers open habitats and flat terrain (Khan et al. Citation1996; Mehta & Soni Citation2018). Barda WLS has highly undulating terrain along with woodland habitat and sparse open forest areas, which are available only on the edge of Barda WLS (). These ecological conditions may have contributed to the comparatively lower density of blue bull in Barda WLS.
The density of both spotted deer and sambar at Barda WLS is very low, and both species have been locally extinct from the area. To address this issue, the management authority has established a breeding center at Barda WLS to breed and release these species into the wild. Therefore, the present population estimates of spotted deer and sambar are made up of released individuals from the breeding center. The population of these species will take time to recover in Barda WLS since restocking efforts are ongoing. However, encounters of spotted deer fawn during the survey indicate that the released individuals have started breeding in the wild, which is a positive sign for the future.
A deciduous forest with a substantial amount of ground cover can provide Indian peafowl with good roosting sites and help them avoid predation. Furthermore, the surrounding arid environment with scattered boulders in Barda WLS provides suitable camouflage for Indian peafowl to evade predators. These factors contribute to the high density of Indian peafowl in the area. The Indian hare, being a small nocturnal species, may not have been encountered frequently during the survey, which could explain the low density reported in the present study.
Group size and population structure
Group size among prey species is influenced by various factors such as habitat structure, forage availability, predation pressure, and species evolutionary history (Jarman Citation1974; Isvaran Citation2007). The group size of blue bulls was found to be small in all measures, including mean group size (MGS), crowding (Mc), and median group size (Mdgs). Similar estimates of mean group size and typical group size (Tgs) have been reported from Gir National Park and Wildlife Sanctuary (MGS = 2.2; Tgs = 3.5) (Khan et al. Citation1996) and Ranthambore Tiger Reserve (MGS = 2.5; Tgs = 4.9) (Bagchi et al. Citation2008) in India. The small group size of blue bulls may be attributed to the dense woodland habitat structure as opposed to open areas such as savannahs and grasslands. Some scientific studies have reported larger group sizes of blue bulls in grasslands and open savannah habitats (Bagchi et al. Citation2008; Mehta & Soni Citation2018). Due to the dense habitat structure of woodland, coordination between individuals may be limited, leading to the formation of smaller groups (Bagchi et al. Citation2008; Mehta & Soni Citation2018). In our study, the maximum group size of blue bulls was 2–5 individuals, and such group size may be optimal against the patchy distribution of food and open grasslands in the study area.
The mean group size and crowding of wild pigs were larger than those of blue bulls and spotted deer. Studies from other parts of India have reported smaller group sizes of wild pigs than what was observed in this study (Rajaji = 3.79, Keladevi Wildlife Sanctuary = 3.16, Sariska Tiger Reserve = 2.87) (Jhala et al. Citation2019). The detection of a large number of piglets during the survey may have contributed to the larger group size of wild pigs in this study. A small group size of spotted deer was observed in this study, which is consistent with similar estimates reported from other areas such as Gir (7), Sariska (6.87), and Bandhavgarh (6.08) (Jhala et al. Citation2019). Although a large group congregation is possible in open grasslands, such areas are limited in Barda WLS, which may explain the small group size of spotted deer.
The population structure of all wild ungulate prey in Barda WLS was found to be highly skewed towards adult females, which is in line with similar findings from different ecosystems in India (Karanth & Sunquist Citation1992; Bagchi et al. Citation2008; Ramesh et al. Citation2012; Singh et al. Citation2017; Mehta & Soni Citation2018). This skewness towards adult females is likely due to strong male-male competition for mates, which can result in injury and lower survival rates of males compared to females, leading to a female-biased sex ratio in ungulate populations (Jorgensen Citation2011). The high piglet-to-adult female ratio observed in wild pigs suggests their high reproductive rates, while a similar observation in spotted deer indicates successful reproduction in Barda WLS. However, the low fawn to 100 adult female ratio in blue bulls might be attributed to the sampling being conducted during a single season. If the fawning peak in blue bull occurs during the winter season, then the present estimates of the fawn-to-adult female ratio might change.
CONCLUSION
In conclusion, the findings of this study have important implications for the conservation and management of wild prey in Barda WLS, and, ultimately for the conservation of the mammalian carnivores. As the sanctuary is among the only protected areas situated in the extreme west of Gujarat, therefore assessment and monitoring of the wild prey base is crucial for the conservation of mammalian carnivores. It will also enhance and strengthen the conservation efforts in the continuously expanding population and territories of Asiatic lions in the Saurashtra region. The increased population of blue bulls and wild pigs in Barda WLS may support the sustaining population of the Asiatic lion in the near future. However, it is also important to assess the factors governing the populations of spotted deer and sambar, which are crucial prey species to large carnivores like Asiatic lions, Indian leopards and striped hyenas in Barda WLS (Ram et al. Citation2023). To supplement the existing wild prey base population, it is suggested that the population of these wild prey species (spotted deer and sambar) may be translocated from the area with an eco-climatic resemblance to Barda WLS. For this, we suggest a detailed plan may be prepared as per the existing guidelines, and implemented accordingly. Moreover, the long-term assessment of the prey base and population of mammalian carnivores of Barda WLS is also suggested. This may help the managers to frame better conservation strategies for the conservation of predators and prey in Barda WLS.
ETHICAL STANDARD
We have estimated the herbivore population by non-invasive methods (road count method under distance sampling framework with the least disturbance to the studied species in their natural habitat), and hence, no ethical approval was required for the work performed. The counting was conducted as per the Standard Operating Procedures of the Gujarat Forest Department, Government of Gujarat, Gandhinagar, Gujarat, India.
AUTHOR CONTRIBUTION
M. Ram and A. Sahu conceived the study. M. Ram, A. Sahu and R. Chaudhary designed the study methodology. R. Chaudhary and Y. Zala analysed the data using the software. M. Ram, L. Jhala and Y. Zala curated the data. M. Ram and A. Sahu provided the resources. R. Chaudhary and M. Ram prepared the original draft of the manuscript. M. Ram, L. Jhala and R. Chaudhary reviewed and edited the draft. M. Ram, A. Sahu and N. Srivastava supervised the study. All authors have read and agreed to the published version of the manuscript.
Corr-AB-Supplemental-Material-1.docx
Download MS Word (15.7 KB)Corr-AB-Supplemental-Material-3.docx
Download MS Word (478.6 KB)Corr-AB-Supplemental-Material-2.docx
Download MS Word (782.1 KB)ACKNOWLEDGMENTS
We thank the Principal Chief Conservator of Forests & Head of Forest Forces (PCCF & HoFF), Gujarat State, for their support. Deputy Conservator of Forests, Porbandar Forest Division, Assistant Conservator of Forest, Range Forest Officers, field and office staff of Porbandar Forest Division are thanked. We thank the Government of Gujarat and the Gujarat Forest Department for support. The active participation and support of Mr Dipak Pandya, DCF (Retd.) Mr D.P. Vaghela, ACF (Retd.), Mr Rohit Vyas, Naturalist, and Mr Karshan Vala, Training Assistant, Wildlife Division, Sasan-Gir, are duly acknowledged.
DISCLOSURE STATEMENT
No potential conflict of interest was reported by the authors.
SUPPLEMENTAL DATA
Supplemental Data for this article can be accessed at https://doi.org/10.1080/03949370.2023.2301320
Additional information
Funding
REFERENCES
- Awasthi N, Kumar U, Qureshi Q, Pradhan A, Chauhan A, Jhala YV. 2016. Effect of human use, season and habitat on ungulate density in Kanha Tiger Reserve, Madhya Pradesh, India. Reg Environ Chan. 16(S1):31–41. doi:10.1007/s10113-016-0953-z
- Bagchi S, Goyal SP, Sankar K. 2008. Social organization and population structure of ungulates in a dry tropical forest in western India (Mammalia, Artiodactyla). Mammalia. 72(1):44–49. doi:10.1515/MAMM.2008.008
- Bhalodia K, Bhuva VJ, Dave S, Soni VC. 2002. Herpetofauna of Barda Wildlife Sanctuary, Gujarat. Zoos Print J. 47(9):591–591. doi:10.11609/JoTT.ZPJ.16.9.591
- Buckland ST, Anderson DR, Burnham KP, Laake JL. 1993. Distance sampling: estimating abundance of biological populations. London (UK): Chapman and Hall.
- Buckland ST, Anderson DR, Burnham KP, Laake JL, Borchers DL, Thomas L. 2001. Introduction to distance sampling: estimating abundance of biological populations. New York (NY): Oxford University Press.
- Buckland ST, Rexstad EA, Marques TA, Oedekoven CS. 2015. Distance sampling: methods and applications. New York (NY): Springer International Publishing.
- Burnham KP, Anderson DR. 2002. Model selection and multimodal inference a practical information-theoretic approach. New York (NY): Springer Publication.
- Carbone C, Gittleman JL. 2002. A common rule for the scaling of carnivore density. Science. 295(5563):2273–2276. doi:10.1126/science.1067994
- Crawley MJ. 1983. Herbivory: the dynamics of animal-plant interactions. Oxford (UK): Blackwell Scientific Publications.
- Dinerstein E. 1980. An ecological survey of the Royal Karnali-Bardia Wildlife Reserve, Nepal. Part III: Ungulate populations. Biol Conserv. 18(1):5–37. doi:10.1016/0006-3207(80)90063-4
- Divyabhanusinh C. 2005. The story of Asia’s lions. Mumbai (India): Marg Publication.
- Hiby L, Krishna MB. 2004. Line transect sampling from a curving path. Biometrics. 57(3):727–731. doi:10.1111/j.0006-341X.2001.00727.x
- Hobbs NT. 1996. Modification of ecosystems by ungulates. J Wildl Manage. 60(4):695–713. doi:10.2307/3802368
- Isvaran K. 2007. Intraspecific variation in group size in the blackbuck antelope: the roles of habitat structure and forage at different spatial scales. Oecologia. 154(2):435–444. doi:10.1007/s00442-007-0840-x
- Jarman PJ. 1974. The social organization of antelope in relation to their ecology. Behaviour. 48(1–4):215–267. doi:10.1163/156853974X00345
- Jathanna D, Karanth KU, Johnsingh AJT. 2003. Estimation of large herbivore densities in the tropical forests of southern India using distance sampling. J Zool. 261(3):285–290. doi:10.1017/S0952836903004278
- Jhala YV, Banerjee K, Basu P, Chakrabarti S, Gayen S. 2014. Assessment of Barda landscape for reintroduction of Asiatic lions. Dehradun (India): Wildlife Institute of India, Technical Report TR-2014/003.
- Jhala YV, Qureshi Q, Nayak AK, editors. 2019. Status of tigers, co-predators and prey in India, 2018. New Delhi (India): National Tiger Conservation Authority. Government of India, and Dehradun (India): Wildlife Institute of India.
- Johnsingh AJT, Manjrekar N. 2013. Mammals of South Asia. Hyderabad (India): Universities Press.
- Jorgensen J. 2011. Intra- and intersexual conflicts and cooperation in the evolution of mating strategies: lessons learnt from ungulates. Evol Biol. 38(1):28–41. doi:10.1007/s11692-010-9105-4
- Karanth KU, Nichols JD, Kumar NS, Link WA, Hines JE. 2004. Tigers and their prey: predicting carnivore densities from prey abundance. Proc Natl Acad Sci USA. 101(14):4854–4858. doi:10.1073/pnas.0306210101
- Karanth KU, Stith BM. 1999. Prey depletion as a critical determinant of tiger densities. In: Seidensticker J, et al., editors. Riding the tiger: tiger conservation in human-dominated landscapes. Cambridge (UK): Cambridge University Press; p. 100–113.
- Karanth KU, Sunquist ME. 1992. Population structure, density and biomass of large herbivores in the tropical forests of Nagarahole, India. J Trop Ecol. 8(1):21–35. doi:10.1017/S0266467400006040
- Karanth KU, Sunquist ME. 1995. Prey selection by tiger, leopard and dhole in tropical forests. J Anim Ecol. 64(4):439–450. doi:10.2307/5647
- Khan JA, Chellam R, Rodgers WA, Johnsingh AJT. 1996. Ungulate densities and biomass in the tropical dry deciduous forests of Gir, Gujarat, India. J Trop Ecol. 12(1):149–162. doi:10.1017/S0266467400009366
- Khudsar FA, Sharma K, Rao RJ, Chundawat RS. 2008. Estimation of prey base and its implications in Kuno wildlife sanctuary. J Bombay Nat Hist Soc. 105:42–48.
- Krebs CJ. 2000. Ecology: the experimental analysis of distribution and abundance. Germany: Benjamin Cummings.
- Majumder A, Sankar K, Qureshi Q, Basu S. 2013. Predation ecology of large sympatric carnivores as influenced by available wild ungulate prey in a tropical deciduous forest of Central India. J Trop Ecol. 29(5):417–426. doi:10.1017/S0266467413000473
- Meena RL, Kumar S. 2014. Management plan for Barda Wildlife Sanctuary. Gujarat (India): Gujarat Forest Department.
- Mehta D, Soni VC. 2018. Wild ungulates in a human dominated landscape: their population structure, density and biomass in western India. Int J Ecol Environ Sci. 44(3):319–329.
- Misra S. 2005. Gir Forest and the Saga of the Asiatic lion. New Delhi (India): Indus Publishing Company.
- Mulero-Pázmány M, D’Amico M, González-Suárez M. 2016. Ungulate behavioral responses to the heterogeneous road-network of a touristic protected area in Africa. J Zool. 298(4):233–240. doi:10.1111/jzo.12310
- Ram M, Sahu A, Srivastava N, Chaudhary R, Jhala L. 2023. Diet composition of Asiatic lions in protected areas and multi-use land matrix. J Vertebr Biol. 72(22065):1–9. doi:10.25225/jvb.22065
- Ramesh T, Sankar K, Qureshi Q, Kalle R. 2012. Group size, sex and age composition of spotted deer (Axis axis) and sambar (Rusa unicolor) in a deciduous habitat of Western Ghats. Mamm Biol. 77(1):53–59. doi:10.1016/j.mambio.2011.09.003
- Raviya RD. 2020. Floristic assessment of Barda Hills, Gujarat. Int J Res Biosci Agricult Technol. 8(3):231–235.
- Reiczigel J, Lang Z, Rozsa L, Tothmeresz B. 2007. Measure of sociality: two different views of group size. Anim Behav. 75(2):715–721. doi:10.1016/j.anbehav.2007.05.020
- Reiczigel J, Rozsa L. 2006. Flocker 1.0. Available from: http://www.behav.org/flocker/ [Accessed 2022 Aug 10].
- Singh A, Mukherjee A, Dookia S, Kumara HN. 2017. An updated account of mammal species and population status of ungulates in Keoladeo National Park, Bharatpur, Rajasthan. Curr Sci. 113(1):103–111. doi:10.18520/cs/v113/i01/103-111
- Singh HS. 2017. Dispersion of the Asiatic lion Panthera leo persica and its survival in human-dominated landscape outside the Gir forest, Gujarat, India. Curr Sci. 112(5):933–940. doi:10.18520/cs/v112/i05/933-940
- Skalski JR, Ryding KE, Millspaugh J. 2010. Wildlife demography: analysis of age, sex and count data. New York (NY): Elsevier Science.
- Szeman K, Liker A, Szekely T. 2021. Social organization in ungulates: revisiting Jarman’s hypotheses. J Evol Biol. 34(4):604–613. doi:10.1111/jeb.13782
- Tewari R, Rawat GS. 2013. Assessment of swamp deer habitat in and around Jhilmil Jheel conservation reserve, Haridwar, Uttarakhand, India. Int J Conserv Sci. 4:243–249. doi:10.1155/2013/278213
- Upadhyay HS, Behera S, Dutta SK, Sahu HS, Sethy J. 2019. A viable tiger population in Similipal tiger Reserve, India? Calculating if the ungulate prey base is limiting. Wildl Biol. 1(1):1–7. doi:10.2981/wlb.00474
- Vyas R. 2004. Fauna of protected area-10, note on amphibians of Barda Wildlife Sanctuary, Gujarat. Zoos Print J. 19(7):1545. doi:10.11609/JoTT.ZPJ.1034.1545
- Witmer GW. 2005. Wildlife population monitoring: some practical considerations. Wildl Res. 32(3):259–263. doi:10.1071/WR04003
- Wolf C, Ripple WJ. 2016. Prey depletion as a threat to the world’s large carnivores. R Soc Open Sci. 3:1–12. doi:10.1098/rsos.160252