
 ?Mathematical formulae have been encoded as MathML and are displayed in this HTML version using MathJax in order to improve their display. Uncheck the box to turn MathJax off. This feature requires Javascript. Click on a formula to zoom.
Abstract
Arctic amplification has many impacts on sea-ice extent, thickness, and flux. It becomes critical to monitor sea-ice conditions at finer spatio-temporal resolution. We used a simple convolutional neural network (CNN) on the RADARSAT-2 dual-polarized ScanSAR wide archive available over Coronation Gulf, Canada, to assess which SAR parameter improves model performances to classify sea ice from water on a large volume of data covering 11 years of ice and surface water conditions. An overall accuracy of 90.1% was achieved on 989 scenes of 100% ice cover or ice-free conditions. An accuracy of 86.3% was achieved on the last year of data (134 scenes) which was kept out of the training process to test the model on an independent dataset. A better accuracy is obtained at lower incidence angles and the HH polarization provides the most information to classify ice from water. To achieve the best accuracy, the incidence angle and the noise equivalent sigma-nought had to be included as input to the model. A comparison done with the ASI passive microwave product shows similar errors in total sea ice concentration when using the Canadian Ice Service regional charts as reference. Nonetheless, errors from both datasets differ and the CNN outputs show greater potential to reduce masked areas, given the better spatial resolution, enabling data classification closer to land and identify features not captured by the ASI dataset.
RÉSUMÉ
L'amplification arctique a eu de nombreux impacts sur l‘étendue, l‘épaisseur et le flux de la glace de mer. Il devient critique de surveiller les conditions des glaces de mer à une résolution spatio-temporelle plus fine. Nous avons utilisé un simple réseau neuronal convolutif (CNN) sur l‘archive ScanSAR à double polarization RADARSAT-2 disponible sur le golfe du Couronnement, Canada, pour évaluer quels paramètres RSO amèliorent les performances du modèle pour séparer la glace de mer de l‘eau sur un grand volume de données couvrant 11 ans. Une précision globale de 90,1% a été obtenue sur 989 scènes de couverture de glace à 100% ou de conditions sans glace. Une précision de 86,3% a été obtenue sur la dernière année de données (134 scènes) qui a été tenue à l‘écart du processus d’entraînement pour tester le modèle sur un ensemble de données indépendant. Une meilleure précision est obtenue à des angles d‘incidence plus faibles et la polarisation HH fournit le plus d‘informations pour distinguer la glace de l‘eau. Pour obtenir la meilleure précision, l‘angle d‘incidence et l‘équivalent de bruit sigma-zéro ont dû être inclus comme intrants au modèle. Une comparaison avec le produit de concentration de glace de mer ASI dérivées des micro-ondes passives montre des erreurs similaires dans la concentration totale de glace de mer lors de l‘utilisation des cartes régionales du Service canadien des glaces comme référence. Néanmoins, les erreurs des deux ensembles de données diffèrent et les sorties CNN montrent un plus grand potentiel pour réduire les zones masquées, pour permettre une classification des glaces plus proche de la terre ferme et identifier des caractéristiques non prises en compte par les produits ASI.
Introduction
Arctic air temperatures have been rising twice as fast as the global average (Meredith et al. Citation2019; Richter-Menge et al. Citation2017; Notz and Stroeve Citation2016) and projections indicate further warming in the Arctic (Overland et al. Citation2019). This is especially true in the Canadian Arctic where observed air temperatures increases are 3 times higher than the global average (Bush and Lemmen Citation2019). With this rapid increase in air temperatures, major changes in Arctic sea-ice extent, thickness and flux have been reported (Derksen et al. Citation2019; Howell and Brady Citation2019; Mudryk et al. Citation2018; Tivy et al. Citation2011). Maximum sea ice extent is decreasing, greater multi-year ice (MYI) fluxes has been measured from the Arctic Ocean to the Canadian Arctic Archipelago (CAA) and less seasonal ice survives a summer melt season (Howell et al. Citation2023; Howell et al. Citation2015; AMAP Citation2017). Arctic ice-free conditions scenarios are becoming more probable even under global temperature rise of 2 °C (Screen Citation2018; Sigmond et al. Citation2018). Attention has been given toward the maximum and minimum extents of sea ice in summer but ice conditions throughout the winter season has seen extensive changes over the last decades (Notz and Stroeve Citation2016). These responses of the sea ice to warmer temperatures all year round have major impacts on the climate, ecosystems, communities, wildlife, and the economy in the Arctic (Huntington et al. Citation2022).
Currently, sea-ice charting produced by national ice centers relies mainly on manual digitization of sea-ice features such as concentration, stage of development (proxy for thickness categories) and floe size (Tivy et al. Citation2011) interpreted visually by trained experts. The main objective of these charts is to facilitate shipping activity, including icebreaking in ice-infested waters. This implies that the main charted areas are around known shipping routes. Dawson et al. (Citation2018) have shown that shipping activity has increased in the CAA since the 1990s due to later freeze-up and earlier break-up of the sea ice, extending the period where ships can navigate these waters. With the current climate projections, other routes will open (Mudryk et al. Citation2021). This poses a challenge for national ice services who will require additional resources to analyze data over a large area and for longer periods of the year. Even though reports say that sea-ice extent and thickness is reducing, sea-ice conditions must still be considered severe and be closely monitored (Haas and Howell Citation2015) especially in the CAA where more hazardous ice like MYI floes have been seen (Howell et al. Citation2015), sometimes even exceeding the outflow of MYI from Nares Strait (Howell et al. Citation2023).
Though less sea ice might have positive impacts on Arctic economy (Melia et al. Citation2016), it is having negative impacts on Arctic wildlife like sea birds (Wong et al. Citation2018), polar bears (Florko et al. Citation2020), caribou (Environment and Climate Change Canada Citation2021) and narwhals (Hauser et al. Citation2018). While daily and on-demand higher-resolution charts are produced by the ice services, they are limited to areas with active shipping. These products are not designed for wildlife habitat monitoring. For large scale and long-term studies, they can prove useful but for local scale and short-term monitoring, the spatial and temporal resolution of these products are not adapted to link the sea-ice conditions to wildlife behaviors.
Other products such as passive microwave remote sensing products achieve up to daily temporal resolution and up to 3.125 km spatial resolution (Beitsch et al. Citation2014). The spatial resolution is more applicable to wildlife habitat monitoring and the temporal resolution is very suitable for such studies. Nonetheless, passive microwave products are known to have many limitations like; melt ponds detected as water, thin ice seen as reduced concentration and require atmospheric corrections (Ivanova et al. Citation2015, Spreen et al. Citation2008).
National ice services like the Canadian Ice Service (CIS) of Environment and Climate Change Canada (ECCC) use synthetic aperture radar (SAR) satellite imagery as their main source of data to generate ice charts. C-band SAR data was chosen for the Canadian RADARSAT program for its ability to provide contrast between the different ice types and water but also its ability to see through clouds and be independent of lighting conditions since it has its own illumination source (Parashar et al. Citation1993). SAR data provide higher resolution imagery at a lower spatio-temporal coverage compared to passive microwave products, but they are less affected by atmospheric conditions (Joshi et al. Citation2016). For example, the pixel spacing of 50 m of the ScanSAR mode of RADARSAT-2 provides higher resolution data. Currently, CIS uses imagery from the Radarsat Constellation Mission (RCM) as its main source of SAR data to produce ice charts. With the multiplication of C-band SAR data like Sentinel-1 and the recently launched RCM, more data is made available, improving the spatial and temporal coverage of SAR data, enabling daily coverage over many areas. While the regional ice charts serve as a weekly snapshot of ice conditions, to serve as a basis for establishing the World Meteorological Organization (WMO) mandated sea-ice climatology and sea ice normals, the daily and on-demand ice charts only target areas with active shipping, at finer scales. Though this provides a rich database of information, it is often not sufficient for other applications such as sea ice safety monitoring for northern communities and wildlife habitat.
Recently, many studies have shown the potential of using machine learning algorithms with the large volume of C-band SAR data available to map sea ice conditions. Zakhvatkina et al. (Citation2019a) published an overview of the different machine learning techniques that were developed since the 90s to map sea ice conditions using SAR data since the launch of the European Remote Sensing Satellite −1 (ERS-1). More recently, focus was given to deep learning algorithms like convolutional neural networks to produce many of the variables included in ice charts (Stokholm et al. Citation2022; Radhakrishnan et al. Citation2021; Zakhvatkina et al. Citation2019b; Wang and Li Citation2021; Wang et al. Citation2016). These studies have shown that using CNN on dual-polarized RADARSAT-2 (RSAT-2) and/or Sentinel-1 (S-1) provides comparable results to other products in terms of sea-ice concentration (SIC) such as the ones derived from Multisensor Snow and Ice Mapping System (Wang and Li Citation2021) and the Danish Meteorological Institute (Stokholm et al. Citation2022). Some studies combined passive and active microwave imagery to produce SIC that perform better than the Arctic Radiation and Turbulence Interaction Study (ARTIST) Sea Ice (ASI) and the NASA team 2 (NT2) products (Radhakrishnan et al. Citation2021).
This study uses a similar CNN architecture implemented by Wang et al. (Citation2016) on the dual-polarized RSAT-2 image archive available over the marine region of Coronation Gulf, Canada. The focus of this study, compared to other similar studies, is to identify which component of the SAR imagery, e.g., which polarization or static feature like incidence angle or antenna noise profile, improves model accuracy using more than a decade of sea-ice and water observations. The study area, data used, and model will be presented in the method section and model accuracies and image parameterization will be discussed in the results section. A comparison with existing SIC products will also be presented in the latter section to discuss how the use of an ice/water classification produced from a simple CNN can be useful for applications beyond shipping.
Method
This section describes the study area, the reasoning behind its selection for this study, how the training data was selected and how the CNN model was developed.
Study area
The region of interest for this study is Coronation Gulf (CG) in the Canadian Arctic Archipelago. This area is situated between Victoria Island and mainland Nunavut in Canada and is considered part of the North-West Passage shipping route (). According to CIS weekly regional charts (, ), the area is completely covered in land fast ice for many months in the winter and is completely ice free for many months in the summer. Not having to segment selected imagery due to their simple ice conditions (ice free and fully ice covered) facilitated data selection.
Figure 1. Coronation Gulf marine region (red polygon), Nunavut, Canada. The image is a RSAT-2 dual-polarized (RGB: HH-HH-HV) ScanSAR Wide image acquired 2010-04-26 00:42:04 UTC.
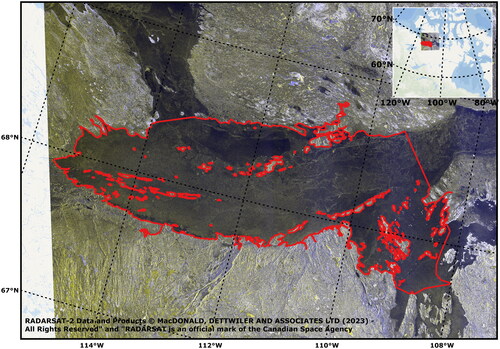
Figure 2. Example of a CIS weekly ice chart of Canadian Western Arctic. Full ice coverage (10 tenths) is shown in (a) (October 18, 2010) and ice free (0 tenths) is shown in (b) (August 16, 2010). Red rectangles highlight the Coronation Gulf marine region.
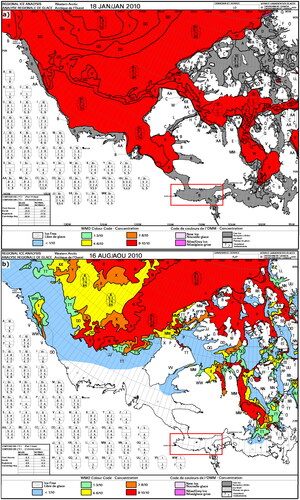
Table 1. Sampling periods for full ice coverage (10/10 landfast ice) and ice-free conditions.
Data sets
The CNN was trained to classify sea ice from water, using RSAT-2 ScanSAR data acquired from 2008 to 2020 (). The selection of the training and validation data as well as their labels, i.e., ice or water, was done using the CIS regional ice charts () available on the CIS website (https://iceweb1.cis.ec.gc.ca/Archive/page1.xhtml?lang=en). The CIS regional charts were also used as reference to compare SIC outputs from the CNN model and the Arctic Radiation and Turbulence Interaction Study (ARTIST) Sea Ice (ASI) algorithm (Spreen et al. Citation2008), for CG between 2008 and 2020, to assess the potential of the CNN model to derive SIC in different ice-cover conditions than the ones it was trained on.
Table 2. Number of RSAT-2 SCWA scenes available per class per year.
Canadian ice service charts
Mainly for climatology, the CIS publishes weekly ice charts, valid every Monday, covering large regions of Canada: Western Arctic, Eastern Arctic, Hudson Bay, East Coast and Great Lakes (Tivy et al. Citation2011). shows an example of a regional chart of the Canadian Western Arctic. The ice concentrations, types and floe sizes are expressed in the egg code (Cheng et al. Citation2020; Tivy et al. Citation2011). This code can also be expressed in the WMO Sea Ice GRID (SIGRID) format (IICWG: SIGRID-3 Citation2014).
These charts were used to determine the periods when CG was fully covered in land fast ice (10/10 ice concentration) and when it was ice free (0/10 ice concentration). shows the start and end dates of each year from which the RSAT-2 scenes were selected. The year indicated in correspond to the end of ice season, e.g., ice free period for 2010 started in the summer of 2009 and the ice cover period started in 2009 and ended in 2010. A 2-week buffer was used for the imagery selection, i.e., 2 weeks after full freeze-up (start of 10/10 ice concentration for all of CG) and 2 weeks before ice break-up for the full ice cover and idem for the ice-free periods; to ensure pure ice only and water only image samples. This accelerated the labeling process of the image samples since they did not require manual inspection to determine which belonged to the ice and water classes.
The CIS does produce ice analyses from single SAR images (Cheng et al. Citation2020) but since their main focus is charting high traffic areas (Canadian Ice Service Citation2015) and not many ships travel in the Coronation Gulf in months where it is not ice-free (Mudryk et al. Citation2021; Dawson et al. Citation2018) not many image analyses are available for the study area, hence the use of the weekly regional charts for this study.
RADARSAT-2
RSAT-2 is an operational Canadian C-band SAR launched on December 14, 2007. Since then, the Radarsat Constellation Mission (RCM) was launched in June 2019 and the Government of Canada (GoC) has transitioned to RCM in 2020 as its primary source of C-band SAR data. This is why the available data for this study spans from the early days of RSAT-2 (2008) to the transition time of the GoC to RCM (2020) even though RSAT-2 is still operational.
Though RSAT-2 has many beam modes available comprising of different viewing geometries, polarizations, spatial resolutions and swath widths, this study focuses on the ScanSAR wide (SCWA) beam mode which is the most used beam mode by the CIS to map sea ice conditions and is the most abundant data type available of the RSAT-2 data archive accessible over sea ice.
Incidence angles of the SCWA beam mode vary from 19° in the near range to 49° in the far range of the image. Signal intensity of both sea ice and water are highly dependent on incidence angle (Dierking Citation2013). This can prove challenging and many techniques to normalize signal intensity have been developed (Stokholm et al. Citation2022; Mahmud et al. Citation2018; Zakhvatkina et al. Citation2017). Influence of incidence angle on CNN accuracy will be shown.
ScanSAR modes of RSAT-2 only allow dual or single polarization acquisition. In dual polarization, 1 polarization is transmitted (H or V) and both are received, e.g., HH and HV for H transmitted and VV and VH for V transmitted.
The pixel spacing of a SCWA scene is of 50 m. To assess the potential of CNNs to be used for other applications than shipping, each scene was divided into chips of 20 × 20 pixels, without overlap, to achieve a 1-km output resolution (Henderson et al. Citation2021). Given the presence of small islands in CG and the exclusion of samples containing land pixels in them for this study, the sample size was chosen in order to avoid masking large portions of CG from the analysis. Each chip includes 4 bands. One band per polarization (HH and HV), a third one for incidence angle and one for the noise equivalent sigma-nought (NESZ). Both incidence angle and NESZ layers are interpolated across the range of the image from a reduced number of samples (i.e., 2 and 100 values for angle and NESZ respectively) provided in the image product metadata. The impact of each band on the CNN accuracy will be discussed.
The 2 polarization bands were calibrated using the sigma-nought (σ0) look-up table (LUT). The other 2 calibration LUTs, gamma-nought (γ0) and beta-nought (β0) were tested and model accuracies using the different LUTs are presented.
Training, validation, and testing datasets
To cover as many ice and water conditions and SAR parameters, 1,123 ScanSAR scenes were selected between August 21, 2009 and July 16, 2020 (). A total of 586 scenes were selected during the full ice-covered periods and 537 scenes for the ice-free periods. Of those, the last year of data (2019–2020, 45 and 89 scenes for the ice and water classes respectively) was selected to test the model performance and were not included in the training/validation of the CNN model to test it on an independent dataset. The 989 scenes used to generate the CNN model, a total of 12 749 697 chips, were split 70/30 between training and validation of the model. To this training set, 1,010 scenes were added for SIC comparison analysis where mixed ice/water conditions was present according to the CIS regional charts. The 2-week buffer periods described in the previous section were included in these 1,010 scenes to have a continuous time series over the studied period. gives the distribution of available scenes per year and class.
The distribution of the training/validation image chips gives a class ratio (ρ) of 1.38 larger for the ice class which can be considered as a balanced training dataset especially with such a large number of samples (Buda et al. Citation2018). To reduce any influence from spatio-temporal autocorrelation between image chips, all training/validation chips were randomly shuffled before being used as inputs to train the CNN. The final pre-processing applied to all layers of the chips was image normalization, to improve the mode training accuracy and efficiency (Ioffe and Szegedy Citation2015):
(1)
(1)
Where is the normalized pixel value, Ii the pixel value,
and
the mean and standard deviation respectively of all chips and classes of the training/validation dataset for a given band i.
Any duplicate RSAT-2 image products were discarded to keep 1 single image for a given acquisition. No overlap between the image chips was created. For the training/validation datasets, the edges of the images that did not have 20 × 20 pixels and chips with land and/or no data pixels were excluded.
Convolutional neural network
The convolutional neural network (CNN) used in this study is very similar to the one developed by Wang et al. (Citation2016). The CNN was chosen for this study since, like trained human analysts, the algorithm is trained to recognize spatial patterns and features of specific targets at different spatial scales (LeCun et al. Citation1999). For sea-ice mapping, unlike expert analysts, the CNN used here does not include temporal information of past ice conditions or auxiliary data such as weather and climatology information or other sources of earth observation data. This is done willingly to determine the SAR data parameterization that affects the performance of a CNN to detect sea ice from water using a single SAR image.
The CNN model was coded in Python 3.6 using Keras 1.0.8 library of Tensorflow 2.0.0 (Abadi et al. Citation2015). shows the architecture of the CNN used. The effective spatial resolutions are given in brackets in . The CNN has 2 convolution layers using 128 different filters in a 5 × 5 sliding window. Both layers are followed by a max pooling layer using a 2 × 2 sliding window to reduce the dimensionality. The fully connected layers (FCLs) were added, the first having 1,024 nodes, the second 128 nodes and the last, a single node for the binary output probability. All layers except the pooling layers require an activation function. The rectified linear unit (ReLU) function was selected for all layers except the last FCL. This function removes negative values by setting them to zero and is a good compromise between computation efficiency and overall generalization accuracy (Krizhevsky et al. Citation2012). This is the most commonly used activation function in recent sea-ice classification studies using a CNN (Stokholm et al. Citation2022; Wang et al. Citation2016). To ensure a smoother, monotonic, and continuous output probability of the CNN, the sigmoid function was used in the last FCL (Han and Moraga Citation1995). The values of a sigmoid function range from 0 to 1 with a smooth S-shape transition between the 2 extremes making it a good option for a binary classification like the one presented here.
Table 3. Architecture of the convolutional neural network used.
The output of the CNN corresponds to the probability of the image chip to be water (Pwater) and its inverse, the probability of the chip to be sea ice (Pice):
(2)
(2)
(3)
(3)
Given the large number of chips to classify (12 749 697), a 70/30 split was used in the available data for model training and validation respectively. In order to avoid overfitting individual nodes of the first 2 FCLs, 10% of the nodes were randomly dropped at every training iteration (epoch) (Tompson et al. Citation2015). The stochastic gradient method using the binary cross-entropy was used for its algorithm stability (Hardt et al. Citation2016). To improve the model training accuracy and efficiency, an adaptive learning rate was used, and the training was also forced to stop if no significant change was observed in the validation accuracy after 10 epochs (Bengio Citation2012). The learning rate was reduced by 30% after 5 epochs if the training accuracy of the model did not improve by more than 3%. Finally, the metric used to monitor the improvement of the mode for each epoch was the accuracy metric (Acc):
(4)
(4)
(5)
(5)
Where TPi is the total number of true positives for a given class i, i.e., where the probability of class i (EquationEquations 2(2)
(2) and Equation3
(3)
(3) ) is greater than 0.5 and N the total number of chips classified. Since the objective of this study was not to obtain the best model to classify ice from water, model output probabilities were not calibrated, and the simple 50/50 cutoff threshold was used to classify ice from water (Guo et al. Citation2017).
To assess the impact of each of the SAR bands, CNN models for the 2 main channels (HH and HV) were generated individually and together. Models were also generated for the different band combinations where HH and/or HV is always included. Results of the CNN models performance will be discussed in the results section.
Results
In this section, the results from exploring a big dataset of 1,123 RSAT-2 images will be shown and general relationships between target backscattering and sensor properties will be presented. CNN model training and validation results will be shown and its performance in relationship with the SAR parameters for each class will be presented. Finally, a comparison between 3 sea-ice products will be presented to assess the potential of a simple CNN, like the one presented here, to estimate SIC for a larger marine region like CG over a period of more than a decade.
Big data distribution analysis
Given the large dataset used in this study, it is important to assess the distribution of the dataset with the different imaging parameters. shows box plot distributions of the σ0 intensity for bins of 1° of incidence angle of the HH polarization for ice (green) and water (blue) classes. The orange line within the box corresponds to the median value of the distribution. The box edges correspond to the lower and upper quartiles of the distribution and the whiskers correspond to the 5th and 95th percentiles of the distribution. The NESZ curve is shown in to give a sense of the signal to noise ratio of the backscattered signal.
Figure 3. Backscatter intensity (σ0) distribution per degree of incidence angle for the HH channel. Orange line is the median, boxes correspond to the 1st and 3rd quartile and whiskers represent the 5th and 95th percentile. Red line corresponds to the ScanSAR noise floor (NESZ).
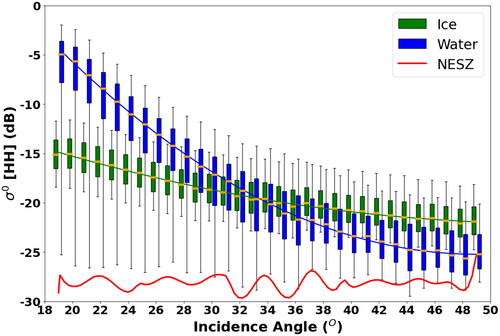
Relationships between the backscattered signal of the HH polarization and the incidence angle for both classes are also shown in and are obtained with EquationEquations (6)(6)
(6) and Equation(7)
(7)
(7) . Coefficient of determination between the median values and the incidence angles of R2 = 0.995 and R2 = 0.999 were obtained for the ice and water classes respectively. Given the selected periods for the full-ice coverage over CG (), this relationship only applies to thicker sea ice where the thinnest ice type recorded by CIS regional charts is thin FYI (30–70 cm). Also, CG has seen very little MYI in the studied period. This means EquationEquation (6)
(6)
(6) is only applicable to SAR normalization of FYI. Similarly, with the bottom whiskers being dependent on NESZ for the water class (), this means that EquationEquation (7)
(7)
(7) is only applicable to the specific beam mode of RSAT-2 used in this study. also shows that the ice signal has less of a slope with incidence angle compared to water meaning the backscatter from a water surface is less sensitive with incidence angle.
(6)
(6)
(7)
(7)
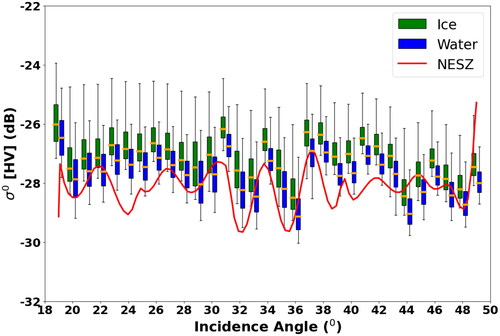
shows the same boxplot distribution per degree of incidence angle as but for the HV polarization. NESZ is also shown in to show that since the backscattered signal is very low for the HV polarization, the intensity follows an incidence angle dependency close to the NESZ. This is why no relationship similar to the HH polarization () could be obtained. Correlation coefficients of R2 = 0.164 and 0.166 were obtained between the HV and NESZ signals for the ice and water classes respectively. This shows that even though the 2 signals have similar dependencies with incidence angles, they are not correlated. It should be noted that the NESZ curve is an interpolation of 100 values dispersed over more than 10 000 pixels in range. It may thus not represent the exact NESZ curve, thus explains why parts of the distributions are below the noise floor. This was also noted by previous studies where the backscattering values in the cross-polarized channels were close to the noise floor (Aldenhoff et al. Citation2020).
Figure 4. Backscatter intensity (σ0) distribution per degree of incidence angle for the HV channel. Orange line is the median, boxes correspond to the 1st and 3rd quartile and whiskers represent the 5th and 95th percentile. Red line corresponds to the ScanSAR noise floor (NESZ).
CNN training and validation
shows the evolution of the binary cross-entropy loss function and CNN model accuracy for each epoch. The model was optimized through backpropagation and the performance was assessed using the validation dataset. Training stopped after 60 epochs since there were no improvement in the validation accuracy between epochs 50 to 60 even though training accuracy was still rising. This forced stop prevented the model to be overfitted on the training dataset. An overall accuracy of 91.1% and 90.1% were achieved for training and validation datasets respectively ().
Figure 5. Convolutional neural network training and validation accuracy and binary cross-entropy loss function for each training epoch for the 4-bands input model ().
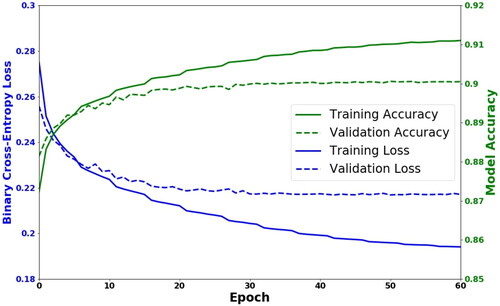
Table 4. Training and validation accuracies based on SAR input parameterization and different input layers.
RADARSAT-2 parameterization accuracies
With the trained CNN model using all 4 bands, the entire training/validation dataset was classified, and shows the prediction distributions per class for each degree of incidence angle.
Figure 6. 4-band input model () predictions distribution per incidence angle. Orange line is the median, boxes correspond to the 1st and 3rd quartile and whiskers represent the 5th and 95th percentile.
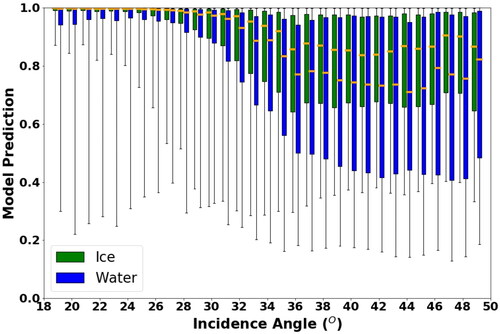
From , we see that for all the incidence angle range, the CNN performs better for the ice class compared to the water class. The median values are higher, and the distribution is less spread for the ice class. Better prediction accuracy is observed at lower incidence angles. To see the impacts of the other SAR image bands on the model accuracy, shows the accuracies and losses for the different SAR parameterizations for the same training and validation datasets.
Results show that the calibration between σ0, β0 and γ0 does not have any impact on the CNN results. This is to be expected since over marine regions, there is no terrain compared to high topography on land, resulting in a uniform geometry. For all the other channel combinations, a McNemar test (Iban and Sekertekin Citation2022; Fang et al. Citation2020; McNemar Citation1947) was conducted with the 4-band model as reference, to see if the reduced number of errors in the 4-channel model were statistically significant. The results (statistics not shown in ) suggest that the accuracy improvements are statistically significant with p-values < 0.01. The channel giving the best results alone between the 2 SAR polarizations is the HH channel compared to the HV channel. Nonetheless, with a validation accuracy of 0.693 (), this indicates that there is significant information provided by the cross-polarization channel. This is also shown with the 6.5% increase in the validation accuracy when combining the 2 polarizations compared to HH alone, knowing that the improved accuracy is statistically significant with a p-value < 0.01 of the McNemar test.
Adding the incidence angle information to the single polarization channels slightly improves the validation accuracy of the HH model but has a more significant impact on the HV model with a 10.1% increase in validation accuracy. Likewise, adding the NESZ information to HH and HV, rather than the incidence angle has a similar impact on the model accuracy but with a lesser impact on both polarizations.
Combining the incidence angle information and the NESZ to the single bands does provide better results indicating that both layers provide useful information to the model predictions. When combining both polarizations to either the incidence angle or NESZ, similar validation accuracies were obtained.
All RSAT-2 data acquired for the year 2020 was kept out of the training/validation exercise to test the model accuracy on a completely independent dataset and independent target properties. shows the results of all datasets overall and for each class independently.
Table 5. CNN training, validation and overall accuracies for ice and water classes independently and combined for the 4-input layer model ().
The model did not perform as well for the test dataset but still provided good accuracy considering the large dataset used to train the model. The accuracy is similar to what other studies using deep learning models have demonstrated, ranging from 80 to 95%, depending on the data used and the number of classes classified (Stokholm et al. Citation2022; Radhakrishnan et al. Citation2021; Zakhvatkina et al. Citation2019a). As shown in , it is clear that there is more confusion for the water class resulting in a lower overall accuracy for the test dataset.
Comparing SIC over the RADARSAT-2 archive
In this section, the outputs of the 4-bands CNN model () will be visually analyzed against a cloud free Moderate Resolution Imaging Spectroradiometer (MODIS) image in order to clearly identify ice and water and compared to other sea-ice products to determine the potential of such a simple CNN to be applied to other applications than navigation.
shows a visual output of the CIS regional chart (7a), the ASI SIC concentration product (7b), a true color composite of MODIS (7c), a RSAT-2 HH-HV-HV RGB color-composite image (7d) and the output of the CNN model from 4 bands of the image (7e). All products are from July 13, 2020, except for the MODIS image, which was acquired July 14, 2020, because of cloud cover. For the purpose of discussion, shows the CNN predictions of the 1 km2 chips. Since the model was trained on chips of pure classes (ice or water), the 50/50 threshold on the uncalibrated CNN prediction output was used to determine if the chip was ice or water and then used for SIC calculations ( and ).
Figure 7. (a) CIS regional chart valid July 13, 2020; (b) ASI SIC product of July 13, 2020; (c) MODIS Terra image of July 14; (d) RSAT-2 RGB: HH-HV-HV composite image of July 13,2020; and (e) CNN model output for July 13, 2020.
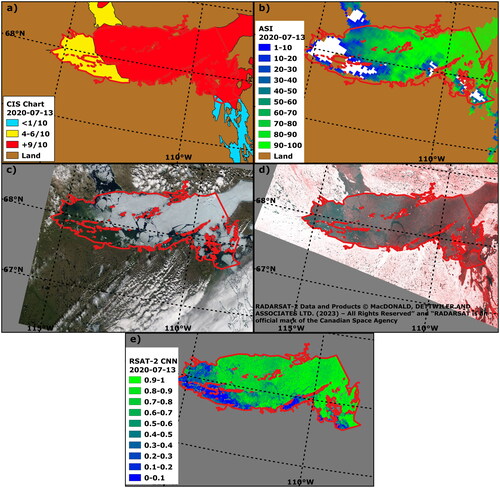
Figure 8. Timeseries of weekly SIC for all of Coronation Gulf from the CIS regional charts, ASI passive microwave product and output of the RSAT-2 images using the 4-band input CNN model. The values are valid on the Monday for each week. The ASI and RSAT-2 products consist of weekly pixel average.
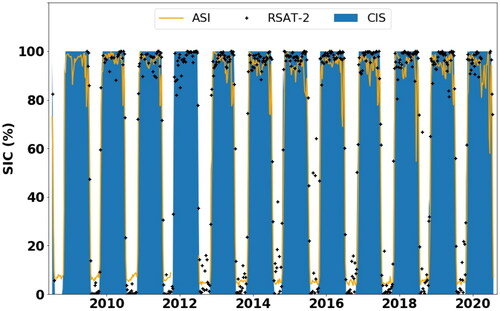
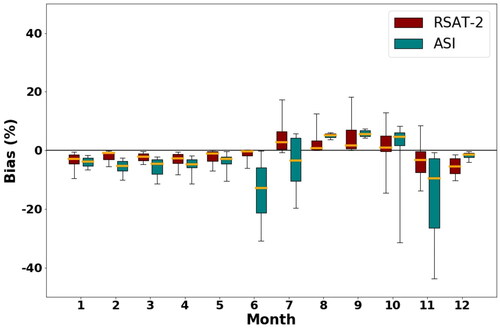
Figure 9. Box plot of the weekly SIC biases from for each month for the entire time series. The CIS charts were taken as reference for the bias calculation.
The CIS chart presents a more generalized overview of the SIC in CG and the other products provide more details on the ice features present in CG. The MODIS imagery shows some larger portions of CG seem to be open water which is only captured by lower ice concentration polygons or absorbed by larger surrounding polygons due to the inherent limitations of the CIS product. Since the main source of imagery of this chart is RSAT-2 products, it is worthwhile to look at and it is clear that some open water areas are very difficult to distinguish from the main ice pack, e.g., the southeastern shore of CG. The CNN model does pick up open water in that area with a very good prediction probability (>80%). Also, where there are leads in the main close pack ice, the CNN predictions are between 30% and 50% of being water.
The ASI SIC product shows a gradual decrease of the SIC westward which tends to follow the change in ice concentration of the CIS chart. Since this product has a resolution of 6.25 km, there is often a mix of ice and water in that footprint as well as melt ponds on the surface of the sea ice which can have an impact on its accuracy (Spreen et al. Citation2008). We also see in this example that shallow areas with a higher density of small islands are considered as land, e.g., southwestern part of CG. There is some data loss (white areas) probably due to atmospheric effects, cloud cover and wind roughened open water (Spreen et al. Citation2008). ASI products are also known to be problematic in marginal ice zones (Radhakrishnan et al. Citation2021).
shows the weekly SIC time series over the GoC RSAT-2 data archive period. The CIS regional charts are used as reference and the ASI and RSAT-2 SIC products are compared. It should be noted that the CIS charts report SIC in tenths and were converted in increments of 10% for comparison with other products. The average SIC and CNN prediction probability over each pixel was first calculated for all ASI and RSAT-2 output respectively for a given week. The average SIC of the pixel averaged ASI product is then taken for all pixels comprised in the CG AOI to compute the weekly SIC since all pixels have the same footprint. For the RSAT-2, number of pixels having a lower averaged prediction probability of 0.5 is divided by the total number of pixels comprised in CG and used to calculate the RSAT-2 SIC.
A first observation is that the SIC for the ASI product never drops to 0% during summer where we know from the CIS charts that CG is ice free for many months in the summer. As for the RSAT-2 product, it seems that the larger errors occur in the ice-free period compared to the full ice cover period. For both products, there is some differences observed with the charts during the freeze-up and melt periods.
shows the distributions of the weekly SIC bias for a given month for both ASI and RSAT-2 outputs. Overall, the RSAT-2 output has a lower median monthly bias and a narrower spread distribution. Only for the month of December is the median monthly bias lower and less dispersed for the ASI output. During the summer months, the ASI output biases are less dispersed than the RSAT-2 output but the median values are still higher which is due to the less variable summer SIC values that never reach 0% (). Though the distributions are slightly better during the winter months for the RSAT-2 output, both outputs seem to provide similar errors.
Overall, a mean bias of −4.0% and −0.4% and an RMSE of 10.8% and 8.4% for the ASI and RSAT-2 products respectively were achieved when compared to the CIS charts.
Discussion
Big data distribution analysis
With the big data available for this study, the reported incidence angle dependencies of the HH signal were confirmed (Aldenhoff et al. Citation2020; Komarov and Buehner Citation2019; Mahmud et al. Citation2018; Mäkynen and Karvonen Citation2017; Pogson et al. Citation2017). These studies reported ranges from −0.40 dB/1° in the near range to −0.05 dB/1° in the far range which are captured by EquationEquations (6)(6)
(6) and Equation(7)
(7)
(7) . Another relationship confirmed from and was the lower sensitivity of sea ice to incidence angle compared to water. This is due to ice being “radar rough” at the C-band wavelength scale, i.e., its surface root-mean-square height is higher than one-eighth of the sensor’s wavelength (5.5 cm/8 = 0.7 cm) thus scattering part of the radar incident signal in all directions (Lillesand and Kiefer, Citation1994). The HH response over water is mainly dependent on wind speeds (Hersbach Citation2010) which explain the larger spread of the data. This sensitivity to wind speeds is considerably reduced with higher incidence angles where reduced variability in the distributions is observed. It should be noted that the bottom whiskers are linked to the NESZ and are most likely associated to backscatter values for water surfaces with calm winds where specular scattering is dominant. The slope is most likely dependent on the prevailing winds over the studied area and thus EquationEquation (7)
(7)
(7) might not be applicable to other studied areas.
Looking at , we see that only the whiskers overlap at low (<25°) incidence angles. This indicates that the 2 classes are more separable, during the studied period, in the near range than higher incidence angles with machine learning algorithms. This is also reflected in where the uncalibrated output class probabilities are mostly concentrated around 1. There is also less overlap between the distributions at the higher angles (>45°), but this is not reflected by higher confidence in the output class probabilities of . Nonetheless, this aligns with observations made by Geldsetzer et al. (Citation2015) where better class separability between FYI and water was obtained at low and high incidence angles for C-band compact polarimetry SAR data.
shows that the median values of σ0HV are higher for ice than water for all incidence angle which is expected since there is more volume scattering coming from the sea ice where the water is mostly affected by specular reflection and Bragg scattering (Geldsetzer et al. Citation2019). Similar to the HH signal over water, the HV signal is mainly dependent on wind speeds, but would only exceed the NESZ under strong wind conditions (Vachon and Wolfe Citation2010). The observed relationship over water is also dependent on the prevalent winds over the studied area. Even though shows that the median HV values are close to the NESZ, there is still valuable information that could help improve class predictability when combined to the HH polarization information (). Noise subtraction was not used in this study since, as mentioned above, the NESZ is an interpolation and can lead to negative intensity values in linear units. This can also lead to some artifacts at the beam edges as reported by Zakhvatkina et al (Citation2017). In doing so, the pre-processing computation time is considerably reduced while retaining the improved model performances by simply adding the information as inputs to the model.
CNN training and validation
As mentioned before, this study did not focus on getting the best model output possible but rather understanding which SAR parameter improved model performances. This is why the simpler CNN architecture proposed by Wang et al., (Citation2016) was chosen to reduce computation needs and improve understanding of model behaviors with the different configurations. Nonetheless, many recent studies have shown that different CNN architectures like U-Nets (Stokholm et al. Citation2022; Radhakrishnan et al. Citation2021) are very suitable and provide better results in classifying sea ice when comparing with national ice services products.
Also, some intermediate steps in CNN architectures, like batch normalization, can prove very useful in improving efficiency and accuracy of the model (Ioffe and Szegedy Citation2015). Finally, even though the model outputs and accuracy shown in and provide relatively good results to classify ice from water, adding an extra step in calibrating the output probabilities could improve the overall model performance (Guo et al. Citation2017).
To assess if the model was overfitted on the training dataset, the force stop condition was tested at a more conservative value of 3 epochs with no improvement in the validation accuracy. Accuracies on the test dataset were the same () with this more conservative constraint showing it did not have an impact on model performances.
To assess whether the lower test accuracy was dependent on the selected year, training and testing were performed with 2 different configurations. The second configuration tested was trained on all years except 2011, where it kept for testing. The third configuration was trained on all years except 2014. The 2 years were selected randomly to avoid any potential human bias. For all configurations, training accuracies were the same, i.e., 0.901 (). Interestingly though, test years provided very different accuracies. 2011 had accuracies of 0.943, 0.771 and, 0.888 for the ice, water, and overall classes respectively. 2014 had accuracies of 0.917, 0.893 and, 0.906 for the ice, water, and overall classes respectively. This indicates that the training/validation of the model is not as sensitive to the selected years when sufficiently large volumes of data is provided. Test results do show that the overall accuracy of the tests is highly dependent on the selected year and can be variable as shown in . This supports that to achieve greater and more robust models, auxiliary data is needed to support the SAR data.
RADARSAT-2 parameterization accuracies
Comparing the different model configurations (), we see little improvement in model performances in adding the incidence angle or the NESZ information to the HH backscatter signal. This can be explained by the fact that, both classes have strong relationships with incidence angle (EquationEquations 6(6)
(6) and Equation7
(7)
(7) ) meaning the incidence angle is included in the σ0 information and the model picks up those relationships without requiring the static layer. This behavior was also reported by Wang et al. (Citation2016). For the NESZ, the strong signal-to-noise ratio of the HH channel for both classes indicates that the signal is not sensitive to the noise floor. There is thus no additional information to be gained from the model to include this static layer when having only the HH channel.
This is not the case with HV. As shown in , the distributions greatly overlap for different incidence angles. Adding the angle information improves the confidence to identify the classes based on the distribution differences for a given angle and not for the entire dataset. Also, the HV signal follows closely the NESZ and similarly to incidence angle, identical NESZ values for 2 different incidence angles can be obtain. This can bring confusion in the CNN prediction and is reflected in the improved model performances when adding NESZ to the HV channel (). Since NESZ and incidence angle are uncorrelated, adding both static layers reduce model confusion and improve overall model performance. To reduce computation costs, one could consider dropping one of the 2 static channels at the cost of lower model accuracy.
Comparing SIC over the RADARSAT-2 archive
shows how different products are meant for specific applications with their respective strengths and weaknesses. For example, since the CIS chart is a climatology product, the finer details like fractures and leads in the ice are not captured. Open water areas are often amalgamated with bigger neighboring polygons with a lower total SIC. This is to be expected since the scale of the product is coarse, and its intended application does not focus on these smaller features. Similarly, with the given spatial resolution of the ASI product, such small features are not captured. The ASI does show some small open water areas the CIS chart does not. Nonetheless, these products, when studied over several decades, have proven useful for polar bear habitat monitoring in the Hudson Bay, Canada (Castro De La Guardia et al. Citation2017) and long-term climate change studies (Liu et al. Citation2021).
The CNN model presented here, with its basic architecture, shows that it has the potential to capture small features such as leads and fractures (). Even with the uncalibrated model outputs, these features are captured as water in . By calibrating the outputs or by adapting the calibration to a specific application, the model classification could be adapted to be more sensitive to a specific class, i.e., ice or water in this case. This shows good potential for different applications requiring higher spatio-temporal information such as wildlife-habitat behavior studies (Henderson et al. Citation2021) or for community safety which rely on safe ice conditions at a very fine resolution to travel, hunt and fish (van Luijk et al. Citation2022). The CNN output could also help expert analysts improve charting for climatology and shipping purposes by acting as an automated first guess of the input SAR imagery.
When looking at the time series analysis (), both the ASI and RSAT-2 products have higher errors during the summer period. This is reflected, for the RSAT-2 product, in the lower model performances for the water class () and can be explained by the larger backscatter distribution of both polarization ( and ) and their dependency on wind speeds (Hersbach Citation2010; Vachon and Wolfe Citation2010) which can be highly variable from one scene to another. This was also reflected in the different test years selection exercise where lower accuracies were obtained for the water class. Adding auxiliary information like reanalysis wind speeds or SAR derived wind speed information (Vachon and Dobson Citation2000) might greatly improve such a product.
During the melt period, both products can be affected by the various melt stages of the snow and sea ice like wet snow and melt pond formation. This could lead to misclassifying ice for water where trained analysts have auxiliary data to identify ice during the melt period. The ASI product seems especially sensitive to higher atmospheric moisture content during the melt season (Sotiropoulou et al. Citation2016) and SIC seems to drop more rapidly than the other products given its known limitations in marginal ice zones (Radhakrishnan et al. Citation2021).
Overall, some of these errors in both ASI and RSAT-2 products, could be explained by the ± one tenth (1/10) on the precision of the CIS charts (Cheng et al. Citation2020) which is comparable to the RMSE. This could be especially true during the melt and refreeze periods but not so during the full-ice cover and ice-free periods. Overall, the 2 products have very similar errors with their respective strengths and weaknesses. This is why a combination of both datasets is more commonly used to achieve better automated SIC products (Radhakrishnan et al. Citation2021; Saldo et al. Citation2020).
As shown in , the CNN output using RSAT-2 data could be adapted based on the intended application depending on the spatial resolution needed for the output as well. Also, a more complex CNN can be developed to fit to a specific product such as an ice chart generated by expert analysts and improve the accuracy of the automated output (Stokholm et al. Citation2022; Wang and Li Citation2021; Radhakrishnan et al. Citation2021).
Conclusion
In this study, we have shown that a simple convolutional neural network (CNN) could achieve high accuracy to classify sea ice from water within a 1 km2 RSAT-2 image chip. To achieve this, the RSAT-2 dual-polarized ScanSAR wide image archive over Coronation Gulf marine region available to the Government of Canada was used to train and validate this CNN. A total of 1,123 scenes acquired between August 21, 2009 and July 16, 2020 were used to train and validate the model. This allowed for 10 years of diverse ice/water conditions to train this model. The last year of data (2019–2020 ice season) was kept out of the training process and used to test the CNN on ice/water conditions independent from previous years. An overall accuracy of 90.1% was achieved on the validation dataset and 86.3% on the test dataset.
It was shown that HH was the SAR channel that provided the most information out of the 2 polarizations. Nonetheless, the cross-pol channel HV added significant information to the model which improved its accuracy. Adding the noise floor (NESZ) and incidence angle as extra bands to the CNN inputs had a statistically significant impact on its accuracy. This suggests that the added information helps the CNN decode the cross-pol signal since combining the angle and NESZ to HH alone did not significantly improve the accuracy of the model.
It was also shown that the model accuracy varies greatly with incidence angle. In fact, higher accuracy was achieved at lower incidence angle (<25°). It is thus suggested that lower incidence angle ranges be used to improve the performance of automated methods to discriminate ice from water.
A visual analysis was done on the output of the CNN model and compared to other sea-ice products currently available to determine its applicability to different studies. It was shown that the binary prediction values generated from the CNN provided information on the ice conditions and could inform on specific features such as smaller leads in the ice which are currently not represented in ice charts such as the ones provided by the Canadian Ice Service (CIS) or the sea ice concentration products available from passive microwave remote sensing data. It was also shown that the CNN detected open water areas which were difficult to identify by expert analysts. The CNN could thus provide a good automated first guess to expert analysts to improve the charts for shipping.
Finally, an 11-year time series analysis was conducted. Results showed that over the 11-year span, the mean bias and RMSE in SIC percentage was relatively similar for both RSAT-2 and ASI SIC outputs with slightly lower errors for the RSAT-2 output. A monthly analysis showed that the strongest errors occur during the shoulder seasons (melt and refreeze periods) with a higher bias variability for the ASI output. During the consolidated landfast ice period, both outputs showed a median error below 10% which is comparable to the precision of ice charts. Overall, both SIC outputs had their respective strengths and weaknesses. A combination of both passive and active microwave remote sensing data could prove beneficial for such applications.
With the new generations of C-band SAR sensors such as the Sentinel-1 constellation and the RADARSAT Constellation Mission providing a very large volume of data, deep learning methods become very attractive to develop automated sea-ice mapping products. Since each sensor has its respective engineering and acquisition properties, i.e., incidence angle range, NESZ and spatial resolution, more work will need to be done to assess the performance of each sensor to classify ice from water. This study brings solutions and indications on how to harness the potential of deep learning and SAR data across all platforms.
Acknowledgments
The authors would like to thank Professors David A. Clausi and Mohammad Javad Shafiee from the University of Waterloo, Canada, for their advice on deep learning algorithm use in the early stages of this study which avoided some pitfalls. A special thanks to Dr. Jon Pasher and Robert Thompson at Environment and Climate Change Canada for helping acquire, build and setup the workstation used for this study and also help with the software/driver/libraries/dependencies setup to process the data and run the CNN. Analysis in this study uses Python open-source scientific computing packages including Pandas, NumPy, SciPy and Keras within TensorFlow. Codes and details on accessing the data used in this study are available at https://github.com/ECCCBen/SeaIceCNN.
References
- Abadi, M., Agarwal, A., Barham, P., Brevdo, E., Chen, Z., Citro, C., Corrado, G.S., et al. 2015. TensorFlow: Large-Scale Machine Learning on Heterogeneous Distributed Systems. Savannah: USENIX Association.
- Aldenhoff, W., Eriksson, L., Ye, Y., and Heuze, C. 2020. “First-year and multiyear sea ice incidence angle normalization of dual-polarized sentinel-1 SAR images in the Beaufort Sea.” IEEE Journal of Selected Topics in Applied Earth Observations and Remote Sensing, Vol. 13: pp. 1540–1550. doi:10.1109/JSTARS.2020.2977506.
- AMAP. 2017. Snow, Water, Ice and Permafrost in the Arctic (SWIPA) 2017. Oslo, Norway: Arctic Monitoring and Assessment Programme (AMAP), xiv + 269 pp.
- Beitsch, A., Kaleschke, K., and Kern, S. 2014. “Investigating high-resolution AMSR2 sea ice concentrations during the February 2013 fracture event in the Beaufort Sea.” Remote Sensing, Vol. 6(No. 5): pp. 3841–3856. doi:10.3390/rs6053841.
- Bengio, Y. 2012. “Practical recommendations for gradient-based training of deep architectures.” In Neural Networks: Tricks of the Trade. Berlin, Germany: Springer, pp. 437–478.
- Buda, M., Maki, A., and Mazurowski, M. 2018. “A systematic study of the class imbalance problem in convolutional neural networks.” Neural Networks: The Official Journal of the International Neural Network Society, Vol. 106: pp. 249–259. doi:10.1016/j.neunet.2018.07.011.
- Bush, E., and Lemmen, D. (editors). 2019. Canada’s Changing Climate Report. Ottawa, ON: Government of Canada, 444 p.
- Canadian Ice Service. 2015. Manual of Ice (MANICE). Date modified: 2016-05-19. https://www.canada.ca/en/environment-climate-change/services/weathermanuals-documentation/manice-manual-of-ice.html
- Castro De La Guardia, L., Myers, P., Derocher, A., Lunn, N., and Terwisscha Van Scheltinga, A. 2017. “Sea ice cycle in Western Hudson Bay, Canada, from a polar bear perspective.” Marine Ecology Progress Series, Vol. 564: pp. 225–233. doi:10.3354/meps11964.
- Cheng, A., Casati, B., Tivy, A., Zagon, T., Lemieux, J.-F., and Tremblay, L.B. 2020. “Accuracy and inter-analyst agreement of visually estimated sea ice concentrations in Canadian ice service ice charts using single-polarization RADARSAT-2.” The Cryosphere, Vol. 14(No. 4): pp. 1289–1310. doi:10.5194/tc-14-1289-2020.
- Dawson, J., Pizzolato, L., Howell, S., Copland, L., and Johnston, M. 2018. “Temporal and spatial patterns of ship traffic in the Canadian Arctic from 1990 to 2015.” ARCTIC, Vol. 71(No. 1): pp. 15–26. doi:10.14430/arctic4698.
- Derksen, C., Burgess, D., Duguay, C., Howell, S., Mudryk, L., Smith, S., Thackeray, C., and Kirchmeier-Young, M. 2019. “Changes in snow, ice, and permafrost across Canada; chapter 5.” In Canada’s Changing Climate Report, edited by E. Bush and D.S. Lemmen, 194–260. Ottawa: Government of Canada.
- Dierking, W. 2013. “Sea ice monitoring by synthetic aperture radar.” Oceanography, Vol. 26(No. 2): pp. 100–111. doi:10.5670/oceanog.2013.33.
- Environment and Climate Change Canada. 2021. Recovery Strategy for the Peary Caribou (Rangifer Tarandus Pearyi) in Canada [Proposed]. Species at Risk Act Recovery Strategy Series. Ottawa: Environment and Climate Change Canada, xii ⊞ 86 pp.
- Fang, Z., Wang, Y., Peng, L., and Hong, H. 2020. “Integration of convolutional neural network and conventional machine learning classifiers for landslide susceptibility mapping.” Computers & Geosciences, Vol. 139: pp. 104470. doi:10.1016/j.cageo.2020.104470.
- Florko, K., Derocher, A., Breiter, C.-J., Ghazal, M., Hedman, D., Higdon, J., Richardson, E., Sahanatien, V., Trim, V., and Petersen, S. 2020. “Polar bear denning distribution in the Canadian Arctic.” Polar Biology, Vol. 43(No. 5): pp. 617–621. doi:10.1007/s00300-020-02657-8.
- Geldsetzer, T., Arkett, M., Zagon, T., Charbonneau, F., Yackel, J., and Scharien, R. 2015. “All-season compact-polarimetry C-band SAR observations of sea ice.” Canadian Journal of Remote Sensing, Vol. 41(No. 5): pp. 485–504. doi:10.1080/07038992.2015.1120661.
- Geldsetzer, T., Khurshid, S., Warner, K., Botelho, F., and Flett, D. 2019. “Wind speed retrieval from simulated RADARSAT constellation mission compact polarimetry SAR data for marine application.” Remote Sensing, Vol. 11(No. 14): pp. 1682. doi:10.3390/rs11141682.
- Guo, C., Pleiss, G., Sun, Y., and Weinberger, K.Q. 2017. “On calibration of modern neural networks.” arXIv, cs.LG, 1706.04599, Vol. 2017: pp. 2130–2143.
- Haas, C., and Howell, S. 2015. “Ice thickness in the northwest passage.” Geophysical Research Letters, Vol. 42(No. 18): pp. 7673–7680. doi:10.1002/2015GL065704.
- Han, J., and Moraga, C. 1995. “The influence of the sigmoid function parameters on the speed of backpropagation learning.” Lecture Notes in Computer Science (Including Subseries Lecture Notes in Artificial Intelligence and Lecture Notes in Bioinformatics), Vol. 930: pp. 195–201. doi:10.1007/3-540-59497-3_175.
- Hardt, M., Recht, B., and Singer, Y. 2016. “Train faster, generalize better: stability of stochastic gradient descent.” In 33rd International Conference on Machine Learning, ICML 2016, Vol. 3, 1868–1877.
- Hauser, D.D.W., Laidre, K.L., and Stern, H.L. 2018. “Vulnerability of arctic marine mammals to vessel traffic in the increasingly ice-free northwest passage and northern sea route.” Proceedings of the National Academy of Sciences of the United States of America, Vol. 115(No. 29): pp. 7617–7622. doi:10.1073/pnas.1803543115.
- Henderson, E.M., Derocher, A.E., Lunn, N.J., Montpetit, B., Merrill, E.H., and Richardson, E.S. 2021. “Polar bear Ursus maritimus use of the western Hudson Bay flaw lead.” Marine Ecology Progress Series, Vol. 664: pp. 227–242. doi:10.3354/meps13642.
- Hersbach, H. 2010. “Comparison of C-band scatterometer CMOD5. N equivalent neutral winds with ECMWF.” Journal of Atmospheric and Oceanic Technology, Vol. 27(No. 4): pp. 721–736. doi:10.1175/2009JTECHO698.1.
- Howell, S.E.L., Babb, D.G., Landy, J.C., Moore, G.W.K., Montpetit, B., and Brady, M. 2023. “A comparison of Arctic Ocean sea ice outflow between Nares Strait and the Canadian Arctic Archipelago.” Journal of Geophysical Research: Oceans, Vol. 128(No. 4) pp. e2023JC019687. doi:10.1029/2023JC019687.
- Howell, S.E.L., and Brady, M. 2019. “The dynamic response of sea ice to warming in the Canadian Arctic Archipelago.” Geophysical Research Letters, Vol. 46(No. 22): pp. 13119–13125. doi:10.1029/2019GL085116.
- Howell, S.E.L., Derksen, C., Pizzolato, L., and Brady, M. 2015. “Multiyear ice replenishment in the Canadian Arctic Archipelago: 1997-2013.” Journal of Geophysical Research: Oceans, Vol. 120(No. 3): pp. 1623–1637. doi:10.1002/2015JC010696.
- Hu, X., Fan, H., Cai, M., Sejas, S., Taylor, P., and Yang, S. 2020. “A less cloudy picture of the inter-model spread in future global warming projections.” Nature Communications, Vol. 11(No. 1) pp. 4472. doi:10.1038/s41467-020-18227-9.
- Huntington, H., Zagorsky, A., Kaltenborn, B., Shin, H., Dawson, J., Lukin, M., Dahl, P., Guo, P., and Thomas, D. 2022. “Societal implications of a changing arctic ocean.” Ambio, Vol. 51(No. 2): pp. 298–306. doi:10.1007/s13280-021-01601-2.
- Iban, M.C., and Sekertekin, A. 2022. “Machine learning based wildfire susceptibility mapping using remotely sensed fire data and GIS: A case study of Adana and Mersin provinces.” Ecological Informatics, Vol. 69: pp. 101647. doi:10.1016/j.ecoinf.2022.101647.
- IICWG: SIGRID-3. 2014. A Vector Archive Format for Sea Ice Charts, Tech. rep., JCOMM Technial Report Series, No.23. Geneva: WMO.
- Ioffe, S., and Szegedy, C. 2015. “Batch normalization: Accelerating deep network training by reducing internal covariate shift.” arXiv:1502.03167 [cs], Vol. 1: pp. 448–456.
- Ivanova, N., Pedersen, L.T., Tonboe, R.T., Kern, S., Heygster, G., Lavergne, T., Sorensen, A., et al. 2015. “Inter-comparison and evaluation of sea ice algorithms: Towards further identification of challenges and optimal approach using passive microwave observations.” The Cryosphere, Vol. 9(No. 5): pp. 1797–1817. doi:10.5194/tc-9-1797-2015.
- Joshi, N., Baumann, M., Ehammer, A., Fensholt, R., Grogan, K., Hostert, P., Jepsen, M.R., et al. 2016. “A review of the application of optical and radar remote sensing data fusion to land use mapping and monitoring.” Remote Sensing, Vol. 8(No. 1): pp. 70. doi:10.3390/rs8010070.
- Komarov, A.S., and Buehner, M. 2019. “Detection of first-year and multi-year sea ice from dual-polarization SAR images under cold conditions.” IEEE Transactions on Geoscience and Remote Sensing, Vol. 57(No. 11): pp. 9109–9123. doi:10.1109/TGRS.2019.2924868.
- Krizhevsky, A., Sutskever, I., and Hinton, G. 2012. “ImageNet classification with deep convolutional neural networks.” Advances in Neural Information Processing Systems, Vol. 2: pp. 1097–1105.
- LeCun, Y., Haffner, P., Bottou, L., Bengio, Y., Forsyth, D.A., Mundy, J.L., di Gesú, V., and Cipolla, R. 1999. “Object recognition with gradient-based learning.” Lecture Notes in Computer Science (Including Subseries Lecture Notes in Artificial Intelligence and Lecture Notes in Bioinformatics), Vol. 1681: pp. 319–345. doi:10.1007/3-540-46805-6_19.
- Lillesand, T., and Kiefer, R. 1994. Remote Sensing and Image Interpretation. 3rd ed. New York: Wiley.
- Liu, G., Ji, M., Jin, F., Li, Y., He, Y., and Li, T. 2021. “Analysis of the spatial and temporal variation of sea ice and connectivity in the nep of the arctic in summer in hot years.” Journal of Marine Science and Engineering, Vol. 9(No. 11): pp. 1177. doi:10.3390/jmse9111177.
- Mahmud, M., Geldsetzer, T., Howell, S., Yackel, J., Nandan, V., and Scharien, R. 2018. “Incidence angle dependence of HH-polarized CA Nd L-band wintertime backscatter over Arctic sea ice.” IEEE Transactions on Geoscience and Remote Sensing, Vol. 56(No. 11): pp. 6686–6698. doi:10.1109/TGRS.2018.2841343.
- Mäkynen, M., and Karvonen, J. 2017. “MODIS sea ice thickness and open water–sea ice charts over the Barents and Kara seas for development and validation of sea ice products from microwave sensor data.” Remote Sensing, Vol. 9(No. 12): pp. 1324. doi:10.3390/rs9121324.
- McNemar, Q. 1947. “Note on the sampling error of the difference between correlated proportions or percentages.” Psychometrika, Vol. 12(No. 2): pp. 153–157. doi:10.1007/BF02295996.
- Melia, N., Haines, K., and Hawkins, E. 2016. “Sea ice decline and 21st century trans-Arctic shipping routes.” Geophysical Research Letters, Vol. 43(No. 18): pp. 9720–9728. doi:10.1002/2016GL069315.
- Meredith, M., Sommerkorn, M., Cassota, S., Derksen, C., Ekaykin, A., Hollowed, A., Kofinas, G., Mackintosh, A., Melbourne-Thomas, J., Muelbert, M.M.C., Ottersen, G., Pritchard, H., and Schuur, E.A.G. 2019: Polar Regions. In IPCC Special Report on the Ocean and Cryosphere in a Changing Climate [H.-O. Pörtner, D.C. Roberts, V. MassonDelmotte, P. Zhai, M. Tignor, E. Poloczanska, K. Mintenbeck, A. Alegría, M. Nicolai, A. Okem, J. Petzold, B. Rama, N.M. Weyer (eds.)]. Cambridge, UK and New York, NY, USA: Cambridge University Press, pp. 203-320. doi:10.1017/9781009157964.005.
- Mudryk, L., Dawson, J., Howell, S., Derksen, C., Zagon, T., and Brady, M. 2021. “Impact of 1, 2 and 4 °C of global warming on ship navigation in the Canadian Arctic.” Nature Climate Change, Vol. 11(No. 8): pp. 673–679. doi:10.1038/s41558-021-01087-6.
- Mudryk, L., Derksen, C., Howell, S., Laliberté, F., Thackeray, C., Sospedra-Alfonso, R., Vionnet, V., Kushner, P., and Brown, R. 2018. “Canadian snow and sea ice: Historical trends and projections.” The Cryosphere, Vol. 12(No. 4): pp. 1157–1176. doi:10.5194/tc-12-1157-2018.
- Notz, D., and Stroeve, J. 2016. “Observed Arctic Sea-ice loss directly follows anthropogenic CO2 emission.” Science, Vol. 354(No. 6313): pp. 747–750. doi:10.1126/science.aag2345.
- Overland, J., Dunlea, E., Box, J.E., Corell, R., Forsius, M., Kattsov, V., Olsen, M.S., Pawlak, J., Reiersen, L.-O., and Wang, M. 2019. “The urgency of Arctic change.” Polar Science, Vol. 21: pp. 6–13. doi:10.1016/j.polar.2018.11.008.
- Parashar, S., Langham, E., McNally, J., and Ahmed, S. 1993. “Radarsat mission requirements and concept.” Canadian Journal of Remote Sensing, Vol. 19(No. 4): pp. 280–288. doi:10.1080/07038992.1993.10874563.
- Pogson, L., Geldsetzer, T., Buehner, M., Carrieres, T., Ross, M., and Scott, A.K. 2017. “Collecting empirically derived SAR characteristic values over one year of sea ice environments for use in data assimilation.” Monthly Weather Review, Vol. 145(No. 1): pp. 323–334. doi:10.1175/MWR-D-16-0110.1.
- Radhakrishnan, K., Scott, K.A., and Clausi, D.A. 2021. “Sea ice concentration estimation: Using passive microwave and SAR data with a U-net and curriculum learning.” IEEE Journal of Selected Topics in Applied Earth Observations and Remote Sensing, Vol. 14: pp. 5339–5351. doi:10.1109/JSTARS.2021.3076109.
- Richter-Menge, J., Overland, J. E., Mathis, T., and Osborne, E. 2017. Arctic Report Card 2017, Last modified: December 2017. www.Arctic.Noaa.Gov/Report-Card.
- Saldo, R., Brandt Kreiner, M., BuusHinkler, J., Pedersen, L.T., Malmgren-Hansen, D., Nielsen, A.A. et al. (2020). AI4Arctic/ASIP Sea Ice Dataset - version 2. Technical University of Denmark. Dataset. doi:10.11583/DTU.13011134.v2.
- Screen, J. 2018. “Arctic sea ice at 1.5 and 2 °C.” Nature Climate Change, Vol. 8(No. 5): pp. 362–363. doi:10.1038/s41558-018-0137-6.
- Sigmond, M., Fyfe, J., and Swart, N. 2018. “Ice-free Arctic projections under the Paris agreement.” Nature Climate Change, Vol. 8(No. 5): pp. 404–408. doi:10.1038/s41558-018-0124-y.
- Sotiropoulou, G., Tjernström, M., Sedlar, J., Achtert, P., Brooks, B.J., Brooks, I.M., Persson, P.O.G., et al. 2016. “Atmospheric conditions during the Arctic clouds in summer experiment (ACSE): Contrasting open water and sea ice surfaces during melt and freeze-up seasons.” Journal of Climate, Vol. 29(No. 24): pp. 8721–8744. doi:10.1175/JCLID-16-0211.1.
- Spreen, G., Kaleschke, L., and Heygster, G. 2008. “Sea ice remote sensing using AMSR-E 89-GHz Channels.” Journal of Geophysical Research, Vol. 113 pp. C02S03. doi:10.1029/2005JC003384.
- Stokholm, A., Wulf, T., Kucik, A., Saldo, R., Buus-Hinkler, J., and Hvidegaard, S.M. 2022. “AI4SeaIce: Toward solving ambiguous SAR textures in convolutional neural networks for automatic sea ice concentration charting.” IEEE Transactions on Geoscience and Remote Sensing, Vol. 60: pp. 1–13. doi:10.1109/TGRS.2022.3149323.
- Tivy, A., Howell, S., Alt, B., McCourt, S., Chagnon, R., Crocker, G., Carrieres, T., and Yackel, J. 2011. “Trends and variability in summer sea ice cover in the Canadian Arctic based on the canadian ice service digital archive, 1960-2008 and 1968-2008.” Journal of Geophysical Research, Vol. 116: pp. C03007. doi:10.1029/2009JC005855.
- Tompson, J., Goroshin, R., Jain, A., LeCun, Y., and Bregler, C. 2015. “Efficient object localization using convolutional networks.” In Proceedings of the IEEE Computer Society Conference on Computer Vision and Pattern Recognition, 07-12-June-2015, art. no. 7298664, pp. 648-656. doi:10.1109/CVPR.2015.7298664.
- Vachon, P.W., and Dobson, F.W. 2000. “Wind retrieval from RADARSAT SAR images: Selection of a suitable C-band HH polarization wind retrieval model.” Canadian Journal of Remote Sensing., Vol. 26(No. 4): pp. 306–313. doi:10.1080/07038992.2000.10874781.
- Vachon, P.W., and Wolfe, J. 2010. “C-band cross-polarization wind speed retrieval.” IEEE Geoscience and Remote Sensing Letters, Vol. 8(No. 3): pp. 456–459. doi:10.1109/LGRS.2010.2085417.
- van Luijk, N., Carter, N., Dawson, J., Parker, C., Grey, K., Provencher, J., and Cook, A. 2022. “Community-identified risks to hunting, fishing, and gathering (harvesting) activities from increased marine shipping activity in Inuit Nunangat, Canada.” Regional Environmental Change, Vol. 22(No. 1): Article number 24. doi:10.1007/s10113-022-01894-3.
- Wang, L., Scott, K.A., Xu, L., and Clausi, D.A. 2016. “Sea ice concentration estimation during melt from dual-pol SAR scenes using deep convolutional neural networks: A case study.” IEEE Transactions on Geoscience and Remote Sensing, Vol. 54(No. 8): pp. 4524–4533. doi:10.1109/TGRS.2016.2543660.
- Wang, Y.-R., and Li, X.-M. 2021. “Arctic sea ice cover data from spaceborne synthetic aperture radar by deep learning.” Earth System Science Data, Vol. 13(No. 6): pp. 2723–2742. doi:10.5194/essd-13-2723-2021.
- Wong, S.N.P., Gjerdrum, C., Gilchrist, H.G., and Mallory, M.L. 2018. “Seasonal vessel activity risk to seabirds in Waters off Baffin Island, Canada.” Ocean & Coastal Management, Vol. 163: pp. 339–351. doi:10.1016/j.ocecoaman.2018.07.004.
- Zakhvatkina, N., Korosov, A., Muckenhuber, S., Sandven, S., and Babiker, M. 2017. “Operational algorithm for ice-water classification on dualpolarized RADARSAT-2 images.” The Cryosphere, Vol. 11(No. 1): pp. 33–46. doi:10.5194/tc-11-33-2017.
- Zakhvatkina, N., Smirnov, V., and Bychkova, I. 2019a. “Satellite SAR data-based sea ice classification: An overview.” Geosciences, Vol. 9(No. 4): pp. 152. doi:10.3390/geosciences9040152.
- Zakhvatkina, N., Smirnov, V., and Bychkova, I. 2019b. “Sea ice classification based on neural networks method using sentinel-1 data.” In 19th International Multidisciplinary Scientific GeoConference Surveying Geology and Mining Ecology Management, SGEM, Vol. 19, pp. 617–624. doi:10.5593/sgem2019/2.2/S10.076.