
Abstract
Objective:
To evaluate variations in micronutrient biomarker concentrations and deficiencies across the menstrual cycle in a cohort of healthy women.
Methods:
This prospective cohort study was conducted among healthy women of reproductive age living in the State College area, Pennsylvania, (n = 45). Data collection occurred at the early follicular phase, the late follicular phase, and the midluteal phase. Fasting blood samples were collected to measure micronutrient biomarkers.
Results:
At the early follicular phase, the mean ± SD concentrations for zinc, copper, magnesium, and retinol were 81.8 ± 16.2 µg/dL, 80.1 ± 12.8 µg/dL, 17.9 ± 1.4 mg/L, and 39.4 ± 9.3 µg/dL, respectively. The geometric mean (95% CI) for manganese, iron and ferritin concentrations were 1.51 [1.21, 1.87] µg/L, 106.7 [90.8, 125.4] µg/dL, and 26.4 [20.5, 34.0] µg/L, respectively. Mean concentrations of zinc and magnesium declined by 6.6% (p = 0.009) and 4.6% (p < 0.001) from the early follicular phase to the midluteal phase, respectively. Other biomarkers remained relatively constant across the cycle. At the early follicular phase, the prevalence of low serum concentrations for zinc, copper, magnesium, manganese, iron, and ferritin was 22%, 7%, 29%, 13%, 14%, and 28%, respectively. Also, in early follicular phase, 36% had anemia, and 13% specifically had iron deficiency anemia. The prevalence of magnesium deficiency was significantly higher at the midluteal phase vs. the early follicular phase (p = 0.025).
Conclusions:
Our study suggests that while many micronutrient concentrations are relatively constant across the menstrual cycle in healthy women, zinc and magnesium decline, and the prevalence of magnesium deficiency increases.
Supplemental data for this article is available online at
Introduction
Micronutrient biomarkers are important for making research and clinical decisions based on established cutoffs to determine deficiency and excess. In both men and women, diurnal and day-to-day fluctuations can affect micronutrient biomarker concentrations and how estimates are interpreted (Citation1–5). Conventionally, most researchers tend to collect fasting blood samples within a specified time period which can help reduce errors arising from diurnal and day-to-day fluctuations. However, little attention has been paid to how cyclic changes in the menstrual cycle can influence biomarker variations and interpretation in premenopausal women. Cyclic fluctuations in ovarian hormones influence several biological processes in women of reproductive age and could down- or upregulate nutritional biomarker concentrations and may affect how research findings are interpreted (Citation6, Citation7). For instance, iron homeostasis may change across the menstrual cycle, resulting in different iron status results based on the day in the menstrual cycle when blood samples are collected (Citation8).
Though population-based studies suggest an association between oral contraceptive (OC) use and several micronutrient biomarkers, studies specifically tracking changes in micronutrient biomarkers across the menstrual cycle are limited and often contradictory. For example, while some studies showed a decline in zinc concentration between the early and late follicular phase/ovulation (n = 5) (Citation9), others have indicated an increase across the menstrual cycle in healthy women (n = 14) (Citation10). Serum magnesium has been reported to decline between menses and the follicular phase, then rise between the follicular phase and the luteal phase in healthy women with regular menstrual cycles (Citation11, Citation12). Results based on data from the NHANES II showed significantly lower serum ferritin during menses than in the luteal phase (Citation13). However, other studies found no change across the menstrual cycle in iron-depleted women (Citation14). In a study among 43 Japanese college students, serum ferritin concentration was higher at the follicular phase than the luteal phase among participants that were marginally iron deficient (n = 23), but not in participants with adequate iron status (n = 15) (Citation15).
These inconsistencies in micronutrient biomarker patterns across the menstrual cycle from different studies may be due to small sample sizes, inaccurate timing of sample collection to cycle phase, and use of cross-sectional data which compared different groups of women. Moreover, some researchers often assume a 28-day cycle, which is not accurate for many women (Citation16–19). Finally, there has been a focus on biomarker concentrations without regard to the total circulating mass. Plasma concentration of micronutrients is dependent on the total circulating plasma volume, which is easily altered by factors such as intense or prolonged exercise (Citation20, Citation21), disease states (Citation22, Citation23), changes in temperature (Citation24–26), and hydration status (Citation27). Thus, slight alterations in plasma volume result in a corresponding change in the concentration of circulating biomarkers. Therefore, the measurement of plasma volume and concentration provides a complete picture of the total circulating biomarkers available to the body tissues. Such information can help decide if abnormal concentrations are natural or attributed to an alteration in plasma volume. Temporary reduction in plasma volume could result in hemoconcentration, and increased volume will result in hemodilution, which does not necessarily reflect the individual’s nutritional status being measured. The measurement of plasma volume and micronutrient concentrations allows for estimating biomarkers and tracking changes in concentration and mass across the menstrual cycle.
As few studies have examined changes in micronutrient concentrations longitudinally during the menstrual cycle, the present study aimed to evaluate the variation of selected micronutrient biomarker concentrations and the percentage deficient across the menstrual cycle in a cohort of healthy women of reproductive age. The micronutrients selected were based on their clinical and public health relevance and those that resources allowed us to measure. The primary outcomes were serum concentrations of zinc, copper, magnesium, manganese, iron, ferritin, and retinol. Secondarily, we aimed to examine changes in biomarker mass across the cycle.
Methods
Subjects
A convenience sample of women was recruited from State College, Pennsylvia, and surrounding areas. Inclusion criteria were: age 18–44 years, BMI of 18.5 to 24.9; regular menstrual cycle (defined as a self-reported average cycle duration of 26 to 35 days for the last three months); not using hormonal birth control; nonpregnant and not planning a pregnancy; if ever pregnant, last pregnancy was more than or equal to 12 months ago; and normal blood pressure. Exclusion criteria included the following: diagnosed with a medical condition (or under regular monitoring by a doctor); smoking; blood pressure higher than normal at any visit; use of antidepressants or chronic use of any medication; currently breastfeeding; used any hormonal birth control within last the three months; used depot medroxyprogesterone acetate in the past 12 months; and diagnosed with polycystic ovary syndrome. Participants were dropped if they could not adhere to the study protocol or correctly use the fertility monitors. The sample size estimation was based on a report by Micho et al. where serum zinc and copper concentrations were measured across the menstrual cycle (n = 14) (Citation10) and the results from our pilot study (n = 9) (Citation28). With a statistical power of 80% and type I error of 5% (two-sided), we aimed to detect a 10% change in zinc and copper concentrations between any two cycle timepoints. Applying 29% expected dropout rate and assuming an additional 10% non-ovulatory cycles (Citation29, Citation30), the estimated sample size was 51 for zinc and 45 for copper. We screened a total of 178 women, of which 47 enrolled into the study. Of the enrolled subjects, the phlebotomist could not successfully establish an IV in four subjects (two each at visits 1 and 3) to collect blood, and six women dropped before visit 2, and two before visit 3 as previously reported (Citation31). Therefore, the analytic sample size was based on subjects with biomarkers measured at visits 1, 2, and 3, which were 45, 39, and 35, respectively.
The protocol was approved by The Office for Research Protections (ORP) at The Pennsylvania State University (STUDY00008383) and conducted in line with the Declaration of Helsinki. The trial is registered at www.clinicaltrials.gov (NCT03422809). All women signed an informed consent form before voluntary enrollment.
Study design
This was a 3-visit prospective cohort study of plasma volume and micronutrient status across one full menstrual cycle in healthy women of reproductive age with a regular menstrual cycle (Citation31). Findings from the plasma volume objective were previously published (Citation31). The current analysis is focused on micronutrient status across the three visits.
Women responded to study information posted on several platforms, including print advertisements, online message boards, and online recruitment sites (ResearchMatch) available to women in the State College area and surrounding towns within Center County, Pennsylvia. A detailed study design was previously reported (Citation31). In brief, fasted blood samples were collected on the morning of 3 separate visits, which occurred during key phases of their menstrual cycle with different hormonal profiles. The early follicular phase (d2-5) occurs during menstruation and is characterized by low estrogen and low progesterone. The late follicular phase coincides with peak estrogen and LH secretion and was identified around d12 of the cycle based on results of fertility monitors (Clearblue® Fertility Monitors Swiss Precision Diagnostics GmbH, Procter and Gamble, Cincinnati, OH) which tracks both estrogen and LH. The luteal phase immediately follows the follicular phase and persists until the next menstrual cycle begins and is characterized by high progesterone and lower estrogen concentrations. (see Supplemental Table S1).
Biochemical measurements
Height and weight measurements were conducted, followed by a 15 minute rest in a supine position. A small heating pad was applied over the inside of the arm selected for IV insertion. A temporary tourniquet was applied to aid in identifying an antecubital vein, and an IV of appropriate gauge size based on the size of the subjects (BD Insyte Autoguard 18 G and 20 G, Becton, Dickinson and Company, Franklin Lakes, NJ) was inserted by a nurse to collect blood samples. Blood samples were collected into a 6 mL trace element-free vacutainer tube and a 2 mL EDTA-containing tube for serum, and whole blood, respectively. To obtain serum, the 6 mL EDTA-free were allowed to clot and centrifuged at 3200 rpm for 15 minutes (Quest Diagnostics, Horizon model 642E centrifuge) to separate serum from blood cells, and the supernatant was aliquoted into microcentrifuge tubes and stored at −80 °C until analysis. The 2 mL tubes were not centrifuged and were used to measure complete blood count using the Beckman Coulter Ac‑T Diff 2 hematology analyzer (Beckman Coulter Inc, Brea, CA) with 3-level quality-control material (Beckman Coulter, Inc. Brea, CA) within 1 hour of blood collection.
Commercial immunoassay kits were used to measure ferritin (Ramco Laboratories Inc., Stafford, TX), α1-acid glycoprotein (AGP; Kent Laboratories Inc., Bellingham, Washington), and C-reactive protein (CRP; Kent Laboratories Inc., Bellingham, Washington) in serum using a microplate reader (Bio-Tek Instruments, Inc., Winooski, VT). Serum retinol concentration was measured using ultra-performance liquid chromatography (ACQUITY UPLC System, Waters Corporation, Milford, MA). National Institutes of Standards and Technology’s standard (Standard Reference Material® 1950, Gaithersburg, Maryland) was used for quality control during each run of the retinol assays. The intra- and inter-assay coefficient of variations were 5.8% and 5.9% for ferritin, 3.2% and 4.9% for AGP, and 0.1% and 1.3% for CRP, respectively.
Serum concentrations of zinc (Zn), copper (Cu), magnesium (Mg), manganese (Mn), and iron (Fe) were determined by using Inductively Coupled Plasma Mass Spectrometry (ICP-MS) with Collision Cell Technology (ICP-MS, Thermo Fisher Scientific X Series 2) at the Laboratory for Isotopes and Metals in the Environment (LIME) at The Pennsylvania State University as previously described (Citation28). Control reference materials (SeronormTM trace element serum L-1 and L-2 RUO, SERO AS, Billingstad Norway) were prepared and run the same way as the serum samples. National Institutes of Standards and Technology’s standard (Standard Reference Material® 1640a) were run for every ten samples as a quality control check. Intra- and inter-assay CVs for Zn, Cu, Mg, Mn, and iron were 2.0% and 2.6%, 3.7% and 4.0%, 3.4% and 7.0%, 5.1 and 4.9%, and 2.3 and 3.1%, respectively.
Serum estradiol and progesterone were measured using ELISA kits produced by Siemens for the Immulite (Siemens Medical Solutions Diagnostics, Siemens Medical Solutions Diagnostics) as described elsewhere (Citation31).
The following cutoffs were used to define low status: zinc deficiency, serum zinc <70 µg/dL (10.7 µmol/L) (Citation32); copper deficiency, serum copper < 63.5 µg/dL (10.0 µmol/L) (Citation33); magnesium deficiency, serum magnesium <17 mg/L (0.70 mmol/L) (Citation34); manganese deficiency, <0.54 µg/L (Citation35); iron deficiency, ferritin (<15 µg/L) (Citation36); and marginal vitamin A deficiency, serum retinol < 20 µg/dL (0.70 µmol/L) (Citation37). Anemia was defined using the Centers for Disease Control and Prevention criteria (hemoglobin <12.0 g/dL) (Citation38) and iron deficiency anemia was defined as anemia with low serum ferritin (<15 µg/L) (Citation36). Serum zinc, retinol, and ferritin concentrations were corrected for inflammation based on AGP and CRP using external correction factors. We defined signs of infection or inflammation as an abnormal CRP (>5.0 mg/L) or AGP >1.0 mg/L (Citation39). A combination of CRP and AGP were used to classify inflammation, and we used the following categories defined by Thurnham et al.: no inflammation (CRP ≤5 mg/L and AGP ≤1 g/L); incubation (CRP >5 mg/L and AGP ≤1 g/L); early convalescence (CRP >5 mg/L and AGP >1 g/L); late convalescence (CRP ≤5 mg/L and AGP >1 g/L) (Citation40). The correction factors for incubation, early convalescence, and late convalescence with reference to no inflammation were: 0.92, 1.05, and 1.09 for zinc (Citation41); 0.83, 0.48, and 0.65 for ferritin (Citation41); and 1.14, 1.31, and 1.12 for retinol, respectively (Citation40).
Micronutrient mass was calculated by multiplying the concentration by the plasma volume (accounting for appropriate unit adjustments). We measured plasma volume at each visit using a dye-dilution method with indocyanine green as previously described (Citation42).
Statistical analysis
Data were checked for normality using the Shapiro-Wilk test and visual inspection of kernel density plots. Variables were presented as mean ± SD if normally distributed, unless otherwise stated. Serum manganese, iron, and ferritin were log-transformed for regression analysis, and results were back-transformed for easier interpretation. Two extremely high values of serum iron (greater than mean + 3SD) were removed from the analysis.
A linear mixed‐effects model was used to estimate changes in micronutrient biomarker concentrations between the three timepoints. To test the mean difference in micronutrient biomarker between any two phases, time of visit (categorical variable) was entered into the model as a fixed variable. The participant identification number was included as a random effect variable to account for repeated measurements. Separate models were run for each biomarker. In a second model for each biomarker, we adjusted for the effect of background characteristics on micronutrient concentrations by adding participant’s age, BMI, and race (classified as White, Asian, and others) as fixed variables. These models compared mean micronutrient biomarker concentrations across the menstrual cycle (late follicular phase vs early follicular phase, midluteal phase vs late follicular phase, and midluteal phase vs early follicular phase). From these models, we obtained the changes in biomarker concentrations at visits 2 and 3 from visit 1 (early follicular phase measurements). Differences in biomarker concentrations between the late follicular phase and the midluteal phase were obtained by repeating each analysis and with visit 2 (the late follicular phase) as the reference timepoint. The same analytic approach was used to examine biomarker mass across the cycle.
The prevalence of micronutrient deficiencies was estimated at each visit and compared across the cycle by mixed-effects logistic regression.
Finally, fractional polynomial regression (and prediction plots) was used to visually examine bivariate relationships between each micronutrient biomarker and cycle day and each biomarker and estradiol and progesterone concentrations. In sensitivity analysis, we restricted data to participants without inflammation [n = 34 (visit 1), n = 32 (visit 2), and n = 31 (visit 3)] to examine changes in micronutrient biomarker concentrations across the menstrual cycle. Statistical analyses were conducted with the use of Stata Version 14 (Stata Corp, College Station, Texas).
Results
Characteristics of women were previously reported (Citation31). In brief, participants were mostly college students, never married, and nulliparous. The mean age of participants was 24.2 ± 5.6 years. BMI and percent body fat were 21.7 ± 1.9 kg/m2 (range 18.9 to 24.8 kg/m2) and 25.0 ± 5.1% (range 9.7 to 34.5%), respectively.
Concentrations of micronutrients at each visit are shown in . Zinc (inflammation-adjusted and unadjusted), magnesium, and ferritin (unadjusted) concentrations declined from the early follicular phase to the midluteal phase (all p < 0.05). Zinc concentration dropped by 3.4% between the early and late follicular phase (p = 0.204); 3.3% between the late follicular phase and the midluteal (p = 0.064); and 6.6% from the early follicular phase to midluteal phase (p = 0.009). Magnesium concentration fell by 2.9% between the early and late follicular phase (p = 0.001); 1.8% between the late follicular phase and midluteal phase (p = 0.144); and 4.5% between the early follicular phase and midluteal phase (p < 0.001). Ferritin concentration (unadjusted) fell 15.2% between the early and late follicular phase (p = 0.026); 5.5% between the late follicular phase and midluteal phase (p = 0.468); and 19.8% between the early follicular phase and midluteal phase (p = 0.004). Other micronutrient concentrations remained fairly constant across the menstrual cycle and there were no statistically significant differences between visits. Adjusting for women’s age, BMI, and race/ethnicity, the micronutrient biomarker concentrations showed the same pattern as observed in the unadjusted models (). The point estimates for changes in micronutrient concentrations were less than 1% different between the adjusted and unadjusted models. Further, changes across the cycle examined by day of cycle were similar to changes observed by visit ().
Figure 1. Fractional polynomial regression (prediction line) of micronutrient biomarker concentration on day of cycle when measurement occurred; adjusted zinc (A), copper (B), magnesium (C), manganese (D), the log of iron (E), the log of adjusted ferritin (F), adjusted retinol (G), and hemoglobin (H). Solid black lines represent the prediction line. Short-dash gray lines represent the 95% prediction interval for the prediction line. (119 data points, n = 45).
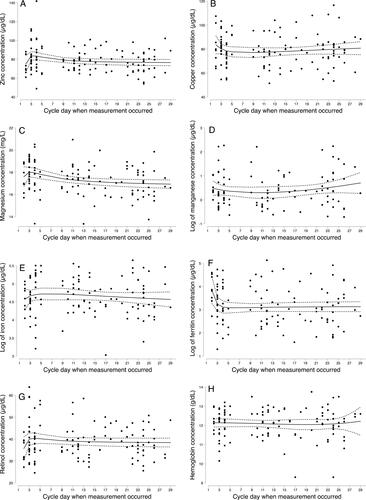
Table 1. Means and within-person differences in micronutrient biomarker concentrations across a single menstrual cycle in women of reproductive age (n = 45) †.
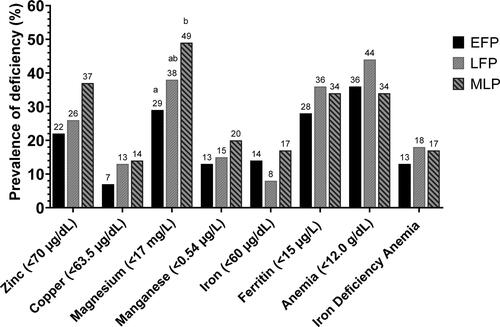
The prevalence of micronutrient deficiencies reflects the pattern of their concentration changes across the menstrual cycle (). Prevalence estimates for zinc, ferritin, and retinol were based on inflammation-adjusted concentrations for each biomarker. The prevalence of magnesium deficiency rose from 29% in the early follicular phase to 38% in the late follicular phase (p > 0.05), and then to 49% in the midluteal phase (p = 0.025). Zinc deficiency rose from 22% to 26% in the late follicular phase and further to 37% in the midluteal phase, however these changes, and changes in prevalence for other deficiencies were not statistically significant (all p > 0.05). No participant was vitamin A deficient. More than one third of the participants were anemic at each timepoint, 36% (early follicular phase), 44% (late follicular phase), and 34% (midluteal phase) and 13–18% had iron deficiency anemia, but there were no statistical differences in prevalence across the cycle (all p > 0.05).
Figure 2. Prevalence of micronutrient deficiencies across the menstrual cycle (n = 45). EFP, early follicular phase; IDA, iron deficiency anemia (hemoglobin <12 g/dL and ferritin <15µg/L); LFP, late follicular phase prospective; MLP, Midluteal phase. Zinc and ferritin were adjusted for inflammation before cut points were applied. Adjusted for inflammation using the following correction factors: no inflammation (CRP ≤5 mg/L and AGP ≤1 g/L); incubation (CRP >5 mg/L and AGP ≤1 g/L); early convalescence (CRP >5 mg/L and AGP >1 g/L); late convalescence (CRP ≤5 mg/L and AGP >1 g/L) (Citation40). The correction factors with reference to no inflammation were; 0.92,1.05, and 1.09 for zinc (Citation41); 0.83,0.48, and 0.65 for ferritin (Citation41); and 1.14,1.31, and 1.12 for retinol (Citation40).
*Bars with an different superscripts k are statistically significantly different from each other as tested by mixed-effects logistic regression (p < 0.05).
There was no vitamin A deficiency (i.e., retinol (< 20µg/dL)) at any visit.
Like micronutrient concentration, the estimated micronutrient biomarker mass tended to be lower at the late follicular phase than at the early follicular phase (). Zinc mass dropped by 6.5% between the early and late follicular phase (p = 0.132); 4.2% between the late follicular phase and the midluteal (p = 0.248); and 10.5% from the early follicular phase to midluteal phase (p = 0.029). Ferritin mass (unadjusted) fell 17.2% between the early and late follicular phase (p = 0.020); 5.8% between the late follicular phase and midluteal phase (p = 0.478); and 22.0% between the early follicular phase and midluteal phase (p = 0.003). Adjusting for background characteristics did not change overall results and interpretations ().
Table 2. Mean serum circulating mass of micronutrient biomarkers and inflammatory marker at the early follicular phase, late follicular phase, and midluteal phase in the menstrual cycle of reproductive age women (n = 45) †.
Inflammation as classified by AGP and CRP was 24.4% (n = 11) at the early follicular phase compared with 17.9% (n = 7) at the late follicular phase and 11.4% (n = 4) at the midluteal phase (p > 0.05) (Supplemental Table S2) (Citation43). CRP concentrations declined across the cycle (p = 0.013), but AGP remained stable throughout.
The correlation between estradiol and micronutrient biomarker concentrations were low, ranging from −0.284 (magnesium) to −0.025 (serum iron), but only zinc and magnesium were statistically significant (p < 0.05; Supplemental Table S3) (Citation43). Similarly, the correlation between progesterone and micronutrient biomarkers ranged from a low of 0.008 (serum retinol) to a high of −0.206 (magnesium); all p > 0.05). Most associations between micronutrients and hormones (or lack thereof) appeared linear (Supplemental Figures S1 and S2) (Citation43).
When participants with inflammation were dropped in a sensitivity analysis, results were similar for all biomarkers except zinc. The reduction in zinc concentration was much higher: there was a decline of 4.2% between the early and late follicular phase (p = 0.146), 5.1% between the late follicular phase and the midluteal phase (p = 0.019), and 9.1% between the early follicular phase and midluteal phase (p = 0.003). When we adjusted for age, BMI, and race and among women without inflammation, changes in micronutrient biomarker concentrations were comparable to the unadjusted results.
Discussion
In this prospective cohort of healthy women of reproductive age, we found that serum zinc and magnesium concentrations declined across the menstrual cycle, and other micronutrient biomarkers remained relatively stable. In parallel, the prevalence of magnesium deficiency increased, but the changes in the prevalence of other micronutrient deficiencies were not statistically significant. Notably, anemia and iron deficiency anemia were highest at mid-cycle (although not statistically different from the earlier and later time in the cycle). Biomarker mass changes across the cycle, or lack thereof, were similar to biomarker concentrations.
Research findings on micronutrient patterns across the menstrual cycle are mixed (Citation9, Citation10, Citation13, Citation14, Citation44, Citation45). Very few studies have examined micronutrient changes in the same women across the menstrual cycle, and most evidence has been drawn from small studies. For instance, the number of study subjects per study range from 5 to 14 for zinc (Citation9, Citation10), 5 to 25 for magnesium (Citation7, Citation9, Citation12, Citation44), and 12 for serum ferritin (Citation14). Sample sizes range from 6 to 20 for retinol (Citation46, Citation47), except in one study with 259 participants (Citation48). While we examined three timepoints across the cycle based on hormonal concentration, most longitudinal studies chose random days to sample blood without reference to hormonal status or time in the cycle.
The concentrations of micronutrients examined in the present study are comparable to those reported for women in other studies (Citation1–5, Citation49–52). For instance, the mean serum zinc concentrations in the present study are similar to those obtained from the US National Health and Nutrition Examination Survey (NHANES 2011–2014, 81 μg/dL) (Citation53). Declines in zinc concentration in this study are consistent with Deuster et al., who reported significantly higher plasma zinc concentrations during menses and the follicular phase than at ovulation (Citation9). However, other studies have reported the lowest concentration at menstruation (the early follicular phase) and highest plasma zinc at the time of ovulation (Citation10). Though the sample size was small in the Deuster et al. study, its strength lies in the fact that participants were measured across three menstrual cycles, allowing them to examine individual change across time.
For magnesium, most studies report the highest concentrations during menstruation and lowest during the late follicular phase and ovulation (Citation7, Citation9), similar to our results. However, one study of 16 women found that mean serum magnesium concentration was stable across the menstrual cycle (Citation44). A decline of 6–12% between the early (menses) and the follicular phase/ovulation has been reported (Citation11, Citation12), however declines that we observed were smaller in magnitude. Other studies did not report the prevalence of deficiency, so we are unable to compare our results to other findings.
In women with regular menstrual cycles, estrogen and progesterone concentrations change in a predictable pattern and may be related to other biological changes that could be measured in blood and urine. These hormonal fluctuations have been shown to exert physiological changes in several organs including the cardiovascular system leading to alterations in nutrient metabolism (Citation54–56). Changes in serum zinc and magnesium could be driven by fluctuations in serum estrogen concentrations, with higher concentrations of estradiol (the main estrogen produced in the ovary) suppressing these biomarker concentrations (Citation7, Citation57). Typically, estradiol concentration is lowest during menses and increases thereafter, reaching peak value in the late follicular phase; it drops before or immediately after ovulation. It starts to rise again around day 5 post-ovulation, with a surge (a second peak) at the midluteal phase, coinciding with the progesterone peak (Citation58, Citation59). The negative correlation between estradiol and zinc concentrations in this study supports the potential suppressive effect of estrogen on serum zinc concentration.
Furthermore, the use of estrogen and progestogen-based OCs is reported to cause alteration (decrease) in serum zinc concentrations and increased copper concentrations (Citation57, Citation60). An analysis of the 1999–2006 National Health and Nutrition Examination Survey (NHANES) data revealed that the use of hormonal contraceptives was positively associated with ferritin concentration (Citation61). Other large population-based studies have reported negative associations between history of OC use and iron deficiency, iron deficiency anemia, and anemia, as well as lower odds of vitamin A deficiency in OC users (Citation62, Citation63).
In the current study, the mean for all iron biomarkers, including serum iron, ferritin, and hemoglobin, remained relatively stable across the menstrual cycle, contrary to previous reports (Citation45, Citation64). In one cross-sectional study using NHANES II data, mean values of hemoglobin and serum ferritin were lowest for the group in whom blood draws occurred during menses compared to those measured in the luteal or late luteal phase of the menstrual cycle (Citation13). Similarly, results from a prospective study showed that hepcidin, serum iron, and transferrin saturation concentrations were lowest during menses, increased at mid-cycle, and became stable during the luteal phase (Citation64). Our study was not powered to detect statistical differences in these iron biomarkers, and we did not observe significant differences in iron status or anemia to be similar across the menstrual cycle.
Across the menstrual cycle, mean serum retinol concentration remained fairly constant and no subject was deficient. Previous studies have reported that serum retinol concentration remains fairly constant across the menstrual cycle, with negligible day-to-day variations (Citation65), consistent with results from the current study. However, other studies have observed the lowest serum retinol concentration during menstruation and rising to peak values around cycle day 14 (n = 6–20) (Citation46, Citation47). Future studies should examine these potential changes in populations with low and high vitamin A deficiency.
While there is little reported evidence on biomarker mass, the estimated circulating zinc mass from this study is within the expected range in healthy women. Serum magnesium constitutes about 0.3% of the total body content of ∼24 g (Citation66). The mean estimate from this study is ∼0.2% of the expected value of ∼24 g. These estimates are reasonable, given the high prevalence of magnesium deficiency in our population. Previous studies have shown that among women aged 18–60 y, 25–27% of Polish and French, and 40% of UK women had magnesium intakes below the EAR (Citation67). About 45% of Americans ≥ 2 y do not meet EAR for magnesium (Citation68). An estimated drop of 80–90% magnesium content in fruits and vegetables over the last 100 y has been linked to the high prevalence of magnesium deficiency in the US and UK (Citation69).
In the US, young children and women of reproductive age have the highest risk for micronutrient deficiencies. For instance, the prevalence of zinc deficiency (low serum zinc concentration) was reported to be 8.2% among females (≥10 y) based on data from NHANES 2011–2014 (Citation53). For vitamin A, the prevalence of deficiency is reported to be around 1% in women of reproductive-age (NHANES III) (Citation70). Similarly, in women of childbearing age, the prevalence of anemia, ID and IDA is 6.9%, 15.7%, and 4.5%, respectively, based on data from NHANES 1999–2006 (Citation71, Citation72). Subsequent analysis of NHANES 2007–2010 data for nonpregnant women aged 15–49 y, showed ID and IDA prevalence of 10.4% and 5.0% respectively (Citation61, Citation73). Prevalence estimates based on biomarker concentrations for magnesium, copper, and manganese are limited for the US population. The prevalence of inadequate micronutrient intake (% of population below estimated average requirement [EAR]) among US adults (≥19 years, 2005–2016 NHANES) for magnesium and copper are 53% and 6%, respectively (Citation74). Overall, the prevalence estimates for the current study are comparable to previous studies in the US.
Though our study did not detect a statistically significant difference in deficiency prevalence for most micronutrients, we saw that differences were remarkably large between menstrual phases. Fluctuations in micronutrient concentration across the menstrual cycle may lead to different estimates of deficiencies in the population, depending on the cycle phase when measurements occur. Thus, the prevalence of certain micronutrient deficiencies may be dependent on the cycle phase when measurements are conducted. This could potentially lead to misclassification of the public health significance of the deficiency depending on the days of the menstrual cycle when blood samples are collected.
Biomarkers are important for clinical care, and findings suggest that clinicians should take note of the fluctuation of micronutrient concentrations, especially when ordering tests for serum zinc or magnesium, and also advise their patients as appropriate. In clinical settings, a patient may be classified as zinc deficient or not depending on which phase of the menstrual cycle blood samples are collected to assess zinc status and could lead to an intervention where none is needed and vice-versa. Studies adequately powered to examine micronutrient deficiencies and anemia across the menstrual cycle should be conducted.
The strengths of this study include a careful design to include healthy women with normal menstrual cycles and BMI. Subjects were carefully tracked, and visits were timed to specific menstrual cycle phases to reflect concentrations of key ovarian cycle hormones. Biomarkers for several micronutrients were measured in this study, which is not often possible in nutrition studies. This study also has some limitations. Most of the study participants were nulliparous, which may limit the applicability of these findings to parous women. It also remains unclear if these findings would apply to women with overweight or obesity or women with irregular menstrual cycles.
In conclusion, serum zinc and magnesium concentrations declined, and magnesium deficiency increased across the menstrual cycle in healthy women of reproductive age. Other micronutrients followed a similar pattern but results in this small study were not statistically significant. Our results suggest that in healthy, reproductive-age women, the menstrual cycle should be considered when evaluating serum zinc and magnesium concentrations, and studies should attempt to align measurements to the same point in the cycle or, at minimum, collect information on the cycle timing to improve the interpretation of findings. Larger studies powered to examine multiple micronutrients and deficiency prevalence should be conducted, and research design should consider the menstrual phase in evaluating micronutrient status for all females of reproductive age. Future studies should also examine the relationship between ovarian hormones and micronutrient concentrations.
Supplemental Material
Download ()
Acknowledgments
We would like to thank the following individuals and groups at The Pennsylvania State University: Dr. A. Catharine Ross and her laboratory team for performing the retinol assays; Suzanne Strickland Simons of Dr. Murray-Kolb’s laboratory for performing the complete blood count including hemoglobin measurements; Dr. Mary Jane De Souza, Director of the Women’s Health and Exercise Laboratory, and her team for the hormones assays; Matthew S. Gonzales and David R. Welsch of the Laboratory for Isotopes and Metals in the Environment (LIME) for support with measuring zinc, copper, magnesium, manganese, and iron. Special thanks also go to the medical staff, especially Tracey Allen and Cynthia Flanagan, at the Clinical Research Center of The Pennsylvania State University’s Clinical and Translational Science Institute. The authors sincerely acknowledge the research support provided by several research assistants, particularly Leigh A. Taylor. We also thank the volunteers for their participation in the study.
Disclosure statement
No potential conflict of interest was reported by the authors.
Additional information
Funding
References
- Dale JC, Burritt MF, Zinsmeister AR. Diurnal variation of serum iron, iron-binding capacity, transferrin saturation, and ferritin levels. Am J Clin Pathol. 2002;117(5):802–8. doi:10.1309/2YT4-CMP3-KYW7-9RK1.
- Nguyen LT, Buse JD, Baskin L, Sadrzadeh SMH, Naugler C. Influence of diurnal variation and fasting on serum iron concentrations in a community-based population. Clin Biochem. 2017;50(18):1237–42. doi:10.1016/j.clinbiochem.2017.09.018.
- Cooper MJ, Zlotkin SH. Day-to-day variation of transferrin receptor and ferritin in healthy men and women. Am J Clin Nutr. 1996;64(5):738–42. doi:10.1093/ajcn/64.5.738.
- Borel MJ, Smith SM, Derr J, Beard JL. Day-to-day variation in iron-status indices in healthy men and women. Am J Clin Nutr. 1991;54(4):729–35. doi:10.1093/ajcn/54.4.729.
- Favier A, Ruffieux D. Physiological variations of serum levels of copper, zinc, iron and manganese. Biomed Pharmacother. 1983;37(9–10):462–6.
- Schisterman EF, Mumford SL, Sjaarda LA. Failure to consider the menstrual cycle phase may cause misinterpretation of clinical and research findings of cardiometabolic biomarkers in premenopausal women. Epidemiol Rev. 2014;36:71–82. doi:10.1093/epirev/mxt007.
- Muneyvirci-Delale O, Nacharaju V, Altura B, Altura B. Sex steroid hormones modulate serum ionized magnesium and calcium levels throughout the menstrual cycle in women. Fertil Steril. 1998;69(5):958–62. doi:10.1016/s0015-0282(98)00053-3.
- Angeli A, Laine F, Lavenu A, Ropert M, Lacut K, Gissot V, Sacher-Huvelin S, Jezequel C, Moignet A, Laviolle B, et al. Joint model of iron and hepcidin during the menstrual cycle in healthy women. Aaps J. 2016;18(2):490–504. doi:10.1208/s12248-016-9875-4.
- Deuster PA, Dolev E, Bernier LL, Trostmann UH. Magnesium and zinc status during the menstrual cycle. Am J Obstet Gynecol. 1987;157(4 Pt 1):964–8. doi:10.1016/S0002-9378(87)80096-0.
- Michos C, Kalfakakou V, Karkabounas S, Kiortsis D, Evangelou A. Changes in copper and zinc plasma concentrations during the normal menstrual cycle in women. Gynecological Endocrinology. 2010;26(4):250–5. doi:10.3109/09513590903247857.
- Lanje MA, Bhutey AK, Kulkarni SR, Dhawle UP, Sande AS. Serum electrolytes during different phases of menstrual cycle. Int J Pharma Sci Res IJPSR. 2010;1(10):435–7.
- Pandya AK, Chandwani S, Das TK, Pandya KD. Serum calcium, magnesium and inorganic phosphorous levels during various phases of menstrual cycle. Indian J Physiol Pharmacol. 1995;39(4):411–4.
- Kim I, Yetley EA, Calvo MS. Variations in iron-status measures during the menstrual cylce. Am J Clin Nutr. 1993;58(5):705–9. doi:10.1093/ajcn/58.5.705.
- Belza A, Henriksen M, Ersbøll AK, Thilsted SH, Tetens I. Day-to-day variation in iron-status measures in young iron-deplete women. Br J Nutr. 2005;94(4):551–6. doi:10.1079/bjn20051461.
- Inoue K, Sugiyama M. Changes in body iron status, heart rate, and unspecific symptoms across menstrual cycle in marginally iron-deficient young women. J Clin Biochem Nutr. 1998;24(2):99–104. doi:10.3164/jcbn.24.99.
- Cole LA, Ladner DG, Byrn FW. The normal variabilities of the menstrual cycle. Fertil Steril. 2009;91(2):522–7. doi:10.1016/j.fertnstert.2007.11.073.
- Fehring RJ, Schneider M, Raviele K. Variability in the phases of the menstrual cycle. J Obstet Gynecol Neonatal Nurs. 2006;35(3):376–84. doi:10.1111/j.1552-6909.2006.00051.x.
- Treloar AE, Boynton RE, Behn BG, Brown BW. The menstrual cycle- variation of the human menstrual cycle through the reproductive life. Int J Fertil. 1967;12(1 Pt 2):77–126.
- Chiazze L, Brayer FT, Macisco JJ, Parker MP, Duffy BJ. The length and variability of the human menstrual cycle. JAMA. 1968;203(6):377–80. doi:10.1001/jama.1968.03140060001001.
- Buchheit M, Laursen PB, Al Haddad H, Ahmaidi S. Exercise-induced plasma volume expansion and post-exercise parasympathetic reactivation. Eur J Appl Physiol. 2009;105(3):471–81. doi:10.1007/s00421-008-0925-1.
- Rhibi F, Prioux J, Attia MB, Hackney AC, Zouhal H, Abderrahman AB. Increase interval training intensity improves plasma volume variations and aerobic performances in response to intermittent exercise. Physiol Behav. 2019;199:137–45. doi:10.1016/j.physbeh.2018.11.020.
- Kalra PR, Anagnostopoulos C, Bolger AP, Coats AJ, Anker SD. The regulation and measurement of plasma volume in heart failure. J Am Coll Cardiol. 2002;39(12):1901–8. doi:10.1016/s0735-1097(02)01903-4.
- Schrier RW, Howard RL. Unifying hypothesis of sodium and water regulation in health and disease. Hypertension. 1991;18(5 Suppl):III164–168. doi:10.1161/01.hyp.18.5_suppl.iii164.
- Hammersborg SM, Farstad M, Haugen O, Kvalheim V, Onarheim H, Husby P. Time course variations of haemodynamics, plasma volume and microvascular fluid exchange following surface cooling: An experimental approach to accidental hypothermia. Resuscitation. 2005;65(2):211–9. doi:10.1016/j.resuscitation.2004.11.020.
- Kenefick RW, Sollanek KJ, Charkoudian N, Sawka MN. Impact of skin temperature and hydration on plasma volume responses during exercise. J Appl Physiol (1985). 2014;117(4):413–20. doi:10.1152/japplphysiol.00415.2014.
- Bloomer RJ, Farney TM. Acute plasma volume change with high-intensity sprint exercise. J Strength Condition Res. 2013;27(10):2874–8. doi:10.1519/JSC.0b013e318282d416.
- Jimenez C, Melin B, Koulmann N, Allevard AM, Launay JC, Savourey G. Plasma volume changes during and after acute variations of body hydration level in humans. Eur J Appl Physiol. 1999;80(1):1–8. doi:10.1007/s004210050550.
- Aguree S, Gernand AD. A methodology for examining the association between plasma volume and micronutrient biomarker mass and concentration in healthy eumenorrheic women. PeerJ. 2020;8:e10535. doi:10.7717/peerj.10535.
- Hambridge HL, Mumford SL, Mattison DR, Ye A, Pollack AZ, Bloom MS, Mendola P, Lynch KL, Wactawski-Wende J, Schisterman EF. The influence of sporadic anovulation on hormone levels in ovulatory cycles. Human Reprod. 2013;28(6):1687–94. doi:10.1093/humrep/det090.
- Lynch KE, Mumford SL, Schliep KC, Whitcomb BW, Zarek SM, Pollack AZ, Bertone-Johnson ER, Danaher M, Wactawski-Wende J, Gaskins AJ, et al. Assessment of anovulation in eumenorrheic women: Comparison of ovulation detection algorithms. Fertil Steril. 2014;102(2):511–8. e512,
- Aguree S, Bethancourt HJ, Taylor LA, Rosinger AY, Gernand AD. Plasma volume variation across the menstrual cycle among healthy women of reproductive age: A prospective cohort study. Physiol Rep. 2020;8(8):e14418. doi:10.14814/phy2.14418.
- Hess SY, Peerson JM, King JC, Brown KH. Use of serum zinc concentration as an indicator of population zinc status. Food Nutr Bull. 2007;28(3 Suppl):S403–S429. doi:10.1177/15648265070283S303.
- IOM: Institute of Medicine, Food and Nutrition Board. Dietary reference intakes for vitamin a, vitamin k, arsenic, boron, chromium, copper, iodine, iron, manganese, molybdenum, nickel, silicone, vanadium, and zinc. Washington (DC): National Academies Press, 2001.
- Grober U, Schmidt J, Kisters K. Magnesium in prevention and therapy. Nutrients. 2015;7(9):8199–226. doi:10.3390/nu7095388.
- Iyengar V, Woittiez J. Trace elements in human clinical specimens: Evaluation of literature data to identify reference values. Clin Chem. 1988;34(3):474–81.
- WHO. Serum ferritin concentrations for the assessment of iron status and iron deficiency in populations. Vitamin and mineral nutrition information system. Geneva, World Health Organization, 2011. (who/nmh/nhd/mnm/11.2). (http://www.Who.Int/vmnis/indicators/serum_ferritin.Pdf, accessed March 26, 2019).
- WHO. Serum retinol concentrations for determining the prevalence of vitamin a deficiency in populations. Vitamin and mineral nutrition information system. Geneva, World Health Organization, 2011. (who/nmh/nhd/mnm/11.3) (http://www.Who.Int/vmnis/indicators/retinol.Pdf, accessed March 26, 2019).
- CDC. Centers for Disease Control and Prevention. Recommendations to prevent and control iron deficiency in the united states. Morbidity Mortality Weekly Report Recommend Report. 1998;47(RR-3):1–29.
- WHO/CDC. Assessing the iron status of populations: Report of a joint world health organization/centers for disease control and prevention technical consultation on the assessment of iron status at the population level. Geneva, Switzerland 6–8 April 2004. WHO Library Cataloguing-In-Publication Data 2007. [cited July 21 2017]. http://whqlibdoc.Who.Int/publications/2004/9241593156_eng.Pdf.
- Thurnham D, McCabe G, Northrop-Clewes C, Nestel P. Effects of subclinical infection on plasma retinol concentrations and assessment of prevalence of vitamin a deficiency: Meta-analysis. Lancet. 2003;362(9401):2052–8. doi:10.1016/s0140-6736(03)15099-4.
- Fiorentino M, Perignon M, Kuong K, Chamnan C, Berger J, Wieringa FT. Subclinical inflammation affects iron and vitamin a but not zinc status assessment in senegalese children and cambodian children and women. Public Health Nutr. 2018;21(7):1266–77. doi:10.1017/S1368980017003809.
- Aguree S, Gernand AD. An efficient method for measuring plasma volume using indocyanine green dye. MethodsX. 2019;6:1072–83. doi:10.1016/j.mex.2019.05.003.
- Aguree S, Murray-Kolb LE, Diaz F, Gernand AD. Menstrual cycle-associated changes in micronutrient biomarkers concentration: A prospective cohort study. Dryad Digital Repository. 2021; 5 October 2021. https://doi.org/10.5061/dryad.547d7wm90.
- Rosenstein DL, Ryschon TW, Niemela JE, Elin RJ, Balaban RS, Rubinow DR. Skeletal muscle intracellular ionized magnesium measured by 31p-nmr spectroscopy across the menstrual cycle. J Am Coll Nutr. 1995;14(5):486–90. doi:10.1080/07315724.1995.10718540.
- Chandra S, Gupta N, Patel S. Study of iron status indicators in different phases of menstrual cycle in first year medical college females. Int J Res Med Sci. 2017;5(1):46–49. doi:10.18203/2320-6012.ijrms20164520.
- Brabin L, Roberts C, Barr F, Agbaje S, Harper G, Briggs N. Sex hormone patterns and serum retinol concentrations in adolescent girls. J Reproduct Med. 2004;49(1):42–51.
- Laurence PA, Sobel AE. Changes in serum vitamin a level during the human menstrual cycle. J Clin Endocrinol Metab. 1953;13(10):1192–200. doi:10.1210/jcem-13-10-1192.
- Mumford SL, Browne RW, Schliep KC, Schmelzer J, Plowden TC, Michels KA, Sjaarda LA, Zarek SM, Perkins NJ, Messer LC, et al. Serum antioxidants are associated with serum reproductive hormones and ovulation among healthy women. J Nutr. 2016;146(1):98–106. doi:10.3945/jn.115.217620.
- Halls DJ, Fell GS. Determination of manganese in serum and urine by electrothermal atomic absorption spectrometry. Anal Chim Acta. 1981;129:205–11. doi:10.1016/S0003-2670(01)84133-7.
- Rükgauer M, Klein J, Kruse-Jarres JD. Reference values for the trace elements copper, manganese, selenium, and zinc in the serum/plasma of children, adolescents, and adults. J Trace Elem Med Biol. 1997;11(2):92–8. doi:10.1016/S0946-672X(97)80032-6.
- Milne D, Sims R, Ralston N. Manganese content of the cellular components of blood. Clin Chem. 1990;36(3):450–2.
- Gbemavo MCJ, Bouchard MF. Concentrations of lead, mercury, selenium, and manganese in blood and hand grip strength among adults living in the United States (nhanes 2011–2014). Toxics. 2021;9(8):189. doi:10.3390/toxics9080189.
- Hennigar SR, Lieberman HR, Fulgoni VL, 3rd, McClung JP. Serum zinc concentrations in the us population are related to sex, age, and time of blood draw but not dietary or supplemental zinc. J Nutr. 2018;148(8):1341–51. doi:10.1093/jn/nxy105.
- Oosthuyse T, Bosch AN. The effect of the menstrual cycle on exercise metabolism: Implications for exercise performance in eumenorrhoeic women. Sports Med. 2010;40(3):207–27. doi:10.2165/11317090-000000000-00000.
- Draper CF, Duisters K, Weger B, Chakrabarti A, Harms AC, Brennan L, Hankemeier T, Goulet L, Konz T, Martin FP, et al. Menstrual cycle rhythmicity: Metabolic patterns in healthy women. Sci Rep. 2018;8(1):14568. doi:10.1038/s41598-018-32647-0.
- Wohlgemuth KJ, Arieta LR, Brewer GJ, Hoselton AL, Gould LM, Smith-Ryan AE. Sex differences and considerations for female specific nutritional strategies: A narrative review. J Int Soc Sports Nutr. 2021;18(1):27. doi:10.1186/s12970-021-00422-8.
- Prema K, Ramalakshmi BA, Babu S. Serum copper and zinc in hormonal contraceptive users. Fertil Steril. 1980;33(3):267–71. doi:10.1016/s0015-0282(16)44591-7.
- Alliende ME. Mean versus individual hormonal profiles in the menstrual cycle. Fertil Steril. 2002;78(1):90–5. doi:10.1016/s0015-0282(02)03167-9.
- Allen AM, McRae-Clark AL, Carlson S, Saladin ME, Gray KM, Wetherington CL, McKee SA, Allen SS. Determining menstrual phase in human biobehavioral research: A review with recommendations. Exp Clin Psychopharmacology. 2016;24(1):1–11. doi:10.1037/pha0000057.
- Vir SC, Love AH. Zinc and copper nutriture of women taking oral contraceptive agents. Am J Clin Nutr. 1981;34(8):1479–83. doi:10.1093/ajcn/34.8.1479.
- Miller EM. Iron status and reproduction in us women: National health and nutrition examination survey, 1999–2006. PLoS One. 2014;9(11):e112216. doi:10.1371/journal.pone.0112216.
- Haile ZT, Teweldeberhan AK, Chavan B, Francescon J. Hormonal contraceptive use and vitamin a deficiency among women in Tanzania. Int J Gynecol Obstet. 2018;141(1):20–5. doi:10.1002/ijgo.12396.
- Haile ZT, Kingori C, Teweldeberhan AK, Chavan B. The relationship between history of hormonal contraceptive use and iron status among women in tanzania: A population-based study. Sex Reproduct Healthcare. 2017;13:97–102. doi:10.1016/j.srhc.2017.07.003.
- Lainé F, Angeli A, Ropert M, Jezequel C, Bardou-Jacquet E, Deugnier Y, Gissot V, Lacut K, Sacher-Huvelin S, Lavenu A, et al. Variations of hepcidin and iron-status parameters during the menstrual cycle in healthy women. Br J Haematol. 2016;175(5):980–2. doi:10.1111/bjh.13906.
- Söderlund M, Sjöberg A, Svärd G, Fex G, Nilsson-Ehle P. Biological variation of retinoids in man. Scandin J Clin Lab Invest. 2002;62(7):511–9. doi:10.1080/003655102321004521.
- Jahnen-Dechent W, Ketteler M. Magnesium basics. Clin Kidney J. 2012;5(Suppl 1):i3–i14. doi:10.1093/ndtplus/sfr163.
- Mensink GB, Fletcher R, Gurinovic M, Huybrechts I, Lafay L, Serra-Majem L, Szponar L, Tetens I, Verkaik-Kloosterman J, Baka A, et al. Mapping low intake of micronutrients across europe. Br J Nutr. 2013;110(4):755–73. doi:10.1017/S000711451200565X.
- Fulgoni VL, 3rd, Keast DR, Bailey RL, Dwyer J. Foods, fortificants, and supplements: Where do americans get their nutrients? J Nutr. 2011;141(10):1847–54. doi:10.3945/jn.111.142257.
- Workinger JL, Doyle RP, Bortz J. Challenges in the diagnosis of magnesium status. Nutrients. 2018;10(9):1202. doi:10.3390/nu10091202.
- Ballew C, Bowman BA, Sowell AL, Gillespie C. Serum retinol distributions in residents of the united states: Third national health and nutrition examination survey, 1988–1994. Am J Clin Nutri. 2001;73(3):586–93. doi:10.1093/ajcn/73.3.586.
- Cusick SE, Mei Z, Freedman DS, Looker AC, Ogden CL, Gunter E, Cogswell ME. Unexplained decline in the prevalence of anemia among us children and women between 1988–1994 and 1999–2002. Am J Clin Nutri. 2008;88(6):1611–7. doi:10.3945/ajcn.2008.25926.
- Cogswell ME, Looker AC, Pfeiffer CM, Cook JD, Lacher DA, Beard JL, Lynch SR, Grummer-Strawn LM. Assessment of iron deficiency in us preschool children and nonpregnant females of childbearing age: National health and nutrition examination survey 2003–2006. Am J Clin Nutr. 2009;89(5):1334–42. doi:10.3945/ajcn.2008.27151.
- Gupta PM, Hamner HC, Suchdev PS, Flores-Ayala R, Mei Z. Iron status of toddlers, nonpregnant females, and pregnant females in the united states. Am J Clin Nutr. 2017;106(Suppl 6):1640S–6S. doi:10.3945/ajcn.117.155978.
- Reider CA, Chung RY, Devarshi PP, Grant RW, Hazels Mitmesser S. Inadequacy of immune health nutrients: Intakes in us adults, the 2005–2016 nhanes. Nutrients. 2020;12(6):1735. doi:10.3390/nu12061735.