
ABSTRACT
The placenta is important in providing a healthy environment for the fetus and plays a central role in the pathophysiology of preeclampsia (PE). Fetal and placental developments are influenced by epigenetic programming. There is some evidence that PE is controlled to an altered circadian homeostasis. In a nested case–control study embedded in the Rotterdam Periconceptional Cohort, we obtained placental tissue, umbilical cord leukocytes (UCL), and human umbilical venous endothelial cells of 13 early-onset PE, 16 late-onset PE and 83 controls comprising 36 uncomplicated and 47 complicated pregnancies, i.e. 27 fetal growth restricted and 20 spontaneous preterm birth. To investigate the associations between PE and the epigenetics of circadian clock and clock-controlled genes in placental and newborn tissues, genome-wide DNA methylation analysis was performed using the Illumina HumanMethylation450K BeadChip and a candidate-gene approach using ANCOVA was applied on 939 CpGs of 39 circadian clock and clock-controlled genes. DNA methylation significantly differed in early-onset PE compared with spontaneous preterm birth at 6 CpGs in placental tissue (3.73E-5 ≤ p ≤ 0.016) and at 21 CpGs in UCL (1.09E-5≤ p ≤ 0.024). In early-onset PE compared with fetal growth restriction 2 CpGs in placental tissue (p < 0.05) and 8 CpGs in uncomplicated controls (4.78E-5≤ p ≤ 0.049) were significantly different. Moreover, significantly different DNA methylation in early-onset PE compared with uncomplicated controls was shown at 6 CpGs in placental tissue (1.36E-4≤ p ≤ 0.045) and 11 CpGs in uncomplicated controls (2.52E-6≤ p ≤ 0.009). No significant associations were shown with late-onset PE between study groups or tissues. The most differentially methylated CpGs showed hypomethylation in placental tissue and hypermethylation in uncomplicated controls. In conclusion, DNA methylation of circadian clock and clock-controlled genes demonstrated most differences in UCL of early-onset PE compared with spontaneous preterm birth. Implications of the tissue-specific variations in epigenetic programming for circadian performance and long-term health need further investigation.
Introduction
The placenta serves as the maternal–fetal interface during pregnancy and is one of the main determinants of pregnancy course and outcome. It also functions as an endocrine organ and plays a major role in maternal adaptation to pregnancy and fetal growth and development (Burton & Jauniaux, Citation2015; Burton et al., Citation2016). Preeclampsia (PE) is a multiorgan disorder in which impaired placental functioning due to excessive oxidative stress is involved (Steegers et al., Citation2010). PE can affect the maternal liver, kidneys, brain and clotting system and is often complicated with fetal growth restriction (FGR) and preterm birth (PTB).
The internal body clock is of main importance in the regulation of the metabolic and hormonal states during reproduction and pregnancy (Andraweera et al., Citation2013; Cha et al., Citation2012; Olcese, Citation2012; Valenzuela et al., Citation2015). All tissues and cells, including the placenta, have a circadian clock, which is kept synchronous by the master clock (Balsalobre et al., Citation1998; McNamara et al., Citation2001). The circadian clock imposes 24-hour rhythmicity of behavior, physiology, and metabolism. The mammalian circadian system is regulated by the circadian master clock, located in the suprachiasmatic nuclei and receiving light input from the retina to keep synchrony with the light–dark cycle. Evidence is accumulating that circadian misalignment significantly impacts pregnancy and health during the life course (Roenneberg & Merrow, Citation2016). Recent reports, studying women working night shifts (in services such as healthcare, military, protection and airway), show associations between disrupting the light–dark cycle during pregnancy and a higher risk of PTB, low birth weight, spontaneous abortion and subfertility (Knutsson, Citation2003; Mahoney, Citation2010; Waddell et al., Citation2012). So far, however, only a few data are available on associations between alterations of the circadian rhythm and PE (Ditisheim et al., Citation2013; Haelterman et al., Citation2007; Mozurkewich et al., Citation2000; Wergeland & Strand, Citation1997). In this regard of interest is the hormone melatonin, which is regulated by the circadian clock and synthesized by the placenta thereby protecting against excessive oxidative stress involved in the pathogenesis of PE (Chen et al., Citation2013; Hobson et al., Citation2013; Valenzuela et al., Citation2015).
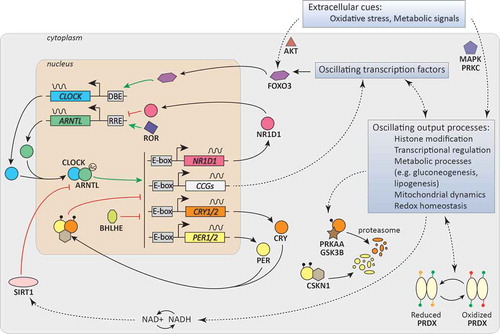
Epigenetic mechanisms implicated in fetal and placental development can explain associations between PE and increased risks of features of noncommunicable diseases in mothers and children (Barker, Citation1993; Gluckman et al., Citation2008; Hanson & Gluckman, Citation2008; Jaddoe et al., Citation2014). Altered DNA methylation patterns are found in placental tissues of PE and are associated with maternal blood pressure and excessive oxidative stress (Kulkarni et al., Citation2011). Approximately 10% of the transcriptome is under circadian regulation, and, at the molecular level, the circadian oscillator is composed of a set of clock genes that act in interconnected transcription/translation feedback loops (Panda et al., Citation2002; Panda et al., Citation2002; Zhang et al., Citation2014) (see for a schematic overview of the regulation of the molecular clock). ARNTL (also known as BMAL1) and CLOCK are the positive activators and drive the transcription of clock genes by binding to E-box elements on their promoters. PER and CRY inhibit the specific transcription activation by ARNTL and CLOCK, thereby forming a negative feedback loop. An additional loop is formed by NR1D1 (also known as Rev-Erbα), which represses ARNTL transcription. The period length of the circadian clock cycle is fine-tuned by posttranslational modifications, such as phosphorylation and ubiquitylation, that regulate clock protein stability.
Figure 1. Circadian clock. Model of the circadian core oscillator, showing the main core clock genes and transcription/translation feedback loops, as well as clock (controlled) genes (CCGs) that link the molecular clock to oscillating output processes. The core clock proteins are depicted as circles (CLOCK, ARNTL, CRY, PER, NR1D1).
From this background, we hypothesize that PE is associated with alterations in tissue-specific epigenetic programming of circadian clock (controlled) gene loci in placental and newborn tissues. The objective of our study was to examine the DNA methylation of circadian clock and clock-controlled genes in the placenta, umbilical cord leukocytes (UCL) and human umbilical vein endothelial cells (HUVEC) in relation to PE. Because of clear differences in pathophysiology, we selected a group of early-onset PE (EOPE, onset <34 weeks of gestation) and late-onset PE (LOPE, onset ≥34 weeks of gestation) (Brown et al., 2013; Dekker et al., 2014). In addition, because PE is often complicated with FGR and PTB, conditions known to also affect epigenetic programming, we investigated the DNA methylation of PE in comparison with non-PE controls, FGR and spontaneous PTB as additional non-PE control groups.
Material and methods
Study design
A nested case–control study was conducted and embedded in the Rotterdam Periconceptional Cohort (Predict Study), a prospective tertiary hospital-based study of the Department of Obstetrics and Gynecology, Erasmus University Medical Center, Rotterdam, the Netherlands (Steegers-Theunissen et al., 2015). The study has been approved by the local Medical Ethical and Institutional Review Board of the Erasmus University Medical Center (MEC-2004-227). At enrolment, all participants signed written informed consent before participation.
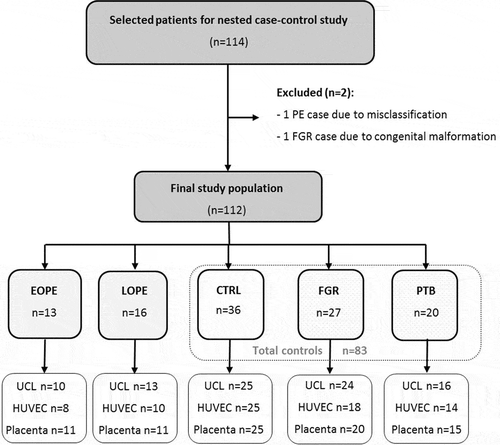
Patients with EOPE and LOPE were enrolled as well as controls without PE (). Controls were divided into three different study groups: uncomplicated controls and complicated controls comprising of FGR and spontaneous PTB. The rational is that EOPE often is accompanied with adverse outcomes such as PTB and FGR, and including these additional control groups provides the opportunity to exclude confounding as much as possible by gestational age and birth weight.
Figure 2. Flowchart of the study population. EOPE: early-onset preeclampsia; LOPE: late-onset preeclampsia; CTRL: uncomplicated controls; FGR: fetal growth restriction; PTB: preterm birth; UCL: umbilical cord leukocytes; HUVEC: human umbilical vein endothelial cells.
PE was defined as systolic blood pressure ≥140 mmHg or diastolic blood pressure ≥90 mmHg on at least two occasions 4 hours apart after 20 weeks of gestation with proteinuria (protein/creatinine ratio of ≥30 mg/mmol). EOPE was defined as the onset of the disease <34 weeks of gestation following the International Society for the Study of Hypertension in Pregnancy (ISSHP) guidelines (Brown et al., 2013; Dekker et al., 2014). FGR was defined as a birth weight below the 10th percentile. Patients were included based on an estimated fetal weight below the 10th percentile of ultrasound measurements during pregnancy. This was validated with a birth weight below the 10th percentile according to the reference curves of the Dutch Perinatal Registry. Spontaneous PTB was defined as delivery <37 weeks of gestation. Uncomplicated controls were pregnancies without PE, gestational hypertension, FGR or spontaneous PTB. Clinical data were obtained from medical records.
Sample collection and DNA extraction
UCL: Umbilical cord blood was collected in anticoagulant vacutainer tubes (ethylenediaminetetraacetic acid) and processed within 48 hours after delivery to determine white blood cell count and differentiation and to store the isolated total white blood cell pellets at ‒80°C until DNA extraction. Prior to DNA extraction, thawed UCL were subjected to erythrocyte lysis by use of Erythrocyte Lysis Buffer (Qiagen, Hilden, Germany) according to the manufacturer’s protocol.
Placental tissue: After removal of the membranes and 2 mm of the top placental layer, placental biopsies (0.5 cm3) were taken at four different sites of the fetal side of the placenta in a radius of 3 cm around the umbilical cord insertion. Samples were washed in phosphate buffered saline solution (PBS), frozen in liquid nitrogen and stored at −80°C until DNA extraction. Placental tissue (30 mg) was grinded manually on dry ice. The obtained frozen powder was immediately added to lysis buffer and stored at −80°C until further processing.
HUVEC: The umbilical cord vein was rinsed with cord buffer once and all umbilical cord blood was removed, filled with collagenase solution (1 mg/mL). After incubation for 15 min in a PBS water bath (37°C), detached HUVEC were obtained and purified by magnetic-activated cell separation (MACS) with CD146 MACS MicroBeads (Miltenyi Biotec GmbH, Bergisch Gladbach, Germany). HUVEC pellets were frozen in liquid nitrogen and stored at −80°C until DNA extraction.
The collection and storage process was done in a standardized way by trained researchers.
Genomic DNA was extracted from all tissues using the Allprep DNA/RNA isolation mini kit (Qiagen, Hilden, Germany), using the manufacturer’s protocol, and quantified using absorbance spectrometry.
DNA methylation measurement and pathway-driven gene selection
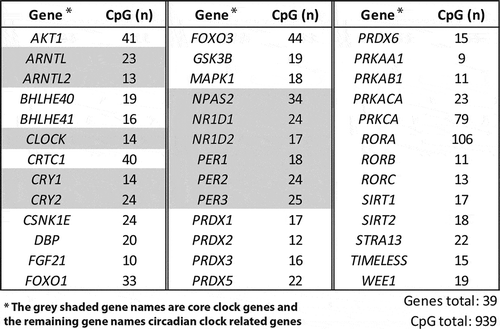
Isolated DNA (500 ng) was treated with sodium bisulfite using the EZ-96 DNA methylation kit (Shallow Well Format) (Zymo Research, Irvine, CA). DNA methylation was measured by using Illumina HumanMethylation450K BeadChip. The methylation module of GenomeStudio (Illumina Inc., San Diego, CA) was used to check the performance of built-in quality controls in the Control Dashboard. CpGs located on the X-chromosome and CpGs containing known single nucleotide polymorphisms were excluded from analysis (Touleimat & Tost, Citation2012). Data were normalized by using the Dasen procedure. Methylation β-values were converted to M-values (M-value = log2 [β-value/(1-β-value)]). To achieve a pathway-driven analysis of DNA methylation at circadian clock (controlled) gene loci, a total of 39 genes were selected (). This included core clock genes, clock-controlled genes, as well as output genes. Considering that PE is associated with metabolic derangements, we especially focused on output genes that are involved in metabolic processes or that have been shown to have a link with the circadian clock and metabolic queues, such as insulin or glucose levels (Chaves et al., Citation2014; Lamia et al., Citation2009; O’Neill & Reddy, Citation2011; Vanselow & Kramer, Citation2007). As shown in , for these 39 genes there are 939 CpGs present in the Illumina 450K array. These CpGs are distributed across the gene loci and are present in CpG-islands around the transcription start, at gene body and at regulatory regions such as the 5ʹ- and 3ʹ-UTR.
Figure 3. Selection of circadian clock and clock-controlled genes and CpGs. AKT1: gene; V-Akt: murine thymoma viral oncogene homolog1; ARNTL: aryl hydrocarbon receptor nuclear translocator-like; ARNTL2: aryl hydrocarbon receptor nuclear translocator-like 2; BHLHE40: basic helix-loop-helix family, member e40; BHLHE41: basic helix-loop-helix family, member e41; CLOCK: clock circadian regulator; CRTC1: CREB-regulated transcription coactivator 1; CRY1: cryptochrome circadian clock 1; CRY2: cryptochrome circadian clock 2; CSNK1E: casein kinase 1, epsilon; DBP: D site of albumin promoter (albumin D-box) binding protein; FGF21: fibroblast growth factor 21; FOXO1: forkhead box O1; FOXO3: forkhead box O3; GSK3B: glycogen synthase kinase 3 beta; MAPK1: mitogen-activated protein kinase 1; NPAS2: neuronal PAS domain protein 2; NR1D1: nuclear receptor subfamily 1, group D, member 1; NR1D2: nuclear receptor subfamily 1, group D, member 2; PER1: period circadian clock 1; PER2: period circadian clock 2; PER3: period circadian clock 3; PRDX1: peroxiredoxin 1; PRDX2: peroxiredoxin 2; PRDX3: peroxiredoxin 3; PRDX5: peroxiredoxin 5; PRDX6: peroxiredoxin 6; PRKAA1: protein kinase, amp-activated, alpha 1 catalytic subunit; PRKAB1: protein kinase, AMP-activated, beta 1 non-catalytic subunit; PRKACA: protein kinase, CAMP-dependent, catalytic, alpha; PRKCA: protein kinase C, alpha; RORA: RAR-controlled orphan receptor A; RORB: RAR-controlled orphan receptor B; RORC: RAR-controlled orphan receptor C; SIRT1: sirtuin 1; SIRT2: sirtuin 2; STRA13: stimulated by retinoic acid 13; TIMELESS: timeless circadian clock; WEE1, WEE1 G2 checkpoint kinase.
Statistical analysis
For statistical analysis of clinical characteristics, analysis of variance (ANOVA) with post hoc Dunnett t-test for pairwise comparisons was used to compare continuous variables between experimental groups. Chi-square or Fischer’s exact testing was used to compare categorical variables. For skewed data Kruskal–Wallis with post hoc Mann–Whitney tests were used.
To test for statistically differentially methylated CpGs (DMCs) in EOPE and LOPE compared to (un)complicated control groups, ANOVA and analysis of covariance (ANCOVA) with post hoc Bonferroni adjustment for multiple comparisons were performed. Although we included spontaneous PTB as an additional control group, in the ANCOVA model adjustments were made for gestational age at delivery and batch effect. Regarding UCL, adjustment for total number of UCL (×109/L) was performed. This information was available from flow-cytometric data of 61 samples (70%). Data imputation was used for missing data on leukocyte counts. We considered results to be statistically significant when p < 0.05. All statistical analyses were performed with R (R: A language and Environment for Statistical Computing, version 3.1.3, 2015 for Windows, R Core Team, Vienna, Austria).
Results
Clinical characteristics
DNA methylation data were available of a total of 114 pregnancies. Exclusion of two pregnancies, which did not meet the inclusion criteria, resulted in a total sample of 112 pregnancies, consisting of 13 patients with EOPE, 16 patients with LOPE, 36 uncomplicated controls, 27 pregnancies complicated by FGR and 20 by spontaneous PTB. In , maternal and newborn characteristics are shown. In line with the selection criteria, blood pressure, gestational age and birth weight differed between PE and (un)complicated control groups. Patients with EOPE and LOPE were more often nulliparous compared to uncomplicated controls (respectively 84.6% and 81.3%, versus 30.6%, p = 0.001). In the EOPE group, more pregnancies were terminated by cesarean section compared to all other groups. Regarding the newborn characteristics, there were no significant differences in gender between the study groups. Gestational age and birth weight differed between all study groups. Although gestational age was still lower in EOPE compared to spontaneous PTB, these two groups were most comparable in gestational age.
Table 1. Maternal and newborn characteristics.
Identification of DMCs between all study groups
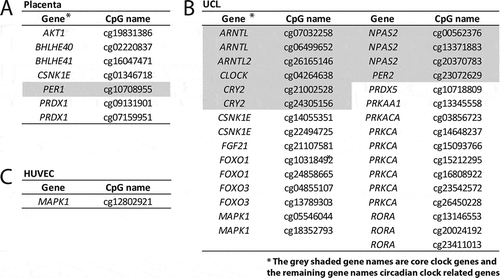
As shown in , we found significant differences in CpG methylation of clock (controlled) genes in all analyzed tissues. The number of DMCs was tissue-specific and most DMCs were found in UCL (n = 31), followed by placenta (n = 7) and HUVEC (n = 1).
Figure 4. Differentially methylated CpGs for the three different tissues. An overall ANOVA was performed to test for differentially methylated CpGs (p < 0.05) between all study groups. UCL: umbilical cord leukocytes; HUVEC: human umbilical vein endothelial cells.
Comparisons of EOPE and LOPE versus (un)complicated controls ()
EOPE significantly differed from spontaneous PTB at six clock (controlled) CpGs in placental tissue, of the genes: AKT1 (p = 8.10E-5), BHLHE41 (p = 0.001), CSKN1E (p = 4.03E-5), PRDX1 (n = 2, p = 3.73E-5 and p = 0.016), and RORA (p = 0.014). As shown in , these CpGs were hypomethylated in EOPE. In addition, in EOPE compared with spontaneous PTB, 21 CpGs were differentially methylated in UCL of the core clock genes: ARNTL (p = 0.001), ARNTL2 (p = 0.022), CLOCK (p = 1.40E-4), CRY2 (n = 2, p = 0.001 and p = 1.84E-4), PER2 (p = 7.72E-5), NPAS2 (n = 4, 2.57E-4 < p < 0.035); and clock-controlled genes: CSKN1E (p = 0.003), FGF21 (p = 4.15E-4), FOXO1 (p = 0.015), GSK3B (p = 0.024), MAPK1 (p = 1.09E-5), PRDX5 (p = 0.003), PRKAA1 (p = 0.002), PRKCA (n = 3, 1.39E-5 < p < 3.89E-4) and RORA (p = 0.018). As shown in , most CpGs were hypermethylated in EOPE.
Figure 5. EOPE and LOPE compared to different control groups (ANCOVA). ANCOVA, adjusted for gestational age at delivery, batch effect, and leukocyte count for UCL only was performed. p Values are shown in the columns. EOPE: early-onset preeclampsia; LOPE: late-onset preeclampsia; CTRL: uncomplicated controls; FGR: fetal growth restriction; PTB: preterm birth; UCL: umbilical cord leukocytes; HUVEC: human umbilical vein endothelial cells; n.s.: not significant.
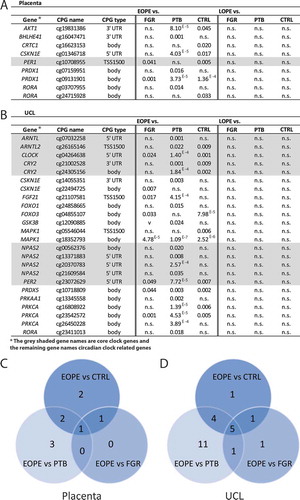
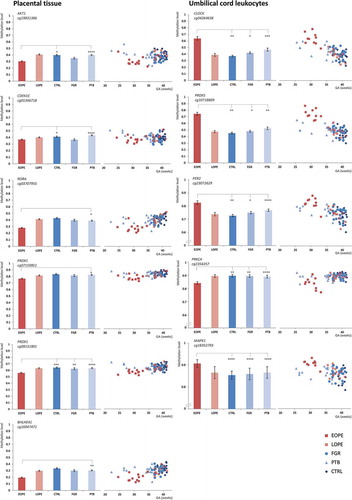
Figure 6. Absolute DNA methylation levels in the EOPE, LOPE and (un)complicated control groups depicted at the gestational age of delivery. EOPE: early-onset preeclampsia; LOPE: late-onset preeclampsia; CTRL: uncomplicated controls; FGR: fetal growth restriction; PTB: preterm birth. *p < 0.05, **p < 0.01, ***p < 0.001, ****p < 1E-4, *****p < 1E-5.
In EOPE compared with FGR, we assessed two DMCs in placental tissue of the genes: PER1 (p = 0.041) and PRDX1 (p = 0.001) and eight DMCs were found in UCL in the same comparison of groups of the core clock genes: CLOCK (p = 0.024) and PER2 (p = 0.049); and clock-controlled genes: CSKN1E (p = 0.007), FGF21 (p = 0.017), FOXO3 (p = 0.033), MAPK1 (p = 4.78E-5), PRDX5 (p = 0.044) and PRKCA (0.001).
EOPE differed from uncomplicated controls at six circadian clock (controlled) CpGs in placental tissue of the genes: AKT1 (p = 0.045), CRTC1 (p = 0.020), CSKN1E (p = 0.017), PER1 (p = 0.005), PRDX1 (1.36E-4) and RORA (p = 0.033), and 11 DMCs were found in UCL in the same comparison of groups of the core clock genes: ARNTL2 (p = 0.009), CLOCK (p = 0.001), CRY2 (n = 2, p = 0.009) and PER2 (p = 0.007), and clock-controlled genes: FOXO3 (7.98E-5), MAPK1 (n = 2, p = 0.006 and p = 2.52E-6), PRDX5 (p = 0.002) and PRKCA (n = 2, p = 0.006 and p = 0.005).
While in the overall analysis one DMC was found in HUVEC, we found no DMCs in HUVEC when comparing EOPE and LOPE to all other study groups. This indicates that the DMCs identified with the overall analysis represent differences between control groups. Also no DMCs were found in LOPE. In , absolute methylation levels are shown for the different groups at different gestational ages.
Discussion
We established tissue-specific alterations in methylation of circadian clock genes in EOPE compared to uncomplicated controls, FGR and spontaneous PTB, but not in any comparison with LOPE. In EOPE compared to spontaneous PTB, we identified in placental tissue DMCs in circadian clock-controlled genes, but not in the circadian core clock genes. In particular, the identification of DMCs in AKT1 and PRDX1 is in line with the oxidative stress imbalance in the placenta ( shows the function of these genes). However, in UCL we identified DMCs in the circadian core clock genes ARNTL, CLOCK (and NPAS2, a CLOCK homolog in some tissues), CRY2 and PER2 in EOPE compared to spontaneous PTB. These genes are necessary for circadian clock function and changes in expression have been associated with noncommunicable diseases, such as metabolic disease and cancer (Barclay et al., Citation2012; Haus & Smolensky, Citation2013).
The most distinct differences were observed in EOPE compared to spontaneous PTB. Gestational age was most comparable between these two groups, which strengthens the hypothesis that PE is associated with differential methylation itself without confounding by gestational age. This is clearly demonstrated in the right part of , where absolute DNA methylation levels in EOPE, LOPE and (un)complicated control groups are depicted at the gestational age of sampling. No differential methylation was observed between LOPE and all other (complicated) control groups. The epigenetic landscape is formed in particular during the periconceptional period and mainly during the first days after conception, supporting the evidence that LOPE largely develops after this period. The alterations in methylation as a memory of exposures in EOPE substantiate the first trimester origin of this PE phenotype. EOPE and LOPE are likely to reflect different underlying biological mechanisms, often indicated as the placental versus the metabolic syndrome (Redman & Sargent, Citation2003).
Previous research showed that clock gene expression can be enhanced by hypoxia in human trophoblast cells in vitro (Frigato et al., Citation2009; Waddell et al., Citation2012). Intermittent placental perfusion, caused by deficient trophoblast invasion of the endometrial arteries, can result in hypoxia-reoxygenation injury. The fluctuation in oxygen concentrations can cause excessive placental oxidative stress and as such alter the establishment of the epigenetic methylation markers (Hung & Burton, Citation2006). This is in line with our finding that in EOPE most DMCs were hypomethylated in placental tissue and hypermethylated in UCL and substantiated by other epigenetic studies of candidate genes in PE (Anton et al., Citation2014; Blair et al., Citation2013; Hogg et al., Citation2013; Sundrani et al., Citation2013; Yuen et al., Citation2010). The opposite direction of methylation in placental tissue and UCL might be explained by differences in tissue sensitivity and the level of exposure. Although an important question is whether the observed changes in DNA methylation result in changes in gene expression, the current data cannot answer this question. Nevertheless, it is noteworthy that the same type of CpGs within a gene (i.e. promoter, body) show methylation changes in the same direction as the identified DMCs, although the differences are not significant (not shown).
Although DNA methylation is considered to be mostly stable, there is a recent study showing that a number of CpGs show circadian oscillation in DNA methylation in mouse liver (Vollmers et al., Citation2012). In order to exclude a possible effect of the time of delivery, we performed an additional statistical analysis in which we did a sensitivity analysis for the time of delivery (supplemental figure, Figure S1). This did not affect the majority of the DMCs identified in the present study, indicating that time of delivery is not a confounding factor in our study.
Epigenetics and health of the offspring
In this study, we hypothesized that PE may be associated with changes in DNA methylation of circadian clock gene loci and leave epigenetic marks during pregnancy in newborn tissues. Alterations in DNA methylation of circadian clock and clock-controlled genes may be a consequence of a situation of excessive oxidative stress during exposure to this disorder. However, either cause or consequence, we showed in this study that an altered methylation level was present in some clock (controlled) genes in placental and fetal tissues after EOPE. This suggests that the epigenome of EOPE offspring might be affected as well. This is supported by our observation that differential methylation is higher in UCL than in placenta, suggesting that the alterations observed in placenta further induced epigenetic alterations in UCL (as a consequence of an imbalanced cellular environment due to placental malfunctioning and excessive oxidative stress). This is in line with the Developmental Origins of Health and Disease (DOHaD) paradigm (Barker, Citation1993). Unfortunately, we were not able to study DNA methylation of the offspring after follow-up. For future research, it is essential to validate these findings with data of the transcriptome and subsequently to measure DNA methylation and expression levels in these children and monitor the functioning of their circadian clock.
Strengths and limitations
As far as we know, this is the first study investigating DNA methylation of circadian clock-controlled genes in unique homogeneous study groups of EOPE and LOPE cases, and spontaneous PTB, FGR and uncomplicated controls. We were able to study three different tissues in most pregnancies collected in a standardized and high-quality manner. The external validity of the study is limited which is inherent to the tertiary hospital setting in which the study was performed. Moreover, the small number of samples, in particular of HUVEC, and the heterogeneity of cell types in placental tissues remain issues of potential bias (Grigoriu et al., Citation2011; Joo et al., Citation2013). Another limitation is that we do not have information about the circadian clock and light exposure of the participants to test for correlations with the results.
Conclusion
DNA methylation status of circadian clock and clock-controlled genes in placental tissue and UCL is different between patients with EOPE and non-PE controls. This may be explained by a longer exposure to placental oxidative stress as compared to pregnancies complicated by LOPE. For future research, it would be interesting to study whether these DNA methylation alterations affect long-term health and circadian performance in the offspring.
Condensation and short version of title
Only EOPE is associated with variations in DNA methylation of circadian clock and clock-controlled genes in placental tissue, and UCL.
Declaration of interest
The authors declare no conflict of interest and disclose any financial, consulting, and personal relationships with people or organizations that could be perceived by readers as influencing (biasing) the author’s work. The authors declare they did not make use of any scientific writing assistance.
lcbi-2016-0246-File008.tif
Download TIFF Image (1.1 MB)Supplemental Material
Supplemental data for this article can be accessed at www.tandfonline.com/icbi.
Related Research Data
References
- Andraweera PH, Dekker GA, Dissanayake VH, et al. (2013). Vascular endothelial growth factor family gene polymorphisms in preeclampsia in Sinhalese women in Sri Lanka. J Matern Fetal Neonatal Med. 26:532–6.
- Anton L, Brown AG, Bartolomei MS, et al. (2014). Differential methylation of genes associated with cell adhesion in preeclamptic placentas. PLoS One. 9:e100148.
- Balsalobre A, Damiola F, Schibler U. (1998). A serum shock induces circadian gene expression in mammalian tissue culture cells. Cell. 93:929–37.
- Barclay JL, Husse J, Bode B, et al. (2012). Circadian desynchrony promotes metabolic disruption in a mouse model of shiftwork. PLoS One. 7:e37150.
- Barker DJ. (1993). The intrauterine origins of cardiovascular disease. Acta Paediatr Suppl. 82:93–9; discussion 100.
- Blair JD, Yuen RK, Lim BK, et al. (2013). Widespread DNA hypomethylation at gene enhancer regions in placentas associated with early-onset pre-eclampsia. Mol Hum Reprod. 19:697–708.
- Burton GJ, Jauniaux E. (2015). What is the placenta? Am J Obstet Gynecol. 213:S6–8.
- Burton GJ, Fowden AL, Thornburg KL. (2016). Placental origins of chronic disease. Physiol Rev. 96:1509–65.
- Cha J, Sun X, Dey SK. (2012). Mechanisms of implantation: Strategies for successful pregnancy. Nat Med. 18:1754–67.
- Chaves I, van der Horst GT, Schellevis R, et al. (2014). Insulin-FOXO3 signaling modulates circadian rhythms via regulation of clock transcription. Curr Biol. 24:1248–55.
- Chen YC, Sheen JM, Tiao MM, et al. (2013). Roles of melatonin in fetal programming in compromised pregnancies. Int J Mol Sci. 14:5380–401.
- Ditisheim AJ, Dibner C, Philippe J, et al. (2013). Biological rhythms and preeclampsia. Front Endocrinol (Lausanne). 4:47
- Frigato E, Lunghi L, Ferretti ME, et al. (2009). Evidence for circadian rhythms in human trophoblast cell line that persist in hypoxia. Biochem Biophys Res Commun. 378:108–11.
- Gluckman PD, Hanson MA, Cooper C, et al. (2008). Effect of in utero and early-life conditions on adult health and disease. N Engl J Med. 359:61–73.
- Grigoriu A, Ferreira JC, Choufani S, et al. (2011). Cell specific patterns of methylation in the human placenta. Epigenetics. 6:368–79.
- Haelterman E, Marcoux S, Croteau A, et al. (2007). Population-based study on occupational risk factors for preeclampsia and gestational hypertension. Scand J Work Environ Health. 33:304–17.
- Hanson MA, Gluckman PD. (2008). Developmental origins of health and disease: New insights. Basic Clin Pharmacol Toxicol. 102:90–3.
- Haus EL, Smolensky MH. (2013). Shift work and cancer risk: Potential mechanistic roles of circadian disruption, light at night, and sleep deprivation. Sleep Med Rev. 17:273–84.
- Hobson SR, Lim R, Gardiner EE, et al. (2013). Phase I pilot clinical trial of antenatal maternally administered melatonin to decrease the level of oxidative stress in human pregnancies affected by pre-eclampsia (PAMPR): Study protocol. BMJ Open. 3:e003788.
- Hogg K, Blair JD, McFadden DE, et al. (2013). Early onset pre-eclampsia is associated with altered DNA methylation of cortisol-signalling and steroidogenic genes in the placenta. PLoS One. 8:e62969.
- Hung TH, Burton GJ. (2006). Hypoxia and reoxygenation: A possible mechanism for placental oxidative stress in preeclampsia. Taiwan J Obstet Gynecol. 45:189–200.
- Jaddoe VW, de Jonge LL, Hofman A, et al. (2014). First trimester fetal growth restriction and cardiovascular risk factors in school age children: Population based cohort study. BMJ. 348:g14.
- Joo JE, Hiden U, Lassance L, et al. (2013). Variable promoter methylation contributes to differential expression of key genes in human placenta-derived venous and arterial endothelial cells. BMC Genomics. 14:475.
- Knutsson A. (2003). Health disorders of shift workers. Occup Med (Lond). 53:103–8.
- Kulkarni A, Chavan-Gautam P, Mehendale S, et al. (2011). Global DNA methylation patterns in placenta and its association with maternal hypertension in pre-eclampsia. DNA Cell Biol. 30:79–84.
- Lamia KA, Sachdeva UM, DiTacchio L, et al. (2009). AMPK regulates the circadian clock by cryptochrome phosphorylation and degradation. Science. 326:437–40.
- Mahoney MM. (2010). Shift work, jet lag, and female reproduction. Int J Endocrinol. 2010:813764
- McNamara P, Seo SB, Rudic RD, et al. (2001). Regulation of CLOCK and MOP4 by nuclear hormone receptors in the vasculature: A humoral mechanism to reset a peripheral clock. Cell. 105:877–89.
- Mozurkewich EL, Luke B, Avni M, et al. (2000). Working conditions and adverse pregnancy outcome: A meta-analysis. Obstet Gynecol. 95:623–35.
- O’Neill JS and Reddy AB. (2011). Circadian clocks in human red blood cells. Nature. 469:498–503.
- Olcese J. (2012). Circadian aspects of mammalian parturition: A review. Mol Cell Endocrinol. 349:62–7.
- Panda S, Antoch MP, Miller BH, et al. (2002). Coordinated transcription of key pathways in the mouse by the circadian clock. Cell. 109:307–20.
- Panda S, Hogenesch JB and Kay SA. (2002). Circadian rhythms from flies to human. Nature. 417:329–35.
- Redman CW, Sargent IL. (2003). Pre-eclampsia, the placenta and the maternal systemic inflammatory response: A review. Placenta. 24:S21–7.
- Roenneberg T, Merrow M. (2016). The circadian clock and human health. Curr Biol. 26:R432–43.
- Steegers-Theunissen RP, Verheijden-Paulissen JJ, van Uitert EM, et al. (2016). Cohort profile: The Rotterdam periconceptional cohort (Predict Study). Int J Epidemiol. 45(2):374–81.
- Steegers EA, von Dadelszen P, Duvekot JJ, et al. (2010). Pre-eclampsia. Lancet. 376:631–44.
- Sundrani DP, Reddy US, Joshi AA, et al. (2013). Differential placental methylation and expression of VEGF, FLT-1 and KDR genes in human term and preterm preeclampsia. Clin Epigenetics. 5:6
- Touleimat N, Tost J. (2012). Complete pipeline for Infinium ((R)) Human Methylation 450K BeadChip data processing using subset quantile normalization for accurate DNA methylation estimation. Epigenomics. 4:325–41.
- Tranquilli AL BM, Zeeman GG, Dekker G, Sibai BM. (2013). The definition of severe and early-onset preeclampsia. Statements from the International Society for the Study of Hypertension in Pregnancy (ISSHP). Pregnancy Hypertens. 3:44–47.
- Tranquilli ALDG, Magee L, Roberts J, et al. (2014). The classification, diagnosis and management of the hypertensive disorders of pregnancy: A revised statement from the ISSHP. Pregnancy Hypertens. 4:97–104.
- Valenzuela FJ, Vera J, Venegas C, et al. (2015). Circadian system and melatonin hormone: Risk factors for complications during pregnancy. Obstet Gynecol Int. 2015:825802
- Vanselow K, Kramer A. (2007). Role of phosphorylation in the mammalian circadian clock. Cold Spring Harb Symp Quant Biol. 72:167–76.
- Vollmers C, Schmitz RJ, Nathanson J, et al. (2012). Circadian oscillations of protein-coding and regulatory RNAs in a highly dynamic mammalian liver epigenome. Cell Metab. 16:833–45.
- Waddell BJ, Wharfe MD, Crew RC, et al. (2012). A rhythmic placenta? Circadian variation, clock genes and placental function. Placenta. 33:533–9.
- Wergeland E, Strand K. (1997). Working conditions and prevalence of pre-eclampsia, Norway 1989. Int J Gynaecol Obstet. 58:189–96.
- Yuen RK, Penaherrera MS, von Dadelszen P, et al. (2010). DNA methylation profiling of human placentas reveals promoter hypomethylation of multiple genes in early-onset preeclampsia. Eur J Hum Genet. 18:1006–12.
- Zhang R, Lahens NF, Ballance HI, et al. (2014). A circadian gene expression atlas in mammals: Implications for biology and medicine. Proc Natl Acad Sci USA. 111:16219–24.