
ABSTRACT
In the contemporary era, when life habits are largely determined by social needs and individual preferences, sleep is nevertheless affected by seasonal environmental changes. Japan has large seasonal and geographical alterations of photoperiod and climate. Japan does not adopt the daylight saving time (DST) system, making it a suitable country for the study of seasonal variations in natural human sleep. The aim of this study was to analyze the seasonal changes in the sleep properties (timing and quality) and identify their relationship with environmental changes. Here, we report an analysis of objective sleep data of 691 161 nights collected from 1856 Japanese participants (age 20–79 years, male 91%, female 9%) for 3 years using contactless biomotion sensors. Sleep onset time did not show clear seasonal variation, but sleep offset time showed a seasonal change with a single latest peak in winter. Seasonal variation was larger during weekends than during weekdays. Sleep offset time well correlated with sunrise time but was different in spring and autumn even when the sunrise time was same, suggesting the role of temperature difference. Sleep quality, estimated by wake time after sleep onset and sleep efficiency, showed seasonal changes with the lowest trough around mid-summer. In conclusion, despite profound social influences, the timing and quality of sleep showed seasonal fluctuation indicating that they were influenced by climate factors even in the developed country.
Introduction
Contemporary daily life schedules are determined predominantly by social factors especially in the developed societies, such as the starting time and ending time of school and companies, and by individual preference, such as chronotype, spare time activities, or TV programs (Adan et al. Citation2012). Abundant artificial light and air-conditioning create artificial environments that differ from the natural climate. As a result, sleep habits have changed significantly and the average sleep duration has become shorter in Japan like other countries. Surveys showed sleep time shortened by more than half hour in recent 15 years between 1995 and 2010 in Japan (Nishitani et al. Citation2013), and consequently, the importance of sleep health is now more emphasized (Morgenthaler et al. Citation2015).
The effects of environmental climate factors, especially light and temperature, on sleep and circadian rhythm have been scientifically investigated in artificial environments in laboratories through strictly controlled protocols. In a laboratory study, the weak light which simulated dawn was enough to advance the phase of circadian rhythm (Danilenko et al. Citation2000). In a comparison study using questionnaire between cities of different degrees of longitude, the adjusted mid-sleep time correlated to the sunrise time (Roenneberg et al. Citation2007). The impacts of cold and hot temperatures on human sleep were also known from human thermoregulation studies (Okamoto-Mizuno and Mizuno Citation2012). Exposures to both cold or hot temperatures increased the total time of wakefulness in a laboratory environment (Haskell et al. Citation1981). When the participants were allowed to sleep with ordinary bedding, there was no significant difference between cold and normal temperatures (Muzet et al. Citation1984). However, due to the large differences between individuals and the complex interactions of multiple environmental factors, little is known how natural climate changes affect human sleep in the developed societies.
Seasonal rhythms in humans have been described for many biological indices and behaviors (Foster and Roenneberg Citation2008). Seasonal adaptations investigated by polysomnography (PSG) in laboratory environments in the 1990s showed later bedtime, later wake-up time, increased time of rapid eye movement (REM) sleep, and decreased time of stage 4 of NREM (non-REM) sleep in winter compared with summer (Kohsaka et al. Citation1992). In addition to sleep parameters, markers of circadian rhythms such as rectal temperature and melatonin display a delay in winter compared to summer (Honma et al. Citation1992; Van Dongen et al. Citation1997).
Real-world human seasonal rhythm studies using actigraphy or questionnaires have been published in recent years. For example, large-scale population studies using questionnaire showed later wake-up time and longer sleep duration in winter in central European countries (Kantermann et al. Citation2007). Studies using actigraphy in three preindustrial societies reported similar results, while morning ambient temperature affected the sleep offset time independent from sunlight (Yetish et al. Citation2015).
Large-scale population studies using questionnaires, however, have reported different results of subjective assessments for sleep quality based on the season. For example, randomly selected adults in Norway had more sleep onset problems and daytime impairment in December than in June (Pallesen et al. Citation2001), but another study reported that quality of sleep is worse during the summer in Finland (Ohayon and Partinen Citation2002). Furthermore, there are no significant differences in the data collected between April through September and October through March (Janson et al. Citation1995), and no evidence of seasonal variation in reports of insomnia symptoms or time in bed (Sivertsen et al. Citation2011).
Japan has a small area, which is almost equivalent to Germany and one 25th of the United States. However, it spans in the north-south axis, which approximates the distance from Maine to Florida, or France to the center of Algeria. Actually, Tokyo is located at 135° east longitude and 40° north latitude. It is about the same latitude as North Carolina and a little south of Algiers. These geographical characteristics give Japan a big variation in seasonal climate. In addition, as opposed to many European and American countries, Japan does not adopt DST (summer time), which presents a large artificial impact on natural human sleep patterns and other healthcare issues (Foerch et al. Citation2008; Janszky and Ljung Citation2008). Therefore, Japan is regarded as a suitable country to study natural seasonal changes in sleep patterns.
We developed and commercialized a contactless biomotion sensor, which showed equivalent sleep judgment potency as actigraphy in 2012 (Hashizaki et al. Citation2014), and more than 7000 sensors have been sold and are now in use by Japanese consumers. Their sleep data are collected in our data server through the internet, which enables the objective, large-scale study of sleep patterns. As a preliminary study, we reported an age-dependent difference in sleep time between weekends and weekdays (Hashizaki et al. Citation2015). The aim of the present study was to analyze the seasonal changes in the sleep pattern in large-scale, real-world data, and identify their relationship with environmental changes.
Methods
Contactless biomotion sensor
The consumer model of a contactless biomotion sensor (HSL-101, Omron Healthcare Co., Ltd., Kyoto, Japan) that detects radiofrequency waves was used to determine the participants’ sleep-wake state based on their bodily and respiratory movements located near their pillow (De Chazal et al. Citation2011). It classifies each 30 s epoch into four categories (sleep/wake/absent/unknown). The “unknown” and “absent” categories signify that nobody was within the range of the sensor (45° area, 50–200 cm from the sensor). As this sensor is designed for one person’s use, it cannot measure accurately, when another person is in the range of the sensor, which happens when a couple sleeps in one bed. Thus, the manual states this limitation. Two independent validation studies of this sensor were published. The first study was done by ourselves. We analyzed the data of outclinic patients who underwent PSG for the purpose of diagnosing sleep apnea but found to be free from sleep apnea or other pathological findings (Hashizaki et al. Citation2014). The other study recruited volunteers, who were believed to be free of sleep-disordered breathing and primary insomnia (O’Hare et al. Citation2014). The overall accuracies of each 30 s epoch were 84.1% and 85.6%, sensitivities to sleep were 91.8% and 95.3%, sensitivities to wake were 37.6% and 38.9%, and Cohen’s kappa coefficients were 0.31 and 0.53 compared with PSG in these two separate studies, respectively.
The contactless biomotion sensor used in this study is capable of start and end the measurement period in two ways, namely “automatic measurement mode” and “manual measurement mode.” Using “automatic measurement” mode, the users do not have to start or stop the measurement every night, but the sensor automatically starts and stops the measurement when the users stay within the range of the sensor. Using “manual measurement” mode, the users need to push start or stop button everytime when they want to measure their sleep. In this study, we used the data taken by both modes. We excluded overnight data obtained on nights in which an “absent” label was attached between the sleep/wake periods. We took this approach to avoid two types of measurement errors, about which we described in detail in our previous study (Hashizaki et al. Citation2015).
Participants
Participants were selected from a database of 6038 individuals who had bought and used contactless biomotion sensors and registered with a web-based health data application. The measurement period was from January 2013 to December 2015. We accumulated 1 234 914 nights of data. As shown in the flowchart in , we excluded individuals aged less than 20 or more than 79 years because the numbers of the users in these age groups were too small. We previously reported that differences in sleep parameters between weekdays and weekends are evident (Hashizaki et al. Citation2015); thus, we separated these data into two groups: weekdays (Sunday to Thursday) and weekends (Friday and Saturday). We did not include weeks containing a public holiday or a long series of public holidays, such as the New Year’s holiday (31 December to 3 January), Golden Week holiday (29 April to 5 May), and mid-summer holiday (13–16 August). In addition, we excluded data outside two standard deviations (SD) in three sleep parameters: sleep onset time, sleep offset time, and time in bed. This process was conducted on both weekday and weekend groups. In order to minimize the effects from the variation between individuals for the seasonal change analysis, the users who have more than one data every month during one year, meaning the users who keep using the sensor, at least longer than one year, and have at least 12 data around one year were extracted. By this procedure, 4182 individuals from 6038 were removed from the analysis. As a result, we analyzed a total of 691 161 participant-nights (56.0% of the total data) obtained from 1856 participants (30.7% of the total users; male 91%, female 9%). shows the participants’ demographic information. shows the percentage of participant-nights according to the gender and age decade.
Table 1. Participants’ characteristics median age was calculated using all nights.
Figure 1. Flowchart of inclusion and exclusion criteria of participants and daily sleep data. The difference indicates the number of nights excluded at each step.
Figure 2. The distribution of participant-nights shown in percentages according to gender and age decade used for analysis. Black bars, males; gray bars, females.
Data collection
The contactless biomotion sensor is capable of uploading the data that collected to a web-based healthcare application via a computer software using USB connection or a smartphone application using near-field communication connection. Informed consent for the anonymous use of their sleep data was obtained from all participants when they first started to use the web-based application. The participants were informed about the data confidentiality and handling procedures employed in this study prior to their consent being obtained. All the data were stored on a secured server with the privacy information, and we obtained sleep data along with information on age, sex, and place (prefecture) of residence of the user without any other personal information. The procedures were approved by each institutional review board as written at the end of this article.
Outside temperature data in all Japan prefectures were provided by the Japan Weather Association, and the hourly data were used in the analysis. The daily sun time data in all prefectures (sunrise time, sunset time) were collected by the National Astronomical Observatory of Japan.
Data analysis
The number of data collected by each participant differed (minimum: 28 night, maximum: 817 nights, mean: 372 nights). We examined five sleep parameters in this study: (a) sleep onset time, (b) sleep offset time, (c) mid-sleep time (MS), (d) wake time after sleep onset (WASO), and (e) sleep efficiency (SE). Sleep onset time is the first epoch, which is labeled as sleep after the initiation of one night of measurement. Sleep offset time is the next epoch to the last epoch labeled as sleep. MS is defined as, MS = sleep onset time + (sleep offset time – sleep onset time)/2 (Wittmann et al. Citation2006). WASO is defined as the sum of all wake epochs between sleep onset and the last epoch labeled as sleep. SE is the ratio of the total sleep time to the time spent in bed multiplied by 100. WASO and SE are regarded as the parameters reflecting sleep quality in this study.
As for outside temperature, we averaged 10 hourly temperature data between 23:00 to the next 8:00 from each prefecture and used it for that night. When one prefecture had more than one observatory, all observatory data were included. This averaged temperature data of each prefecture were connected to each daily sleep data using the participant’s residential information. Sunrise and sunset time data for each prefectural capital were also linked to sleep data in the same way.
As for statistical analysis, we approximated all the individual night data with the linear mixed-effects regression fitting for seasonality (sine and cosine), age, type of day (weekdays and weekend days), and sex (Matthews et al. Citation2001; Ma et al. Citation2006). All sleep parameters for each night were adjusted using coefficients of the independent variable (age, type of day, and sex) and random effects for intercept (each user). The baseline values were set at 50 years old, weekday, and male, because of the largest attribution in our data. Input data for seasonal parameters are the date. There are two kinds of seasonal change, namely single peak seasonality and two peaks seasonality in a year. Therefore, we set two cycle parameters in sine and cosine, 2/365 days for single peak seasonality, 2/365 days and 4/365 days for two peaks seasonality. For phase analysis of sleep parameters, maximum and minimum values were calculated from the model. The approximate equation contains five parameters for four factors as below:
For single peak seasonality: sleep onset time, sleep offset time, mid-sleep time, and total sleep time (g: random effects of intercept, i: user)
For two peaks seasonality: SE and WASO (j: random effects of intercept, i: user)
To clarify the seasonal difference statistically, we performed monthly comparisons using monthly averaged data using a random sampling method (Efron and Tibshirani Citation1993). Since the numbers of the data each user had were different, monthly data were created by a random sampling of only one data from each user during each month (total numbers of data used in one set were 22 272: 1856 users × 12 months), which were adjusted for age, sex, and type of day using coefficients of the model described above. After the creation of a monthly averaged data set for all five parameters, the multiple comparison test (Bonferroni correction) was performed for this data set and the p-value was calculated. This procedure consisting of a monthly data creation and a multiple comparison test was repeated for 1000 times. Then, the mean and the median of the p-values from 1000 data sets were calculated.
All data processing and statistical analyses were conducted using the statistical software R, version 3.
Results
The annual phases of the seasonal changes
In order to investigate the phase of seasonal change, we performed a model analysis. We approximated the data with the sine curve fitting for annual change and the linear fitting for age, type of day (weekdays and weekend days), and sex, and the results are shown in Supplemental Table 1.
According to these results, we adjusted all the data to 50-year-old male. We then calculated the amplitude and maximum and minimum date to evaluate the magnitude and the annual phase of seasonal changes. shows the summary of the calculation of five parameters. Apparently, the annual temperature change followed the annual photoperiod change. The earliest sunrise time is in early June and the highest temperature day is in early August, with a difference of 2 months in Japan. The earliest sleep offset time is in middle of July, which is approximately halfway between the sunrise and temperature peaks.
Table 2. Date of maximum, minimum points of each parameter. Maximum and minimum dates were calculated using linear mixed-effects regression in summer and winter.
On the other hand, the day with the maximal WASO during summer, meaning the worst sleep quality, was nearly synchronous with the highest temperature day. The minimal SE also corresponded to the highest temperature day.
Seasonal changes in sleep parameters over 3-year periods
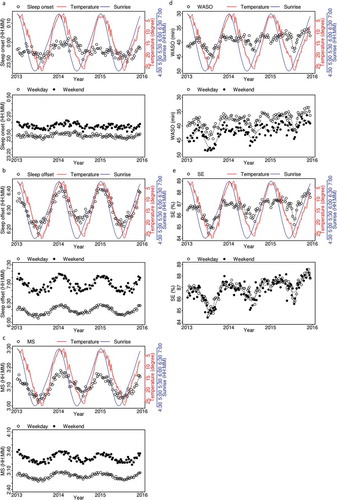
shows the changes in five sleep parameters plotted as weekly time series data over 3 years. The age- and sex-adjusted averages of the total data are shown in each upper panel with temperature (red) and sunrise time (blue). Separated weekday and weekend data are plotted in each lower panel. Sleep onset time did not show a clear periodic variation over 3 years, even after the separation of weekdays and weekends ()). On the other hand, sleep offset time showed a significant change with a single peak within a year, especially during weekends ()). Sleep offset in mid-winter is later by nearly 30 min than that in mid-summer during weekends. Surprisingly, even during weekdays, the seasonal difference was observed. Due to the sleep onset and offset time fluctuation, the mid-sleep time also changed across the seasons ()). Both WASO and SE reflect intervening arousal during sleep and indicate the sleep quality. Since the increase of WASO means the worsening of sleep, we reversely plotted WASO ()). As shown in ) and (e), WASO and SE showed similar seasonal changes having one major trough during summer and another during winter (note that trough of WASO means the longest, as WASO plot is upside down). The big trough during summer corresponded to the hottest temperature days, while the second trough during winter corresponded to the coldest temperature days.
Figure 3. Weekly changes of the averages of the sleep parameters for all participants (adjusted for sex and age; open circles), temperature (red line, upside down), and sunrise time (blue line). Upper panels: All day averages. Lower panels: Weekday average (open circles) and weekend average (filled circles). Dotted line indicates smoothed data with spline interpolation. One plotted dot corresponds to more than 500 participant-nights. (a) Sleep onset time, (b) sleep offset time, (c) mid-sleep (MS), (d) wakefulness after sleep onset (WASO), (e) sleep efficiency (SE).
Correlation with temperature and light phases
We next investigated the relationship between sleep parameters and outside temperature and sunrise time. shows the sleep parameter plots against temperature and sunrise time. Since the seasonal fluctuation is small, sleep onset time did not show a clear correlation with either temperature or sunrise time ()). Sleep offset time showed correlations with both temperature and sunrise time ()). Sleep offset time became earlier within the temperature region between 5 and 25°C and almost linearly correlated with sunrise time. MS also showed a similar trend, but the correlation was slightly weaker than the sleep offset time ()). WASO showed U-shaped correlation with temperature ()). WASO was at the minimum at around 15°, and increased gradually with colder temperatures and increased rapidly with higher temperatures. WASO showed a complex correlation curve with sunrise time. SE showed an inverse U shape correlation with the temperature ()). SE was at the maximum at around 15° and decreased very gradually with colder temperatures and decreased very rapidly with higher temperatures.
Figure 4. Correlation of the averaged sleep parameters adjusted age and sex, (a) sleep onset time, (b) sleep offset time, (c) MS, (d) WASO, and (e) SE compared with sunrise time every 5 min (left panels) and temperature (right panels). All day (open circles), weekday (open triangles), and weekend (crosses). Averaged data are plotted. Dotted lines indicate smoothed data with spline interpolation. One plotted dot corresponds to more than 500 participant-nights.
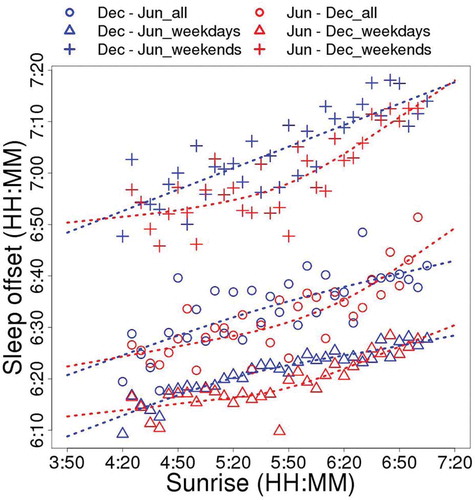
In order to clarify the relationship between sleep offset time and sunrise time more in detail, the data were separated into two groups according to the period, one from winter solstice to summer solstice (December–June, , blue) and the other from summer solstice to winter solstice (June–December, , red). The sleep offset time is earlier in the latter group (June–December), meaning the sleep offset time in autumn is earlier than that in spring when the sunrise time is same.
Figure 5. Correlation of the average of sleep offset time adjusted by age and sex with sunrise time every 5 min (corresponds to ), right panel). All day (open circles), weekday (open triangles), and weekend (crosses). Average data are plotted. The data are also divided into two periods (Dec, winter solstice to Jun, summer solstice; blue, and Jun, summer solstice to Dec, winter solstice; red). Dotted lines indicate smoothed data with spline interpolation. One plotted dot corresponds to more than 250 participant-nights.
The magnitude of seasonal differences in sleep parameters
In order to validate the seasonal difference statistically, we made 1000 monthly averaged data sets using randomly picked up one data during a month from each participant and performed multiple comparison test. This removed the variation derived from the difference of the number of nights between participants, and thus, each participant equally contributes to the monthly average. Representative comparisons are shown in , and all the data are shown in Supplemental Tables 2(a)–(e). As for sleep onset time, there were no significant differences between any two months. Mean p-value was 0.88 and the median p-value was 1.00 for the comparison between March and August, in which sleep onset time was the earliest and the latest, respectively (). On the other hand, sleep offset time was significantly different between January and July (mean p-value < 0.01 and median p-value < 0.01) and magnitude of difference in these months was 15 min. Regarding sleep offset difference, mid-sleep time was also different between January and July (mean p-value < 0.01 and median p-value < 0.01) in the 9-min magnitude. Concerning the indicators of sleep quality, WASO was slightly different between July and November (mean p-value was 0.19, the median p-value was 0.02). But the magnitude of difference was small (3 m). On the other hand, SE was different in the same month comparison (mean p-value < 0.01, median p-value < 0.01), and the difference was by 2%.
Table 3. Comparison of each sleep parameters in monthly data. Mean, median, and standard deviation of p-value were calculated using 1000 times repeated multiple comparison tests with Bonferroni correction result. Data were adjusted for age, sex, and type of day.
Discussion
In this study, we analyzed seasonal changes in human sleep using large-scale longitudinal objective sleep data in the Japanese population obtained by contactless biomotion sensor-based sleep monitors. Since the data were ambulatory and from an age–sex mixed population, we constructed a predicting model of each sleep parameters and adjusted the data with the coefficients of regression, and we calculated the mean values of all the participants’ data adjusted to a male 50-year-old subject. We found significant seasonal differences both in the phase (sleep offset time and MS) and the quality of sleep (WASO and SE). As for sleep/wake phases, sleep onset time was stable over the course of a year, while sleep offset time changed significantly according to the season of the year. This suggested that Japanese people spend nighttimes according to their own preferred schedule, and the bedtime was not significantly affected by the natural climate changes. Sleep offset time correlated with the change of sunrise time and temperature. The peak time and the nadir time of sleep offset were between the peak and troughs of sunrise and temperature, suggesting that sleep offset time may be affected by both factors.
The maximal seasonal difference, i.e. amplitude, of the sleep offset time on weekends (30.7 min) was larger than that on weekdays (16.9 min) (see )), suggesting that sleep offset time on weekends is more susceptible to natural environmental changes. However, the amplitude of sleep offset time on weekends was smaller than the difference of sleep offset time between weekday and weekends (44.0 min). Since the seasonal change in sleep onset time of our data was small, this difference well corresponded to the social jet lag, which is the absolute difference between the midpoint of sleep on weekends (work-free days) and on weekdays (workdays; Wittmann et al. Citation2006). In our study, the difference of mid-sleep time between weekday and weekends was 32.4 min. The results suggested that the effects of social restraints are stronger than the effects of natural environmental changes.
Our results are comparable to a recent study which investigated the seasonality of sleep-wake habits using a large-scale questionnaire of the population in Europe (Allebrandt et al. Citation2014). First, seasonal changes of photoperiod influenced the mid-sleep time through the year, especially on weekends. Second, social jet lag contributed to a greater extent to the variation in sleep duration than natural seasonal sleep time variation. As discussed above, the amplitude of fluctuation through the year was smaller than the difference between weekdays and weekend. The uniqueness of our study using the Japanese population instead of people from other countries is the absence of DST in Japan. One previous study indicated that the human circadian system could not adjust to the transition pertaining to DST and that the seasonal adaptation to changing photoperiods is disrupted by the introduction of DST (Kantermann et al. Citation2007). Under both controlled conditions and natural routine life in young males, significant seasonality was detected in the in-bed and wake-up times (Honma et al. Citation1992; Kohsaka et al. Citation1992). In another study of elderly subjects using actigraphy at home, a significant difference was detected only in wake-up time (Okamoto-Mizuno and Tsuzuki Citation2010). Our results coincided with the latter study. One possible explanation for this discrepancy is the difference in measurement conditions, particularly in the artificial conditions of the laboratory compared to natural conditions at home. In an advanced society, as we are exposed to strong artificial lights after sunset and our life is influenced by social factors, the effects of seasonal sunlight differences on in-bed time become weaker. On the other hand, we are exposed earlier to direct sunlight and warmer temperature in the morning during summer, which is strongly influential.
In our previous study, we showed bedtime and wake-up times were more delayed on weekends than on weekdays (Hashizaki et al. Citation2015). This study showed that the magnitude of fluctuation of sleep offset time is larger on weekends than on weekdays (see )). This suggests that social needs more strongly regulate activity during weekdays, and the effects of natural entrainment factors emerge more explicitly on weekends when people usually become released from social obligations. However, it was unexpected to us that even on weekdays, sleep offset time fluctuated clearly according to the season, while the starting times of societal obligations remain the same throughout the year. The seasonal variation, however, is smaller than social jet lag, also reflected in the results from previous work that examined the chronotype of nearly 10 000 people in Europe using the Munich Chronotype Questionnaire (Wittmann et al. Citation2006).
Another interesting finding of our study is the relationship of the phases of sleep offset time and natural photoperiods. The phases of natural seasonal climate changes, i.e. photoperiods and temperature, are different. From winter to summer, sunrise time, sunset time, and temperature get earlier, later, and higher, respectively. They reach their summer peaks in Japan on approximately June 9, June 26, and August 1, respectively. Day length becomes longer and the longest day is around June 21, which is between the earliest sunrise and the latest sunset. There is a nearly 2-month difference between the day of the earliest sunrise and the day of highest temperature in Japan. The earliest sleep offset time was observed around the middle of July, which was after all of the photoperiod-related peaks (sunrise, sunset, and day length) and before the temperature peak. Similarly, from summer to winter, sunrise time, sunset time, and temperature become later, earlier, and lower, respectively. They reached to their winter peaks at around January 4, December 3, and middle of January, respectively. Day length becomes shorter and the shortest day is around December 21. The latest sleep offset time was around the middle of January, which is near the temperature nadir. Therefore, when we compare spring and autumn, when the sunrise times are equal, sleep offset time in spring is later than in autumn. Since our circadian time is entrained strongly by cycles of light/dark (Roenneberg et al. Citation2007; Friborg et al. Citation2012), this delay may be due to nonphotic entrainment, including temperature. This result coincided with a previous study demonstrating that sleep offset time is different in two populations, in spite of similar sunlight condition. The authors speculated the difference might be due to the difference of morning ambient temperatures (Yetish et al. Citation2015). In sum, the timing of sleep may have been affected by multiple environmental factors, predominantly photoperiod, but the impact is smaller compared with the effects of social needs.
The most remarkable finding of our study is the seasonal changes in objective sleep quality estimated by SE and WASO. It is very hard to assess these parameters properly by subjective sleep log scoring or questionnaire, because it is difficult to measure sleep latency and WASO precisely by a subjective method. Objective methods are therefore required to look into objective sleep quality. Since previous objective measures such as actigraphy place some burdens on the subjects because it should be worn on the wrist during sleep. Some subjects, such as children with autism spectrum disorder, sometimes cannot sleep with actigraphy due to their hypersensitiveness. A contactless sensor is expected to have the least effects on sleep quality by itself. In addition, our monitor is relatively cheap (about $200). Nighttime scoring starts either automatically or manually by pushing one button. The resulting data are transferred over the internet and thus the cost of gathering data is almost negligible. These characteristics enabled us to collect and analyze large-scale longitudinal data. One good indicator of sleep quality, WASO, increased in both high and low temperatures. Previous studies reported that both cold exposure and heat exposure increased the total time of wakefulness in a laboratory environment; however, the subjects were not allowed to wear a night suit or use a blanket, which differs from real life (Haskell et al. Citation1981). There was no significant difference between cold exposure and normal conditions if the subject uses normal bedding (Muzet et al. Citation1984). A study reported that in elderly people, WASO significantly increased in summer compared to fall and winter, where the outside temperatures were 25.2, 9, and 1.4°C, and bedroom temperatures were 27.7, 15.4, and 9.5°C, respectively (Okamoto-Mizuno and Tsuzuki Citation2010). In another study in community-dwelling aged people, there was no significant difference in sleep efficiency and waking time among four seasons, but the minimum value of sleep efficiency was observed in summer (Kume et al. Citation2017). Our study did not measure the bedroom temperatures and we do not know how different they were from outside temperatures in each participant’s environment. But the results indicated that even using the preferred settings of participants’ air conditioners, bedding, and outfit inside houses, both the hottest and the coldest outside temperatures might have increased WASO and impaired the sleep quality in Japan. Since the total sleep time in winter is longer than that of summer, the worsening changes in SE in winter is milder than that in summer.
Finally, our study has several limitations. First, the participants might not have been representative of the general Japanese populations because they took the initiative to buy the sleep monitors and upload the data to the web-based healthcare application. Thus, they may have preexisting sleep problems or have been interested in sleep for other reasons, since we do not have any health data of the participants. Second, since each participant recorded data for different numbers of days, statistical model taking into account individual variations was needed to assess the seasonal variations more accurately. Third, female participants were significantly less than male. Thus, we could not analyze the sexual difference, which may influence the results due to social and biological difference by gender. Fourth, although the validity of the system is confirmed, contactless biomotion sensors tend to underestimate wakefulness, and when participants are awake but motionless, the sensors sometimes judge participants as sleeping. Therefore, sleep onset latency and WASO may be shorter than the actual states. Fifth, we used only 30.7% of the participants and 56.0% of the nights in the database for the analysis, which reduce the size of the sample significantly. Sixth, we did not collect any subjective data on sleep in this study. Although it is important to have objective data, subjective satisfaction on sleep is a critical nature. We need to compare objective and subjective sleep quality in the future study. In spite of these limitations, the size of our data set is large enough to conclude that seasonal variation influences sleep phase and quality, which is very informative. Since some of the participants record other health parameters, such as blood pressure, body weight, exercise, and body temperature, which have been recorded in our database, we will analyze the relationship of seasonality to sleep and other parameters in future studies.
Ethical approval and informed consent
All the procedures in this study were performed in accordance with the ethical guidelines on epidemiological studies and legal regulations defined by the Ministry of Health, Labor, and Welfare, Japan. According to the above guideline and each institute’s own guideline, the study was approved by the institutional ethical review boards of Kumamoto University, to which KK belonged when this study was initiated in 2012, Kuwamizu Hospital, in which KK practice sleep medicine, and Omron Healthcare Company, which produced the sensors and possess all the data. Written informed consents were obtained when the users started to use the sensor and upload their data to the database. Individual data were extracted as anonymous and only age, sex, region (prefecture) of the residence data were provided and used.
Declaration of Interest
The instruments used in this study were developed and sold by Omron Healthcare Co., Ltd. This work was carried out as a collaboration between Omron Corporation, Omron Healthcare Co., Ltd., Kumamoto University, and Kuwamizu Hospital. All the cost of data collection and data analysis were defrayed by Omron Healthcare Co., Ltd.
ICBI_1443118_Supplementary_Material.pdf
Download PDF (90.6 KB)Acknowledgements
The authors would like to thank the users of the sensor for their participation to this study, Dr. Till Roenneberg (Ludwig Maximilians University) for constructive comments, and Dr. Masahiro Tohkin (Nagoya City University) for advice on the statistics.
Supplementary Material
Supplemental data for this article can be accessed here.
Additional information
Notes on contributors
Kazuhiko Kume
MH, HN, TS, MT, KK contributed to the sensor development, conceived the study design, MH and KK analyzed the data, wrote the manuscript, KK directed the study.
References
- Adan A, Archer SN, Hidalgo MP, Milia LD, Natale V, Randler C. 2012. Circadian typology: A comprehensive review. Chronobiol Int. 29:1153–75. doi:10.3109/07420528.2012.719971.
- Allebrandt KV, Teder-Laving M, Kantermann T, Peters A, Campbell H, Rudan I, Wilson JF, Metspalu A, Roenneberg T. 2014. Chronotype and sleep duration: The influence of season of assessment. Chronobiol Int. 31:731–40. doi:10.3109/07420528.2014.901347.
- Chazal PD, Fox N, O’Hare E, Heneghan C, Zaffaroni A, Boyle P, Smith S, O’Connell C, McNicholas WT. 2011. Sleep/wake measurement using a non-contact biomotion sensor. J Sleep Res. 20:356–66. doi:10.1111/j.1365-2869.2010.00876.x.
- Danilenko KV, Wirz-Justice A, Kräuchi K, Cajochen C, Weber JM, Fairhurst S, Terman M. 2000. Phase advance after one or three simulated dawns in humans. Chronobiol Int. 17:659–68. doi:10.1081/CBI-100101072.
- Dongen HPAV, Kerkhof GA, Klöppel HB. 1997. Seasonal covariation of the circadian phases of rectal temperature and slow wave sleep onset. J Sleep Res. 6:19–25. doi:10.1046/j.1365-2869.1997.00021.x.
- Efron B, Tibshirani RJ. 1993. An Introduction to the Bootstrap (Chapman & Hall/CRC Monographs on Statistics & Applied Probability 57). New York, NY: Springer US.
- Foerch C, Korf H-W, Steinmetz H, Sitzer M. 2008. Abrupt shift of the pattern of diurnal variation in stroke onset with daylight saving time transitions. Circulation. 118:284–90. doi:10.1161/CIRCULATIONAHA.108.771246.
- Foster RG, Roenneberg T. 2008. Human responses to the geophysical daily, annual and lunar cycles. Curr Biol. 18:R784–R794. doi:10.1016/j.cub.2008.07.003.
- Friborg O, Bjorvatn B, Amponsah B, Pallesen S. 2012. Associations between seasonal variations in day length (photoperiod), sleep timing, sleep quality and mood: A comparison between Ghana (5°) and Norway (69°). J Sleep Res. 21:176–84. doi:10.1111/j.1365-2869.2011.00982.x.
- Hashizaki M, Nakajima H, Kume K. 2015. Monitoring of Weekly Sleep Pattern Variations at Home with a Contactless Biomotion Sensor. Sensors (Basel). 15:18950–64. doi:10.3390/s150818950.
- Hashizaki M, Nakajima H, Tsutsumi M, Shiga T, Chiba S, Yagi T, Ojima Y, Ikegami A, Kawabata M, Kume K. 2014. Accuracy validation of sleep measurements by a contactless biomotion sensor on subjects with suspected sleep apnea. Sleep Biol Rhythms. 12:106–15. doi:10.1111/sbr.12049.
- Haskell EH, Palca JW, Walker JM, Berger RJ, Heller HC. 1981. The effects of high and low ambient temperatures on human sleep stages. Electroencephalogr Clin Neurophysiol. 51:494–501. doi:10.1016/0013-4694(81)90226-1.
- Honma K, Honma S, Kohsaka M, Fukuda N. 1992. Seasonal variation in the human circadian rhythm: Dissociation between sleep and temperature rhythm. Am J Physiol. 262:R885–91.
- Janson C, Gislason T, Backer WD, Plaschke P, Björnsson E, Hetta J, Kristbjarnason H, Vermeire P, Boman G. 1995. Prevalence of sleep disturbances among young adults in three European countries. Sleep. 18:589–97.
- Janszky I, Ljung R. 2008. Shifts to and from daylight saving time and incidence of myocardial infarction. N Engl J Med. 359:1966–68. doi:10.1056/NEJMc0807104.
- Kantermann T, Juda M, Merrow M, Roenneberg T. 2007. The human circadian clock’s seasonal adjustment is disrupted by daylight saving time. Curr Biol. 17:1996–2000. doi:10.1016/j.cub.2007.10.025.
- Kohsaka M, Fukuda N, Honma K, Honma S, Morita N. 1992. Seasonality in human sleep. Experientia. 48:231–33. doi:10.1007/BF01930461.
- Kume Y, Makabe S, Singha-Dong N, Vajamun P, Apikomonkon H, Griffiths J. 2017. Seasonal effects on the sleep-wake cycle, the rest-activity rhythm and quality of life for Japanese and Thai older people. Chronobiol Int. 34:1377–87. doi:10.1080/07420528.2017.1372468.
- Ma Y, Olendzki BC, Li W, Hafner AR, Chiriboga D, Hebert JR, Campbell M, Sarnie M, Ockene IS. 2006. Seasonal variation in food intake, physical activity, and body weight in a predominantly overweight population. Eur J Clin Nutr. 60:519–28. doi:10.1038/sj.ejcn.1602346.
- Matthews CE, Freedson PS, Hebert JR, Stanek EJ, Merriam PA, Rosal MC, Ebbeling CB, Ockene IS. 2001. Seasonal variation in household, occupational, and leisure time physical activity: Longitudinal analyses from the seasonal variation of blood cholesterol study. Am J Epidemiol. 153:172–83. doi:10.1093/aje/153.2.172.
- Morgenthaler TI, Croft JB, Dort LC, Loeding LD, Mullington JM, Thomas SM. 2015. Development of the national healthy sleep awareness project sleep health surveillance questions. J Clin Sleep Med. 11:1057–62. doi:10.5664/jcsm.5026.
- Muzet A, Libert JP, Candas V. 1984. Ambient temperature and human sleep. Experientia. 40:425–29. doi:10.1007/BF01952376.
- Nishitani N, Sakakibara H, Akiyama I. 2013. Short Sleeping Time and Job Stress in Japanese White-Collar Workers. Open Sleep J. 6:104–09. doi:10.2174/1874620901306010104.
- O’Hare E, Flanagan D, Penzel T, Garcia C, Frohberg D, Heneghan C. 2014. A comparison of radio-frequency biomotion sensors and actigraphy versus polysomnography for the assessment of sleep in normal subjects. Sleep Breath. doi:10.1007/s11325-014-0967-z.
- Ohayon MM, Partinen M. 2002. Insomnia and global sleep dissatisfaction in Finland. J Sleep Res. 11:339–46. doi:10.1046/j.1365-2869.2002.00317.x.
- Okamoto-Mizuno K, Mizuno K. 2012. Effects of thermal environment on sleep and circadian rhythm. J Physiol Anthropol. 31:14. doi:10.1186/1880-6805-31-14.
- Okamoto-Mizuno K, Tsuzuki K. 2010. Effects of season on sleep and skin temperature in the elderly. Int J Biometeorol. 54:401–09. doi:10.1007/s00484-009-0291-7.
- Pallesen S, Nordhus IH, Nielsen GH, Havik OE, Kvale G, Johnsen BH, Skjøtskift S. 2001. Prevalence of insomnia in the adult Norwegian population. Sleep. 24:771–79.
- Roenneberg T, Kumar CJ, Merrow M. 2007. The human circadian clock entrains to sun time. Curr Biol. 17:R44–5. doi:10.1016/j.cub.2006.12.011.
- Sivertsen B, Overland S, Krokstad S, Mykletun A. 2011. Seasonal variations in sleep problems at latitude 63°-65° in Norway: The Nord-Trondelag Health Study, 1995-1997. Am J Epidemiol. 174:147–53. doi:10.1093/aje/kwr052.
- Wittmann M, Dinich J, Merrow M, Roenneberg T. 2006. Social jetlag: Misalignment of biological and social time. Chronobiol Int. 23:497–509. doi:10.1080/07420520500545979.
- Yetish G, Kaplan H, Gurven M, Wood B, Pontzer H, Manger PR, Wilson C, McGregor R, Siegel JM. 2015. Natural sleep and its seasonal variations in three pre-industrial societies. Curr Biol. 25:2862–68. doi:10.1016/j.cub.2015.09.046.